
Summary - Creating a KPI dashboard is an iterative process. It’s one thing to know you want to monitor KPIs, it’s another to create a KPI dashboard.
But first, what is a KPI dashboard?
A KPI dashboard is a reporting tool that brings your KPIs together in one place so you can compare current performance against strategic goals. It visualizes data with charts and graphs so you can quickly gain insight into performance.
Among customers, a critical success factor is getting alignment and buy-in for a KPI dashboard. You can put your dashboard in Excel, but if no one views or cares about it, results will stall.
How to create an effective KPI dashboard design
Many teams jump straight into the build. It is tempting to pick dashboard software such as Klipfolio Klips and expect an instant dashboard. Technology helps, but it is not the solution on its own. Building a useful KPI dashboard is a process that extends beyond the computer.
Here’s a framework for creating a KPI dashboard. Each step is outlined below.
- Define your key performance indicators
- Consult with stakeholders
- Sketch your dashboard’s design
- Select your KPI dashboard software
- Gather your key data points
- Create your data visualizations
- Schedule a feedback session
- Deploy your KPI dashboard

Step 1: Define your key performance indicators (KPIs)
Well-defined KPIs are the beating heart of a dashboard. Without meaningful KPIs, you might as well be watching the sky for signs that the business is successful.
Defining KPIs is about performance tracking and matching business objectives to internal processes. There are lots of KPI examples to guide you, but the path to success is asking tough questions about the business.
How do you know you’re monitoring a KPI? The difference between performance metrics and KPIs can be tricky.
Think of KPIs as having specific targets that directly impact outcomes. Revenue is a solid KPI for every business, but how about social media followers?
It might be, if that’s a success factor. If having 100,000 Instagram followers drives revenue, track toward that target.
When defining KPIs, start conversations with stakeholders, executives, managers, and employees from all areas of the business. Asking for input is the first step in building buy-in for a KPI dashboard. People will tell you what matters to them, which makes designing the dashboard much easier.
Learn more about how to define your organization’s KPIs.
Step 2: Consult with key stakeholders
Know your audience. A KPI dashboard is a communication medium, like email or a slide presentation. Understand who the dashboard is for, and you’ll quickly understand why it exists.
An executive has different data needs than a manager. This includes data latency, visualization design, and the amount of data shown. Executives may lean toward a reporting dashboard, while a manager may need an operational dashboard.
Spend the time here. Every minute consulting with stakeholders will save time during design and will improve adoption of reporting dashboards.
Step 3: Make your KPI dashboard
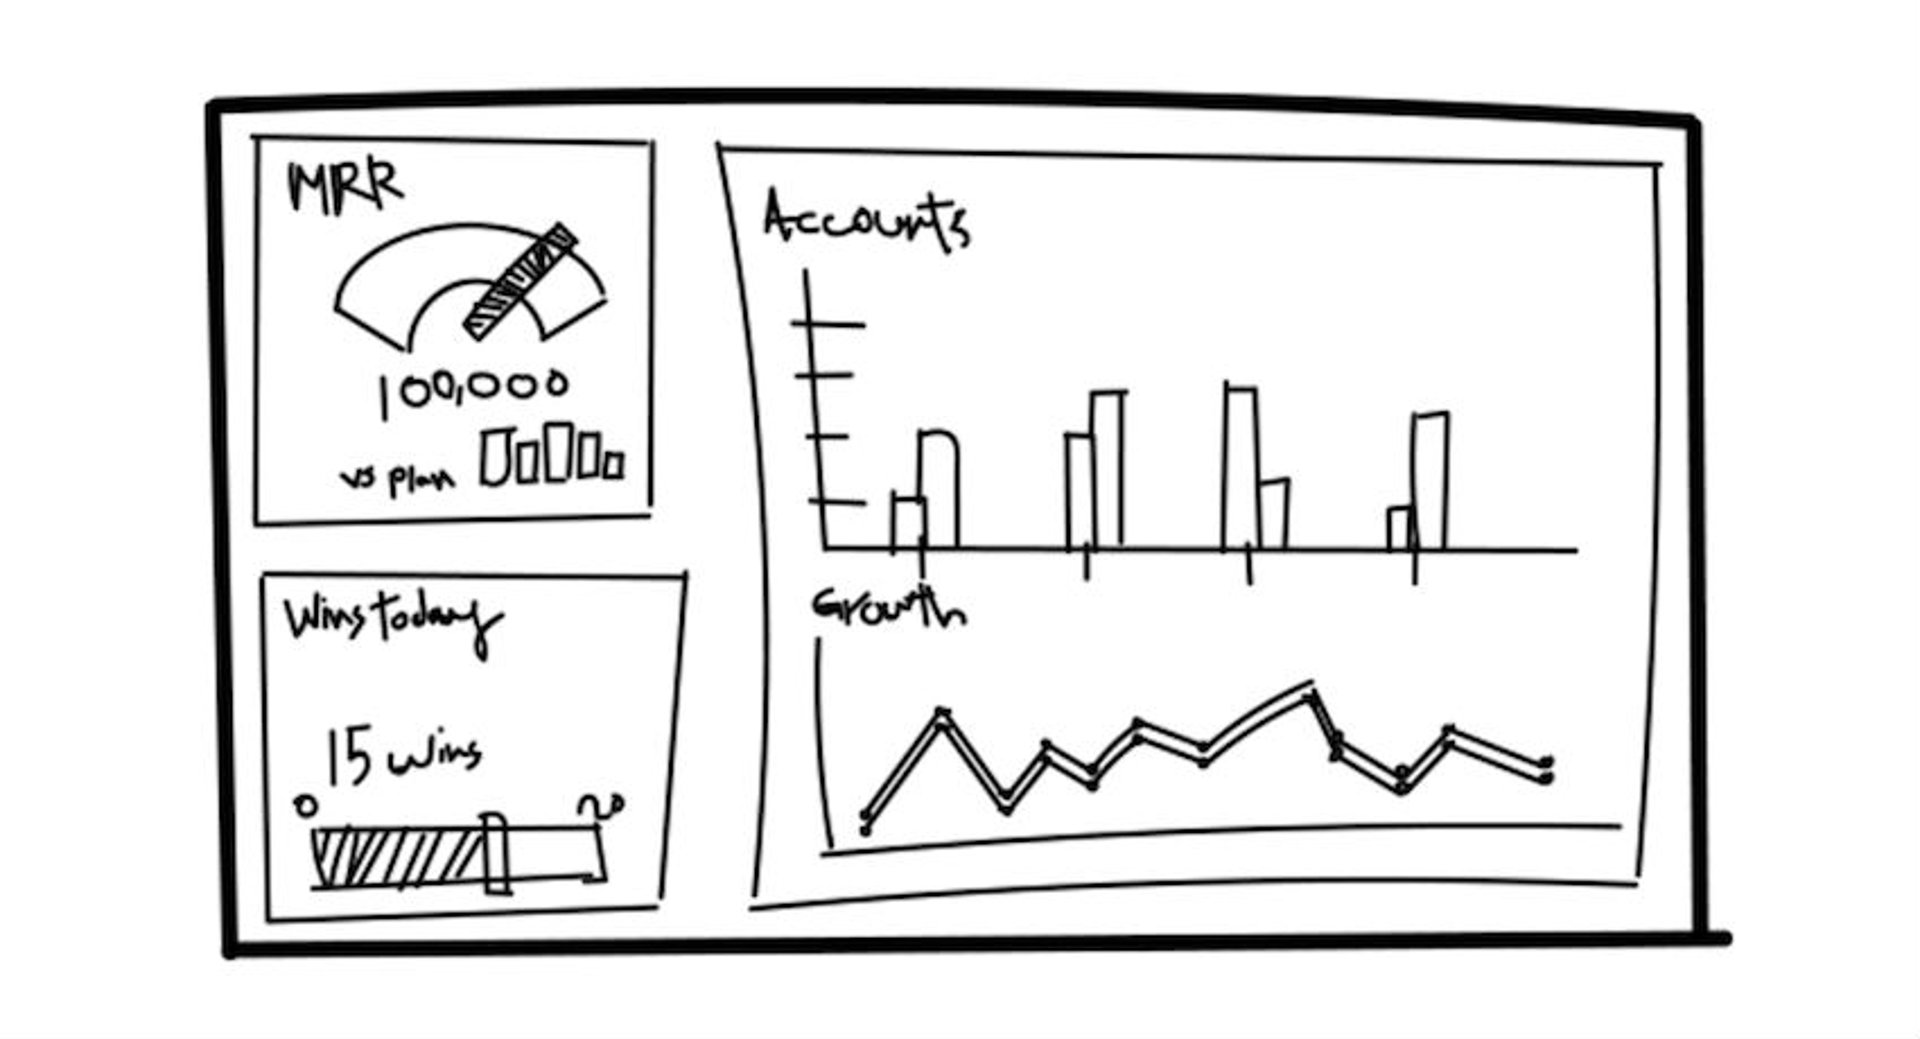
Many dashboards start with a napkin drawing. Choosing the most effective visualization for a KPI is not always obvious.
As you collect KPIs, a cohesive design often emerges. Maybe it’s a combination of charts and bullet charts; maybe it’s a mix of tables and sparklines.
As a general rule, visualizations should be simple enough that a new employee can understand the message at a glance. Build a low-fidelity prototype and review it with stakeholders to gauge impact.

Step 4: Select your dashboard KPI software
Dashboards exist to get data out into the organization. Consider these factors when choosing KPI dashboard software and making sense of your data:
- Price
- Time to deploy
- Ability to connect to data services
- Self-service vs. managed dashboard services
- Ability to publish dashboards via multiple channels
- Client management (if you’re building for customers)
You can build an effective KPI dashboard in PowerPoint or Excel. The challenge comes when you need to update the data.
In practice, KPI dashboards should save time when building and distributing reports. Dashboards inside other software can help as well, though teams may outgrow them.
Klipfolio Klips is dashboard and reporting software that supports real-time refreshes, TV display, public links, scheduled emails, and Slack sharing.
Step 5: Gather your key data points
Gathering data for a KPI dashboard usually means visiting several services, collaborating with operations to craft SQL queries, and sometimes using APIs to automate retrieval.
Each KPI you track has at least one data point from one system or another. Take time to map the data behind your most important KPIs.
APIs can be challenging for non-technical users, so here’s a post to help demystify APIs.
Many dashboard vendors offer professional services if this step is a roadblock.
Step 6: Create your data visualizations
This is the tip of the iceberg. The most effective dashboards adopt simplicity as a guiding principle.
If you’re choosing between a scatter plot and a bar chart, start with the bar chart.
Here are a few quick tips to remember as you make your dashboard design:
- Don’t build a one-size-fits-all dashboard template.
- Add comparison values wherever possible.
- Consider the orientation and arrangement of visualizations.
- Avoid pie charts. They rarely represent values precisely.
- Limit your use of colour. Think traffic lights.
A KPI dashboard isn’t a data analysis tool. Avoid using the dashboard to ask and answer questions; keep it focused on monitoring and tracking KPIs. Klipfolio Klips has a rich set of features and visualizations that will adapt, scale, and impress your users.
Step 7: Schedule a KPI feedback session
Bring stakeholders together to review the dashboard.
It can feel like a lot of feedback all at once, especially after investing time in the build. That’s normal. If people are engaged (even when they request changes), you’re on the right track.
KPI dashboards are iterative by nature. Share V1, then roll out V1.1 or V2.0 based on feedback. That momentum means people are viewing the dashboard and seeing its value.
Dashboards that become a daily habit are far more likely to succeed. Aim for daily views and design for that use case. Success depends on fostering adoption.
Step 8: Build and deploy your KPI dashboard
This is the fun part because you can start collecting high-fives for the work. Displaying dashboards on wall-mounted TVs encourages data transparency and alignment, and it looks great.
It’s an eye-catching way to get visibility for the KPIs powering the business. It also starts conversations that encourage adoption.
Most KPI dashboard software offers multiple distribution options. Consider:
- Email reporting and snapshot capabilities
- Published links to the dashboard for mass publication
- Integration to chat tools like Slack
- Direct access to the dashboard itself
Teams using Klipfolio Klips often share dashboards on TVs, send scheduled emails, and distribute private links for easy access across the company.
Learn to build KPI dashboards for humans
KPI dashboards must account for the human element above all else. Success hinges on how well the dashboard meets the needs, preferences, and behaviours of the people who will use it every day. Technology is useful, but it needs to be put to service solving human challenges.
Invest time in gathering feedback and encouraging conversations about KPIs. You’ll end up with a better dashboard—one the team can use to succeed.
Related Articles

6 dashboards I use daily to run my SaaS company
By Allan Wille, Co-Founder — April 10th, 2026
Business Metrics vs. KPIs: What’s the Difference?
By Jonathan Taylor — March 13th, 2026
The 5 most important SEO KPIs for digital marketing success
By Sanket Patel — February 24th, 2026
