

Summary - You might be asking yourself, “Why do I need to design a SaaS metrics dashboard?” For SaaS businesses, where business is fast-paced and always scaling, there’s plenty of data to keep track of.
In my last blog post, I shared a SaaS metrics cheat sheet. I gave a quick rundown of 10 SaaS metrics and the formula to calculate each. But if formulas and math makes you run the other way, I noted that it’s easy to monitor each on a dashboard.
So, now we’re here today with a guide on how to design the ultimate SaaS metrics dashboard.
You might be asking yourself, “Why do I need to design a SaaS metrics dashboard?”
Dashboards display your data in real-time using data visualizations. Ultimately, dashboards are a communications tool. For SaaS businesses, where business is fast-paced and always scaling, there’s plenty of data to keep track of.
Dashboard design is a process and how you approach it includes everything from the metrics you track, to the audience reading your dashboard, to the visualizations you choose. In today’s article, I’m going to share 5 steps to designing a SaaS metrics dashboard. This should give you everything you need to get started!
Here are the 5 steps to design a SaaS dashboard:
- Define your goals and KPIs
- Identify the metrics you will track
- Pick a dashboard software
- Design your dashboard
- Get insights
Step 1: Define your goals and KPIs
The full form of KPI is key performance indicator. KPIs are measurable values that help determine how effective you are at achieving key business objectives.
Let’s say you’re a SaaS marketer, and you need to acquire 100 qualified users this month. Define your KPI by asking yourself these questions:
| Question | Answer |
|---|---|
| What is your desired outcome? | Acquire 100 qualified users this month. |
| Why does this matter? | More product qualified users = more potential revenue. |
| How are you going to measure your progress? | By tracking Product Qualified Leads |
| Who is responsible for the business outcome? | Marketing |
| How will you know you’ve achieved your outcome? | 100 users will meet the PQL threshold |
| How often will you review progress towards the outcome? | Daily |
You’ve defined your KPI—including what it is and the steps you are going to take to get there. Now, let’s identify which metrics you should track so you can measure your progress against your outcomes.
Step 2: Identify the metrics you’re going to track
One of the questions that you have to ask yourself when defining your KPIs is: How am I going to measure my progress?
If we use the 100 qualified users KPI as an example, it makes sense to track your progress by the number of users who meet your PQL threshold. It seems pretty simple, right? A simple numeric value to keep you on track.
But when you acquire qualified users, there are additional metrics to look at. You want to tell the entire story:
- What happens after you acquire a user? Do they become paying customers?
- What happens before they’re qualified? You’ll want to track your MQLs to compare to your PQLs to ensure you’re attracting your target audience.
See what I mean? Metrics help to tell the full story, so it’s important to consider which metrics you want to track on your dashboard.
If qualified users is your KPI, in addition to Product Qualified Leads, you could track:
- Marketing Qualified Leads: How many people is marketing getting in the door that have potential to become PQLs?
- Sales Qualified Leads: How many leads meet the predefined threshold with potential to become paying customers?
- Monthly Recurring Revenue: Is your MRR increasing? Are your qualified users becoming paying customers?
- Customer Retention Rate: If your PQLs become paying customers, are they sticking around? If you notice a drop in your retention rate, it’s best to investigate so you keep your hard-earned users and ensure they see the value in your offering.
Can you see how each metric works together to weave the full story? The end goal with qualified users is that they become paying customers, so when you put all of the metrics on a dashboard, you can see their journey from start to finish.
Need inspiration? MetricHQ has over 300+ expert-contributed metrics to explore.
Step 3: Pick your dashboard software
The software you pick will depend on your business needs. PowerMetrics is a great option for building a SaaS metrics dashboard.
PowerMetrics offers instant metrics, which means you can add the top SaaS metrics and connect to a data service with only a few clicks. You can get started here.
Here’s an example of a dashboard that you can build in PowerMetrics:
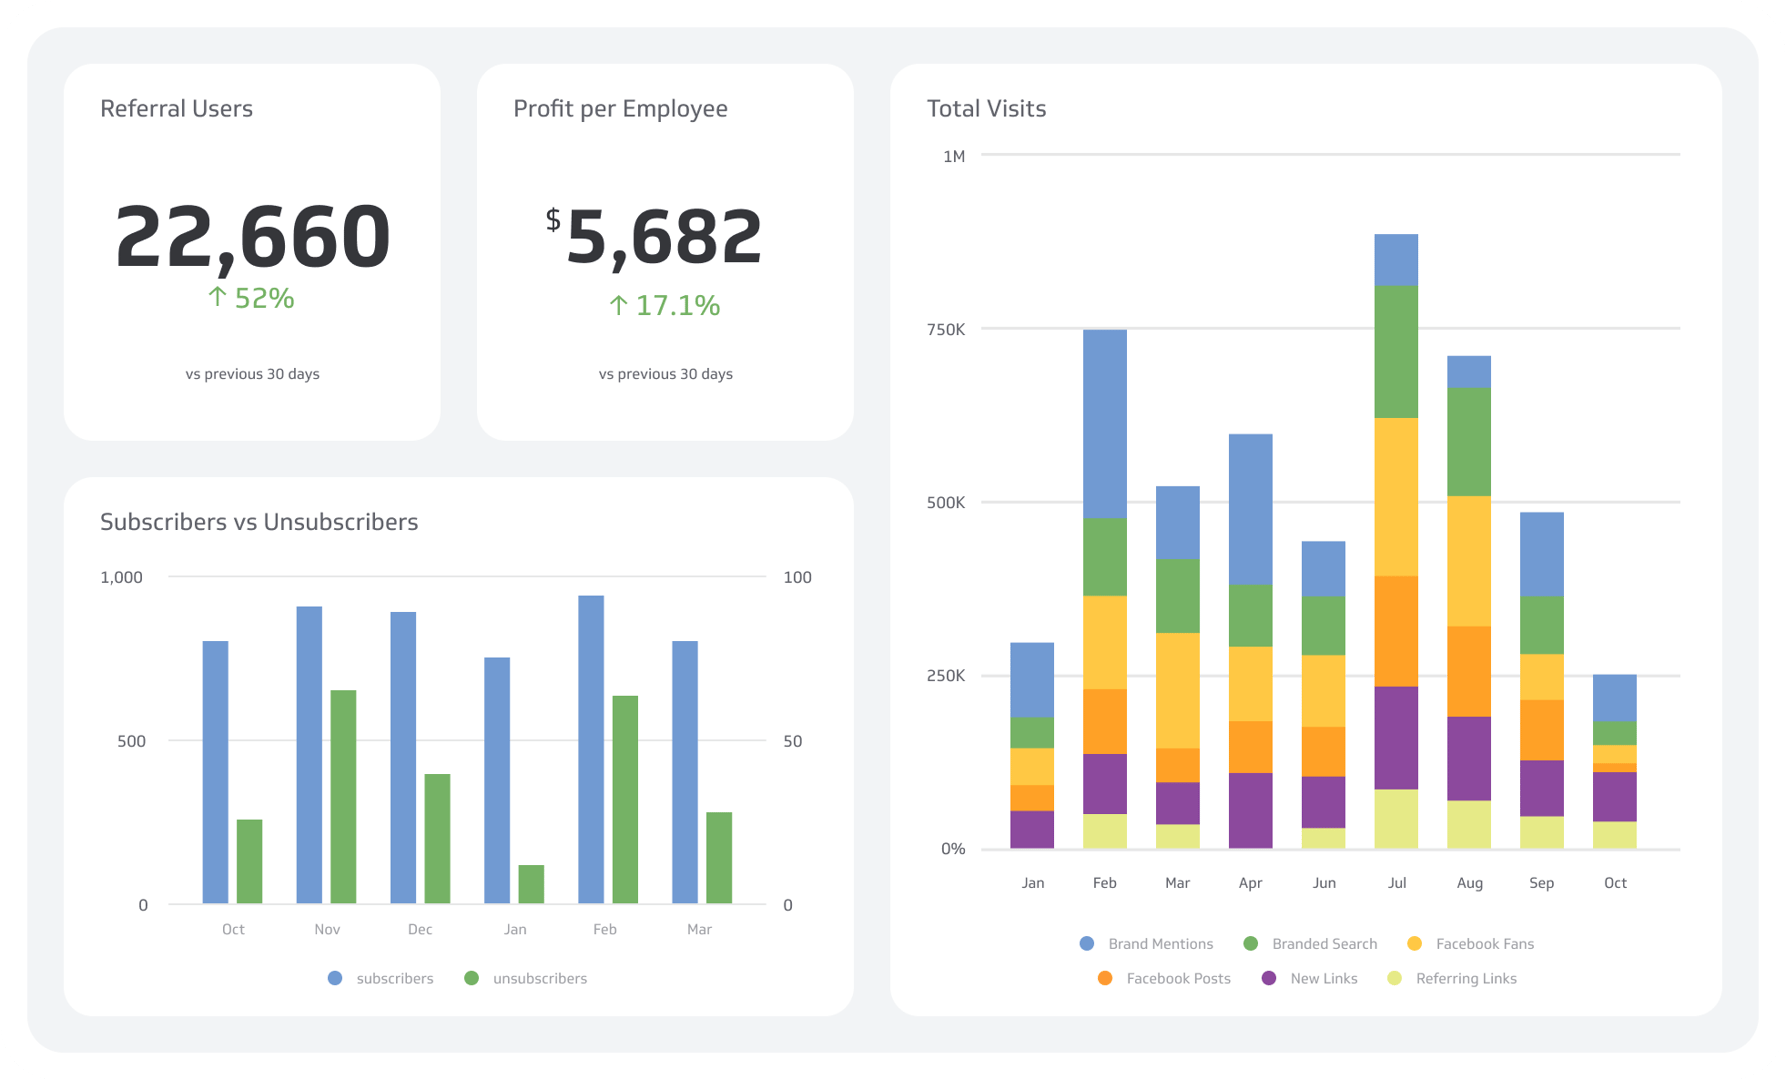.png)
Step 4: Design your dashboard
Now you’ve got your KPIs, your metrics, and your dashboard software, it’s time to start designing your dashboard.
Dashboard design has a few golden rules to keep in mind before we get into the nitty-gritty.
- Always define your audience (Who is the dashboard for? Who’s going to be referencing it?) It’s always key to remember that the relationship you have with the data being presented will be different from the relationship your dashboard audience has.
- Context is critical! Building on the point above, everyone won’t be looking at the dashboard with the same context, so include additional information or context setting where necessary.
These are my top tips for designing a SaaS metrics dashboard:
- Design different dashboards for different business needs
- Add comparison values to your metrics so you can track your progress at-a-glance
- Consider your dashboard layout -- most people read left to right, so ensure your most important metrics are in the upper left quadrant of your dashboard to match the way we intuitively read information.
- Pick the right visualizations for your metrics so they are easy to understand
- Don’t make your readers “do the math” -- the information you provide shouldn’t have anyone doing calculations on the back of a napkin. Present the relevant information that is easily readable.
Step 5: Get those insights!
You’ve put time and effort into building a SaaS metrics dashboard, and now it's time to reap the benefits.
Identify trends, track your data history, use your dashboard as a single source of truth for your business decision-making.
Related Articles

5 tips to understand (and organize) your restaurant data
By Saleem Khatri — June 9th, 2026
6 dashboards I use daily to run my SaaS company
By Allan Wille, Co-Founder — April 10th, 2026
Business Metrics vs. KPIs: What’s the Difference?
By Jonathan Taylor — March 13th, 2026
