
Summary - Ditch tedious KPI reports! This guide shows 7 ways small and mid-sized business leaders can present KPIs using a complete dashboard solution like Klips. From automated email reports and PDFs to interactive dashboards and mobile access, learn how to turn raw data into actionable insights that your management team will love and actually use—making data monitoring a quick, everyday habit.
Everyone procrastinates on KPI reporting—why? Because it’s time-consuming and tedious, and the final product is often uninspiring. But KPIs are important! While reporting is absolutely necessary for data-driven businesses, there’s a huge difference between raw data and insights. Putting together a good business KPI report that your management team will not only love but actually look at doesn’t take as long as you think.
What should be included in a KPI report?
How you present information, reports, and opinions directly determines how they are received. A good KPI report should be accessible, easy to update, and quickly transformable. A great report has these qualities alongside a clear objective. Your objective should be supported by key insights that show exactly how you are performing. Your KPI dashboard should effectively communicate your objective and insights, getting everyone on the same page. This is why knowing how to define your organization's KPIs is so important.
How do I create a KPI report?
When you track your KPIs on a dashboard in Klips (our Dashboard Software), reporting becomes a quick, everyday task that will improve your team’s results and internal communication. Klips automates data retrieval and offers limitless presentation and distribution options, all with the power and familiarity of spreadsheets.
How do I present a KPI report?
Here are some of the best ways to present KPIs to managers and executives using a complete dashboard solution like Klips:
- Share an email report with KPIs
- Distribute a PDF that shows KPIs
- Present KPIs using a slide presentation
- Display KPIs on a TV dashboard
- Visualize KPIs using a KPI dashboard
- Share KPIs using mobile reports or dashboards
- Build your own KPIs using dashboard software

1. Presenting KPIs in an email report
Email reporting makes a dashboard (or report) widely accessible across devices like phones, tablets, and desktops.
Email your KPI report in mobile-friendly formats such as PDFs or embedded images. A key benefit of email reporting is that users don’t need to download an external application to access KPI data.
Automatically email a KPI presentation
Set up scheduled email reporting, and your team and management will automatically have your KPI report in their inboxes. Email is the most common report communication channel. Connecting your dashboard to email easily decreases the amount of time you spend creating the report while increasing the amount of time management spends reviewing the update.
Email a KPI report in an instant
Email reporting is great for one-time use and on-demand KPI reporting. When your manager asks, “How’s our current marketing campaign performance?” or “What are our lead numbers this month compared to last?” Now you have a KPI report at your fingertips to share with your leadership team. Performance insights are extremely valuable and often require immediate attention. Klips helps you quickly and efficiently share these insights.
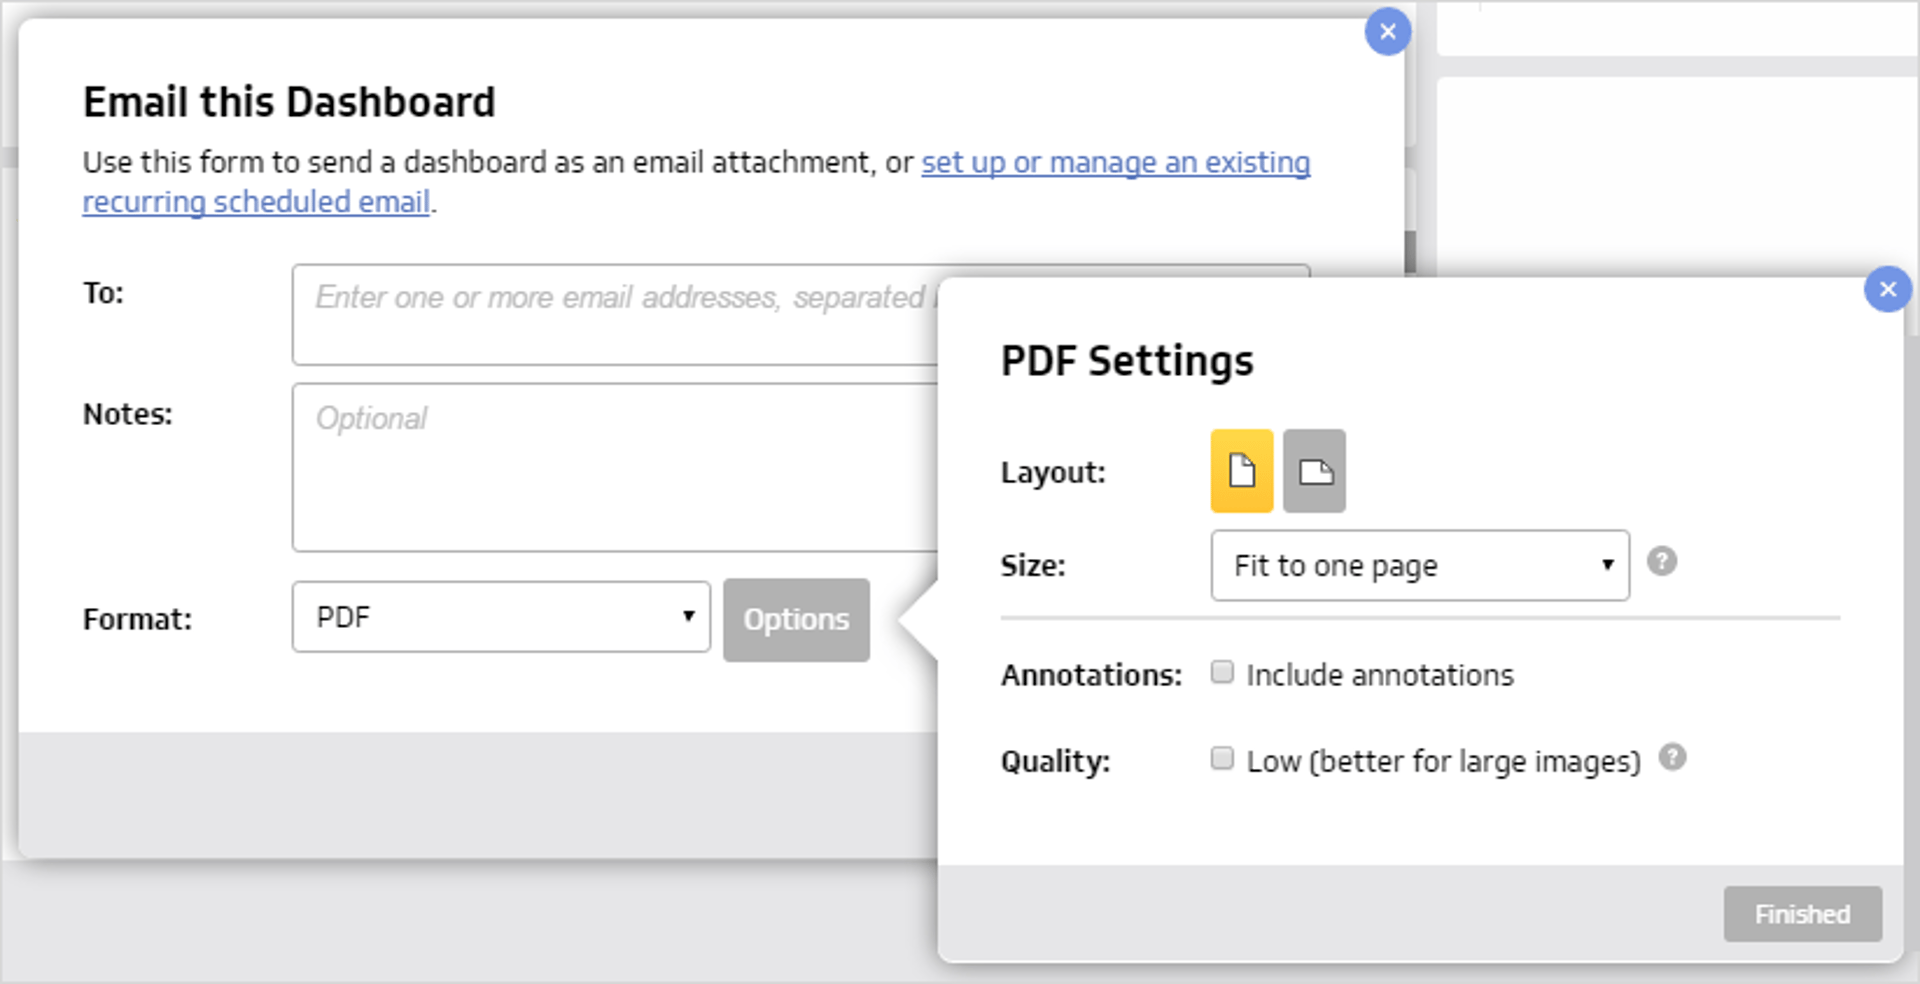
2. Turn your KPI presentation into a PDF report
Reports because they maintain a clean and organized format for web, email, and print. Klips lets you download your dashboard as a PDF, showing your KPIs based on how they appear on the dashboard.
You have the ability to adjust the layout, size, and style for each report. Klips takes the pain out of manual reporting where you would have to extract the data and create new visualizations. Also, consider adding custom branding options to provide additional context and a professional look.

3. Create a KPI report slide presentation
A KPI presentation or slide deck encourages conversation. Turn your PowerPoint or Google Slides into a KPI presentation by inserting your dashboard as an image or embedding it. A KPI presentation in PowerPoint is a visual representation of your KPI story. It should include minimal text and focus on showing your progress with visualizations and data.
How do you show KPIs in a presentation?
When you present KPIs to a group where time is limited, strong visuals keep everyone engaged and on topic. KPIs work together and should be discussed in relation to one another. Best practice suggests no more than two images per slide if you are including text, and no more than four images if there is no text. If your KPI presentation has a slide for each KPI, be sure to note its relation to others and the overall business objectives.
Discuss KPIs with managers with a business dashboard slide presentation
Incorporating real-time data from KPIs into presentations adds an important layer of context when discussing your business. Executives get inspired when seeing a concise version of their data, discovering that they can use it in key decision-making. After your dashboard-driven KPI presentation, they may request more visualizations. By sharing the live dashboard, you can keep the conversation going and prevent your KPI presentation from being forgotten.
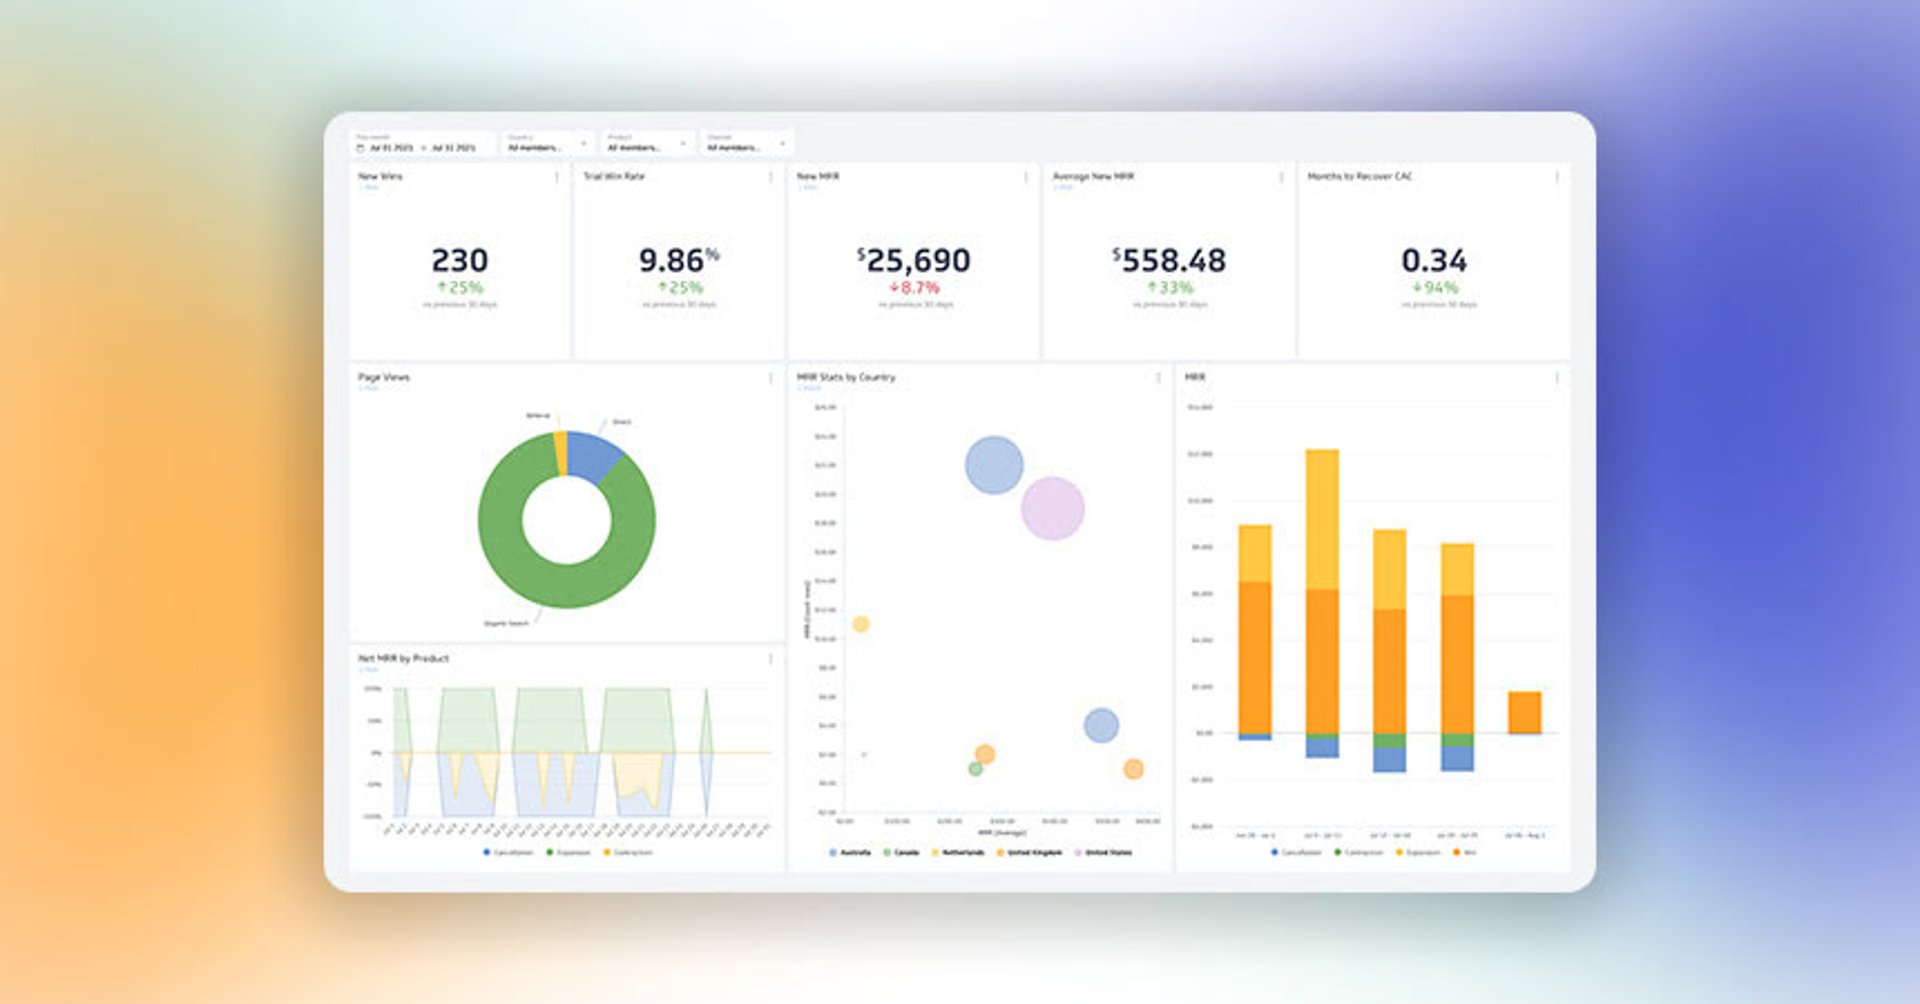
4. Present your KPIs on a KPI dashboard
What is a Dashboard? A KPI dashboard displays your KPIs in dynamic, interactive visualizations like charts and graphs. When you measure your KPIs on a Klips dashboard, it ensures your data is up-to-date, so you're always using the latest insights to evaluate progress.
There is no set time of week, month, or year to make a KPI report—the best monitoring is done every day. Klips dashboards make reporting an easy, daily habit so that you and your team can be transparent and data-driven.

5. Combine live links and wallboards for an easy everyday KPI report
Publicly sharable links are ideal for users who: use wallboards to display one dashboard, want to share a dashboard with a broader group within their organization, or share with external users. Klips users can publish a dashboard (with or without a password) as a shareable link.
Public links for your KPI presentation
Public links give everyone access to the data in an easy way, anytime. They allow multiple people to view your KPI dashboard. For Pro-Services firms (like consultants) who track KPIs for clients, this is especially useful as it streamlines communication.
Foster teamwork with your KPI presentation on a wallboard
Public links mirror KPIs from your dashboard, so they are continuously updated (real-time). Allocating time to create dashboards with the KPIs your executives request will simplify the reporting process and create the habit of monitoring these metrics at all times. Wallboards foster teamwork in the workplace. Getting everyone in the organization to talk about performance and prompting questions from other departments is the goal.

6. Grant direct KPI dashboard access
Make your KPI dashboards accessible to everyone on your team. The benefit of direct access is that you can set up role-specific dashboards.
Granting your team members, especially management, with access to your dashboards is an accessible way to present KPIs. Individuals can access KPI report data at all times without going through a long line of communication. Direct dashboard access improves communication and demonstrates the value of your team’s efforts to management, as well as key areas for improvement.

7. Take your data everywhere with a mobile KPI presentation
C-suite executives are often on the road and require quick access to the status of their company’s performance. Presenting KPIs for management to access on their smartphone makes it simple for them to quickly access and understand data from anywhere. When everyone in an organization is given access to dashboards, data can be integrated into day-to-day activities.
Mobile reporting becomes especially important as remote work becomes increasingly common. You may not always be on your laptop, but the vast majority of people never forget their phone.
Add real data to every conversation with your mobile KPI report
With mobile reporting, KPI data becomes a natural and essential element of any business discussion. How many times have you been in a casual conversation with a colleague about work where you say, “I can show you when I get to my computer”? A mobile KPI report brings context by incorporating KPIs into the conversation, leading to a follow-up conversation or even immediate action.
Also, see:
Related Articles

Business Metrics vs. KPIs: What’s the Difference?
By Jonathan Taylor — March 13th, 2026
The 5 most important SEO KPIs for digital marketing success
By Sanket Patel — February 24th, 2026
What is a KPI, metric, or measure?
By Jonathan Taylor — January 20th, 2026