Salesforce
Salesforce is a world-class customer relationship management platform, helping you grow your business with everything from lead management to website analytics.
Track all your Salesforce KPIs in one place
Sign up for free and start making decisions for your business with confidence.


Custom Salesforce dashboards
Your Salesforce instance is built off of custom reports and fields. Only you know how your CRM is set up, and only you can know what metrics you really need. Use Klipfolio to visualize and monitor your sales data in a custom sales dashboard.
Salesforce and Salesforce Sandbox connectors
Get at your Salesforce data or use a Salesforce Sandbox account to start building world-class dashboards.
Beautiful TV dashboards
Democratize your Salesforce data and display it where the entire sales organization can see it.
Create custom SFDC visualizations
Use the Klip Editor to design and build custom visualizations using your Salesforce data.
Build a Sales Leaderboard with Salesforce data
A bit of friendly competition goes a long way. Motivate your sales team and keep track of key data points with the help of this tutorial.
Dashboard links
Get your Salesforce dashboards out to a wide audience using published dashboards links. Check out live examples such as the Monthly Sales Dashboard or the Sales Leaderboard.
Slack and email snapshots
Get your Salesforce data out into the wild using recurring email snapshot or send dashboards via Slack.
Use pre-built Salesforce metrics
Assemble a Salesforce dashboard by selecting pre-built metrics from the Klip Gallery.
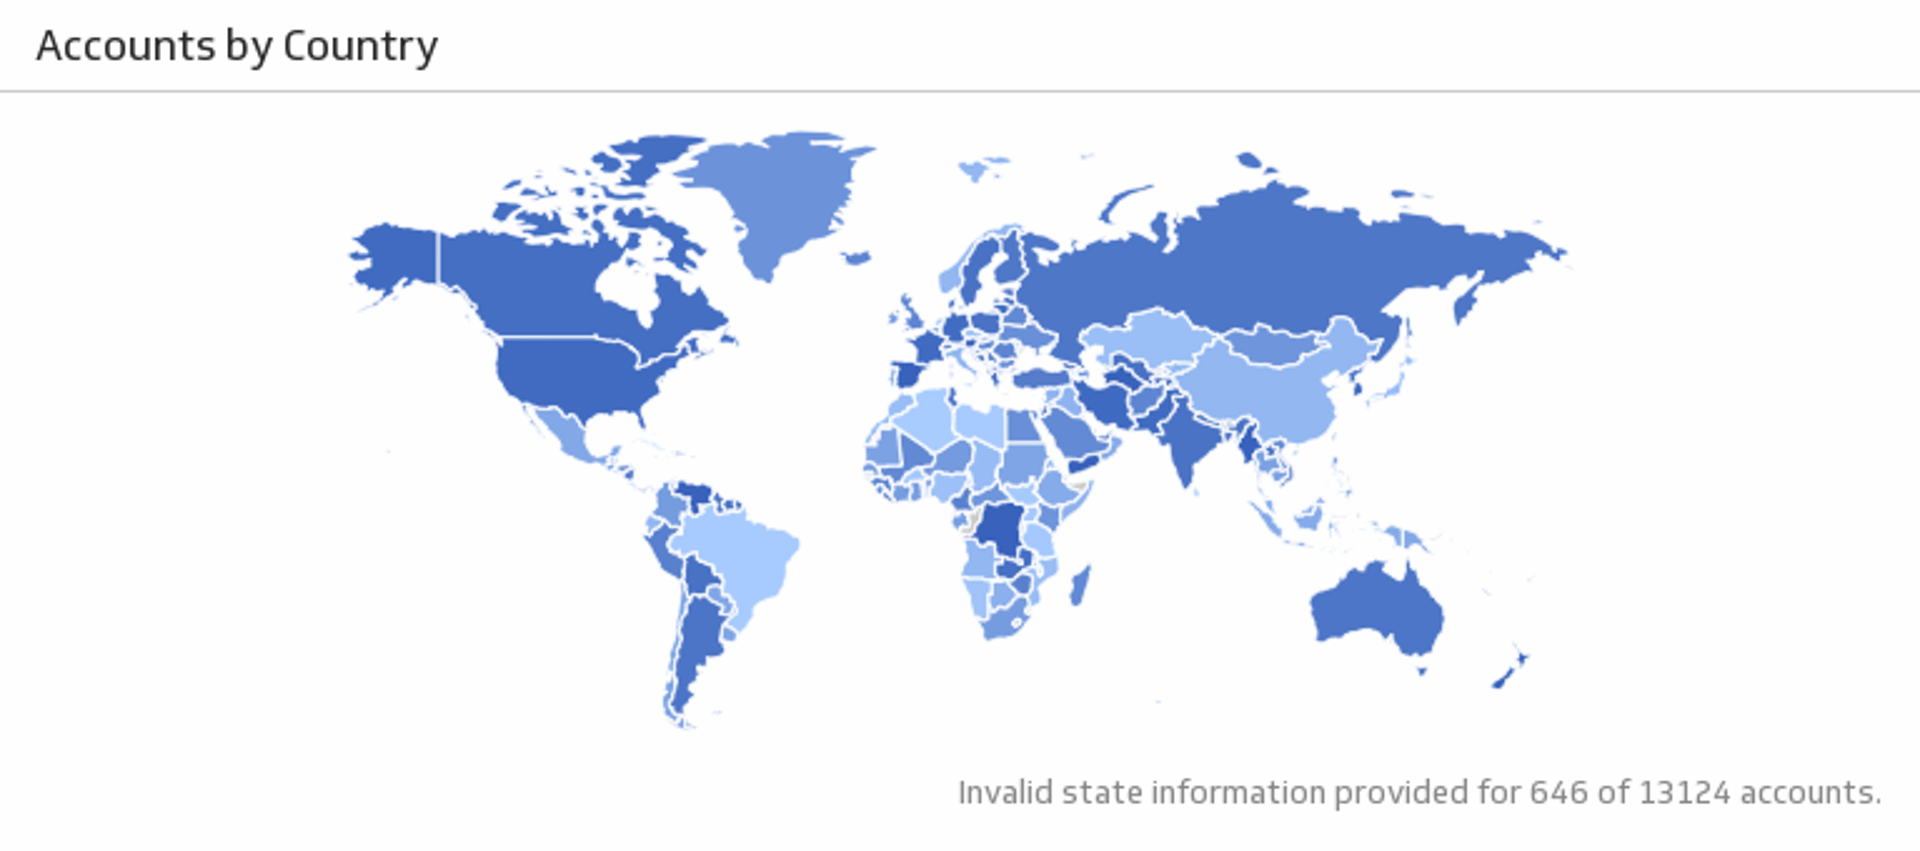
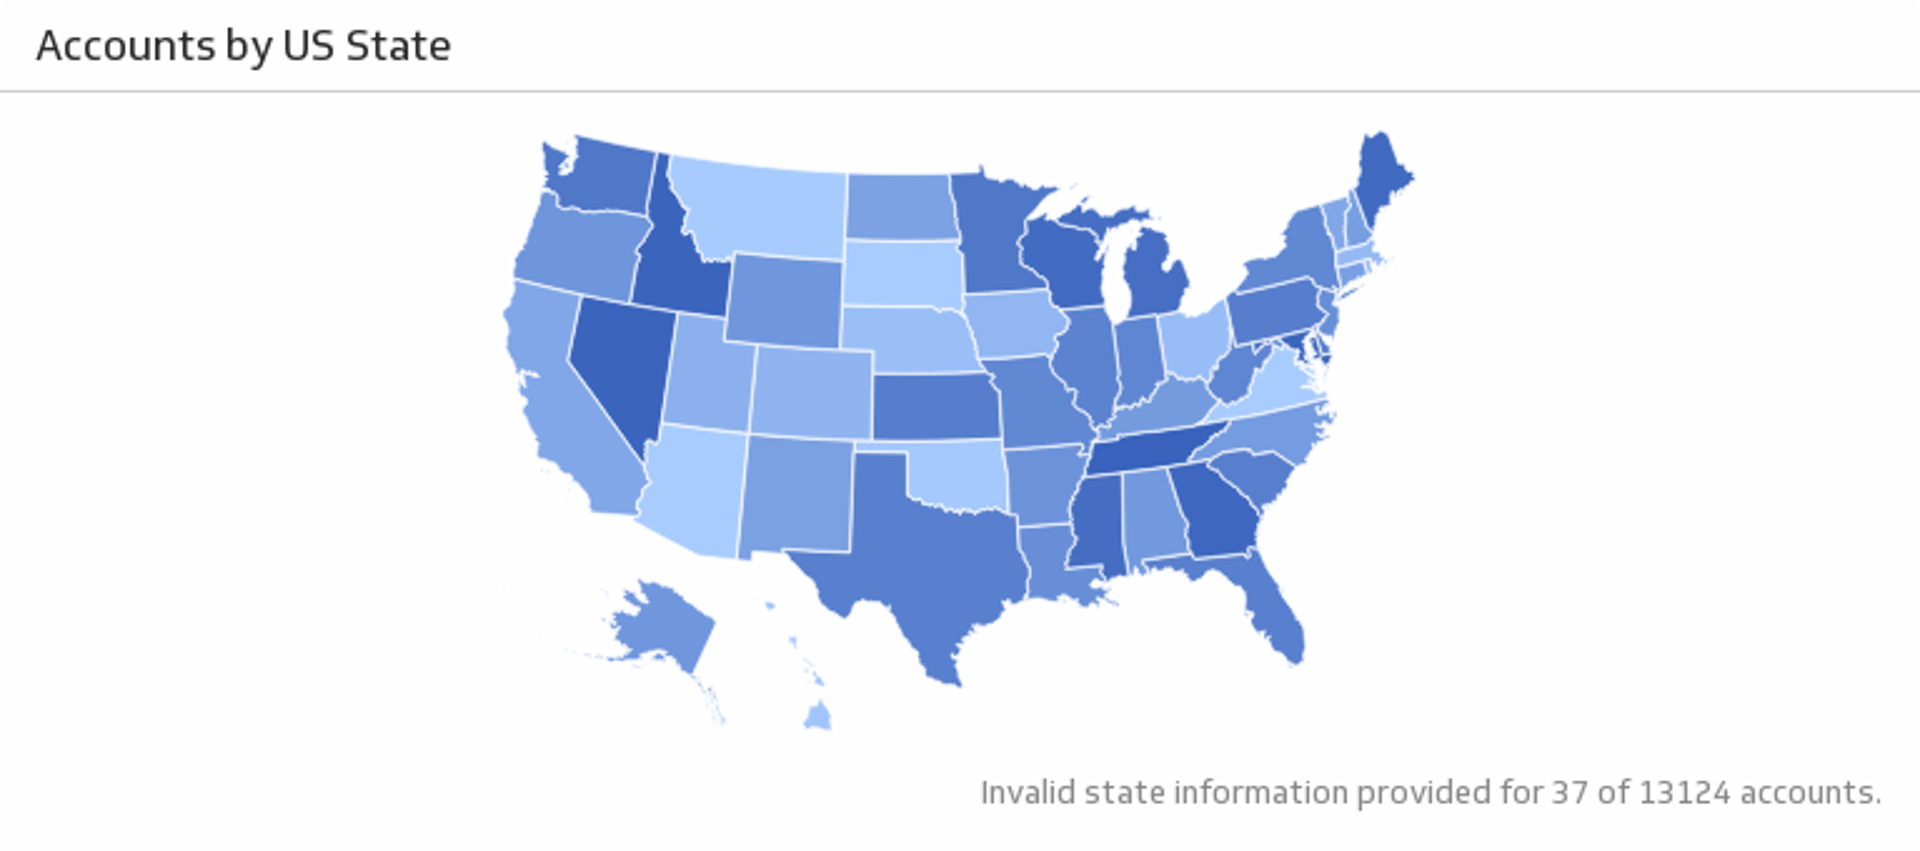
Accounts by U.S. State
See the location of your U.S. Salesforce accounts.
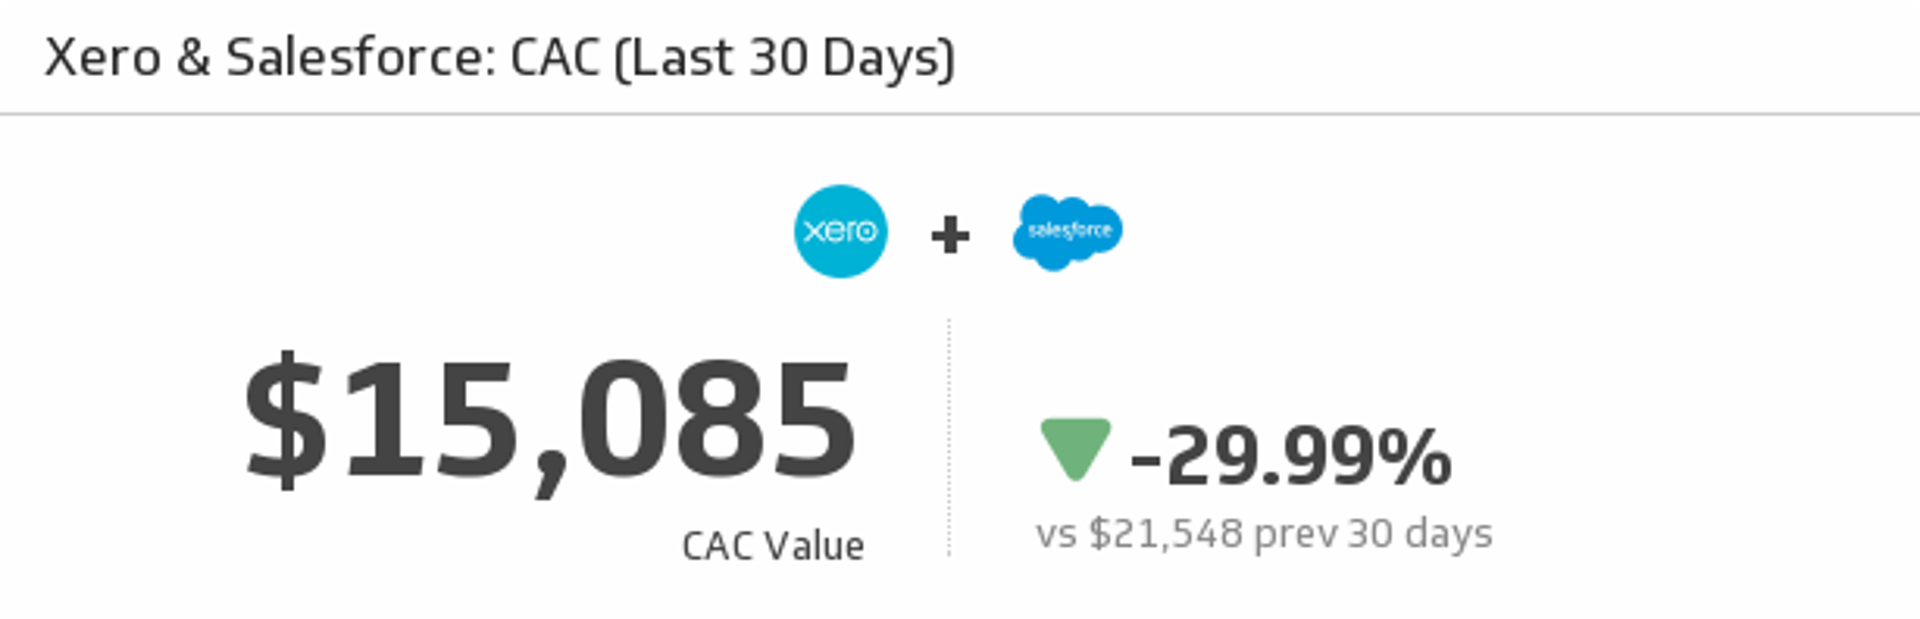
CAC (Last 30 Days)
Let this Klip address the most important question on your marketing team - what is our cost to acquire a customer (CAC)? This Klip uses your monthly Xero and Salesforce data to answer that very question.
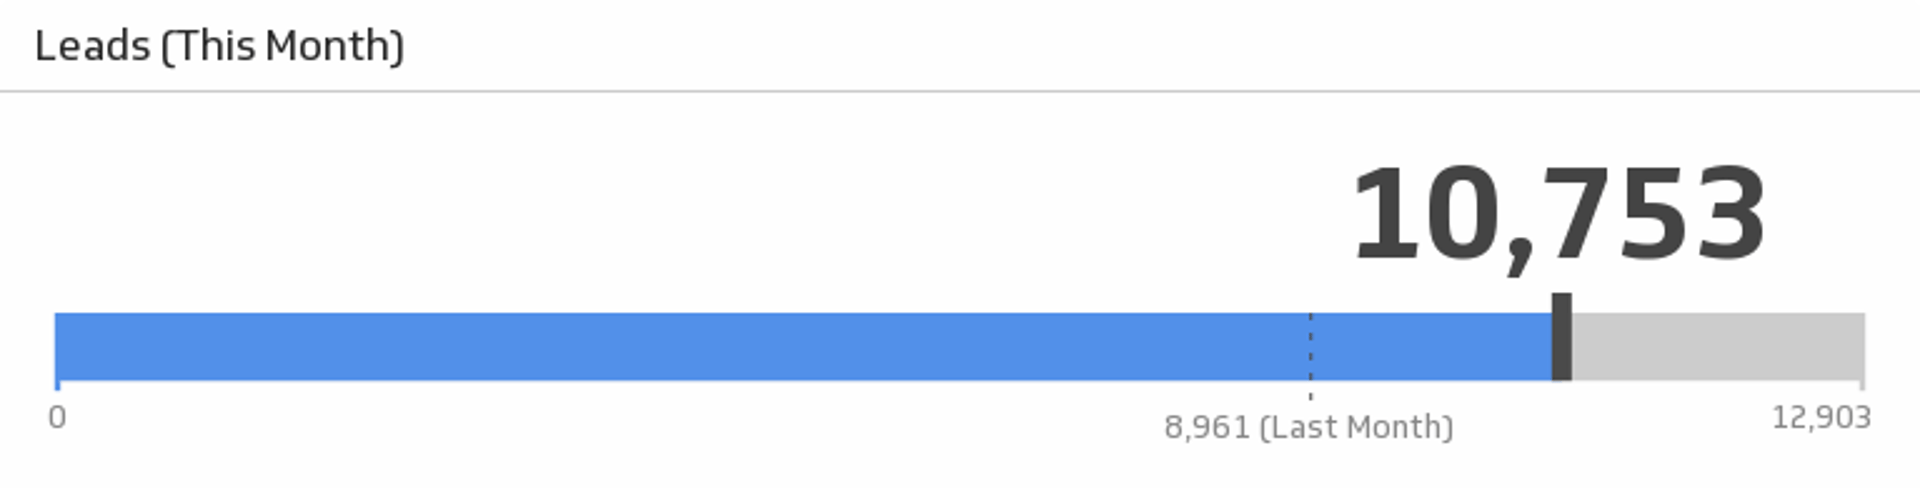
Leads This Month
Monitor your leads this month and see how the number compares to the previous month.
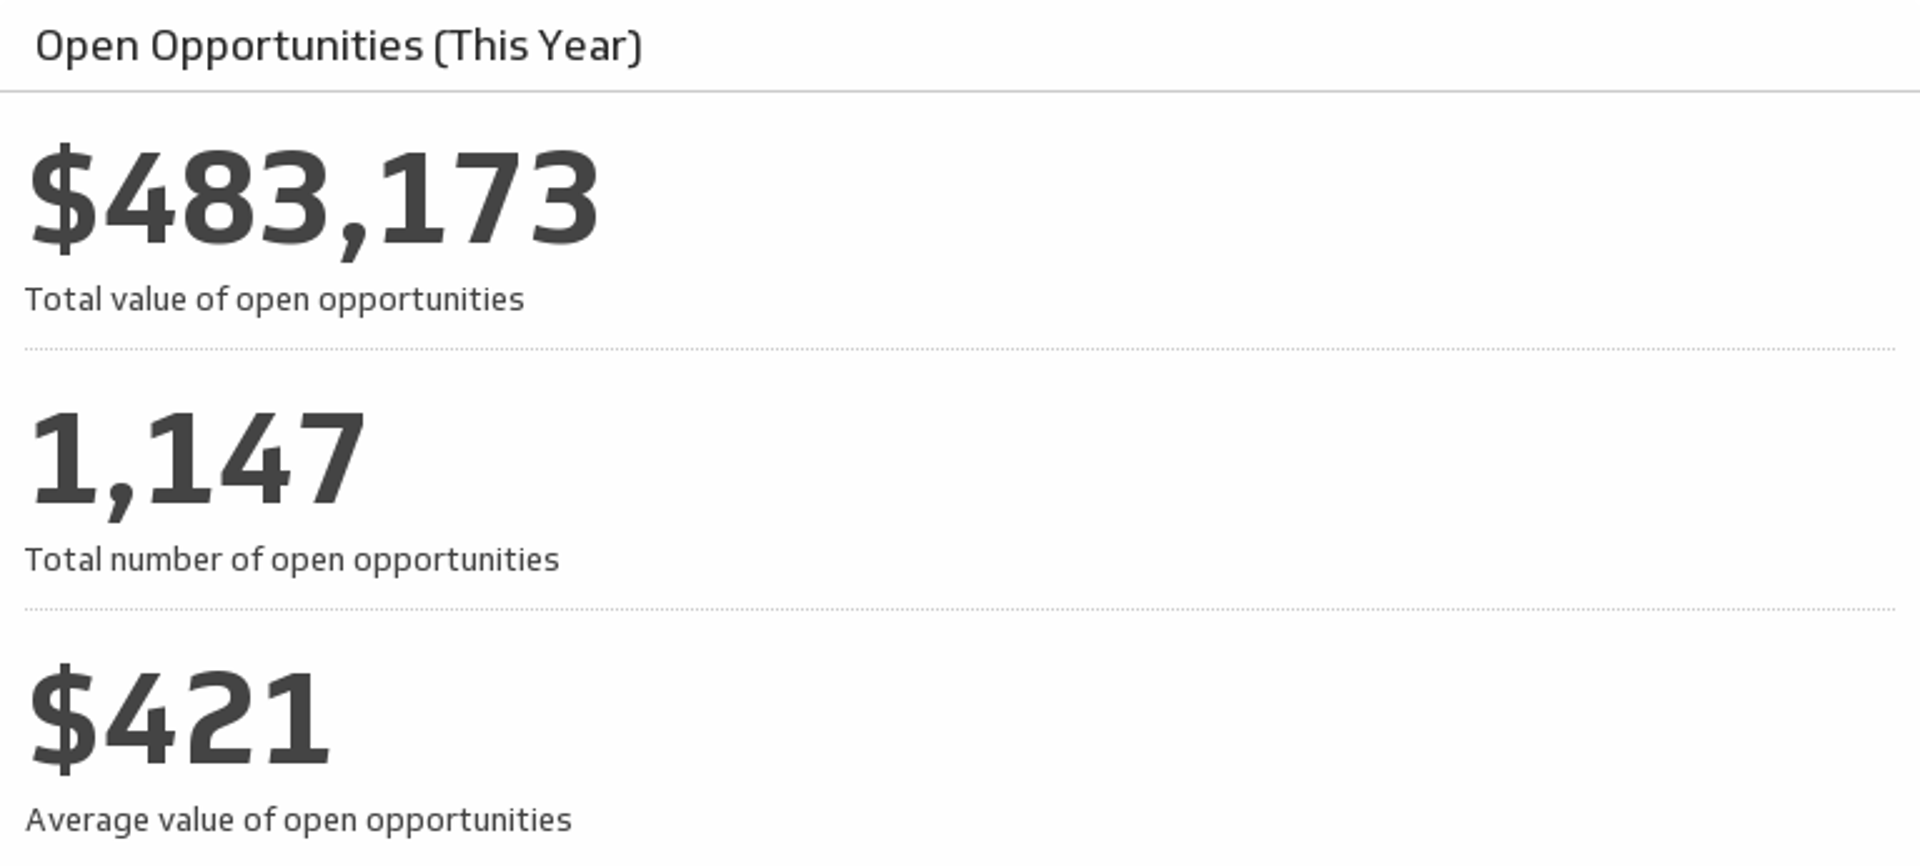
Open Opportunites (This Year)
Track your key metrics on open opportunities and always know what your sales potential is.
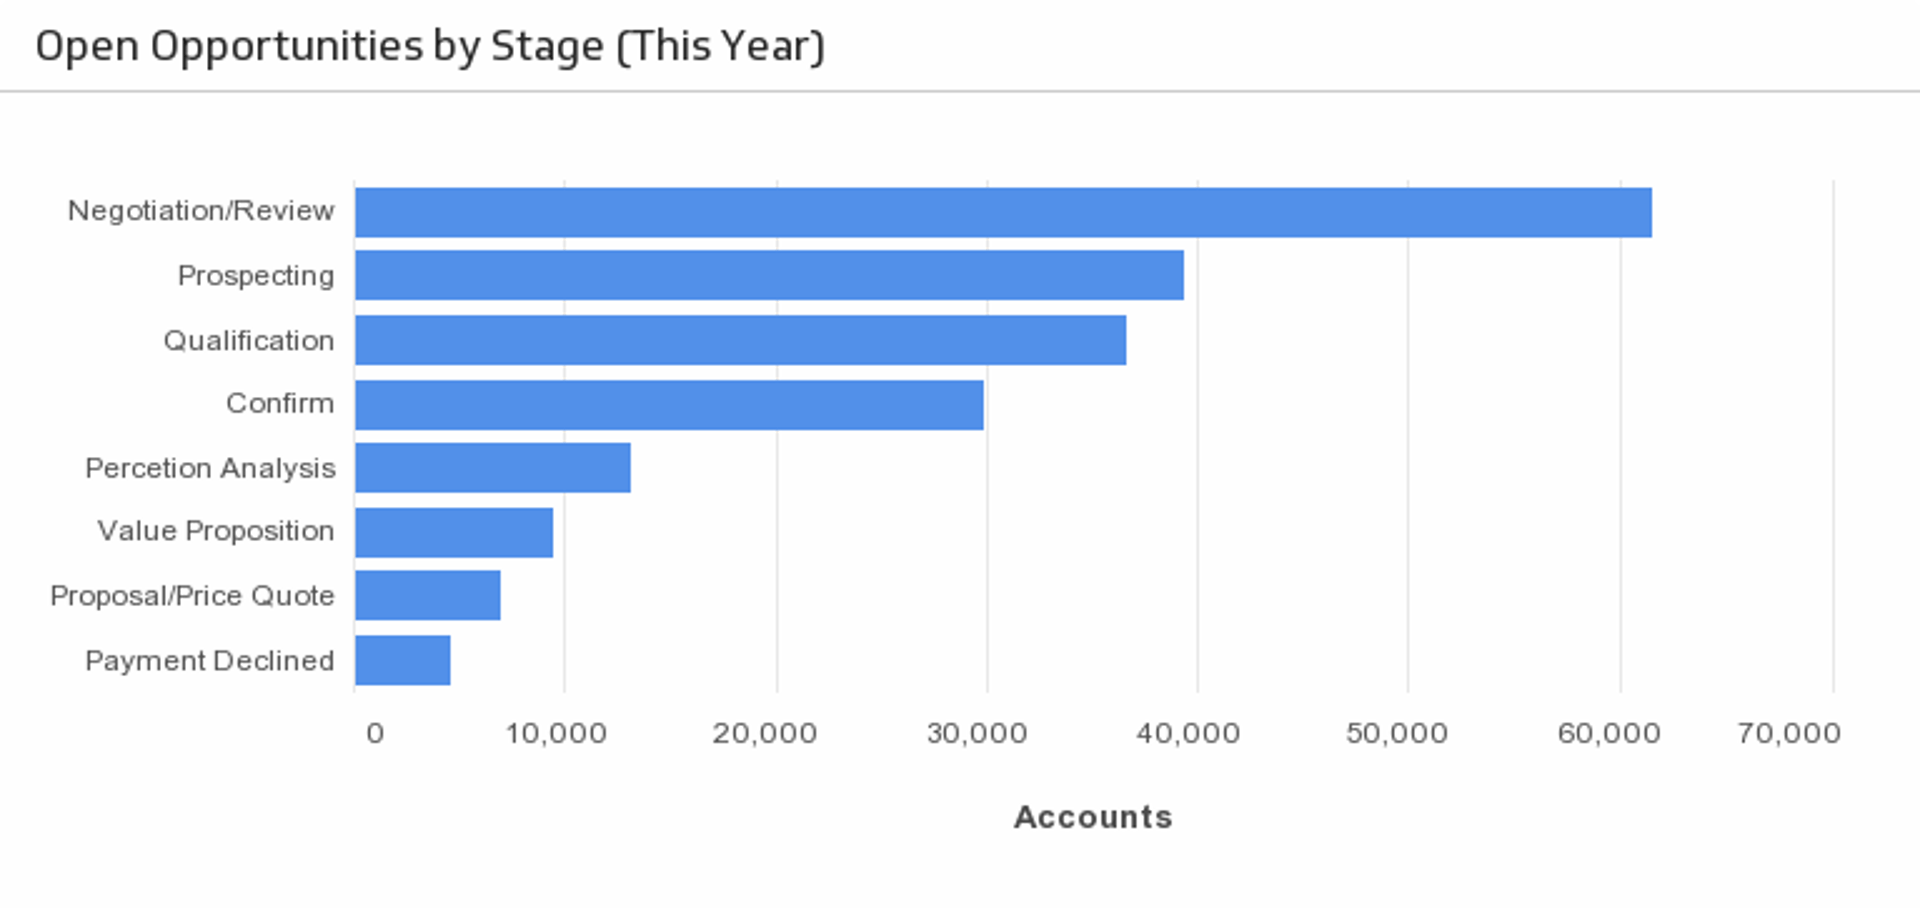
Open Opportunities by Stage
Understand the stage at which your opportunities are in the sales cycle.
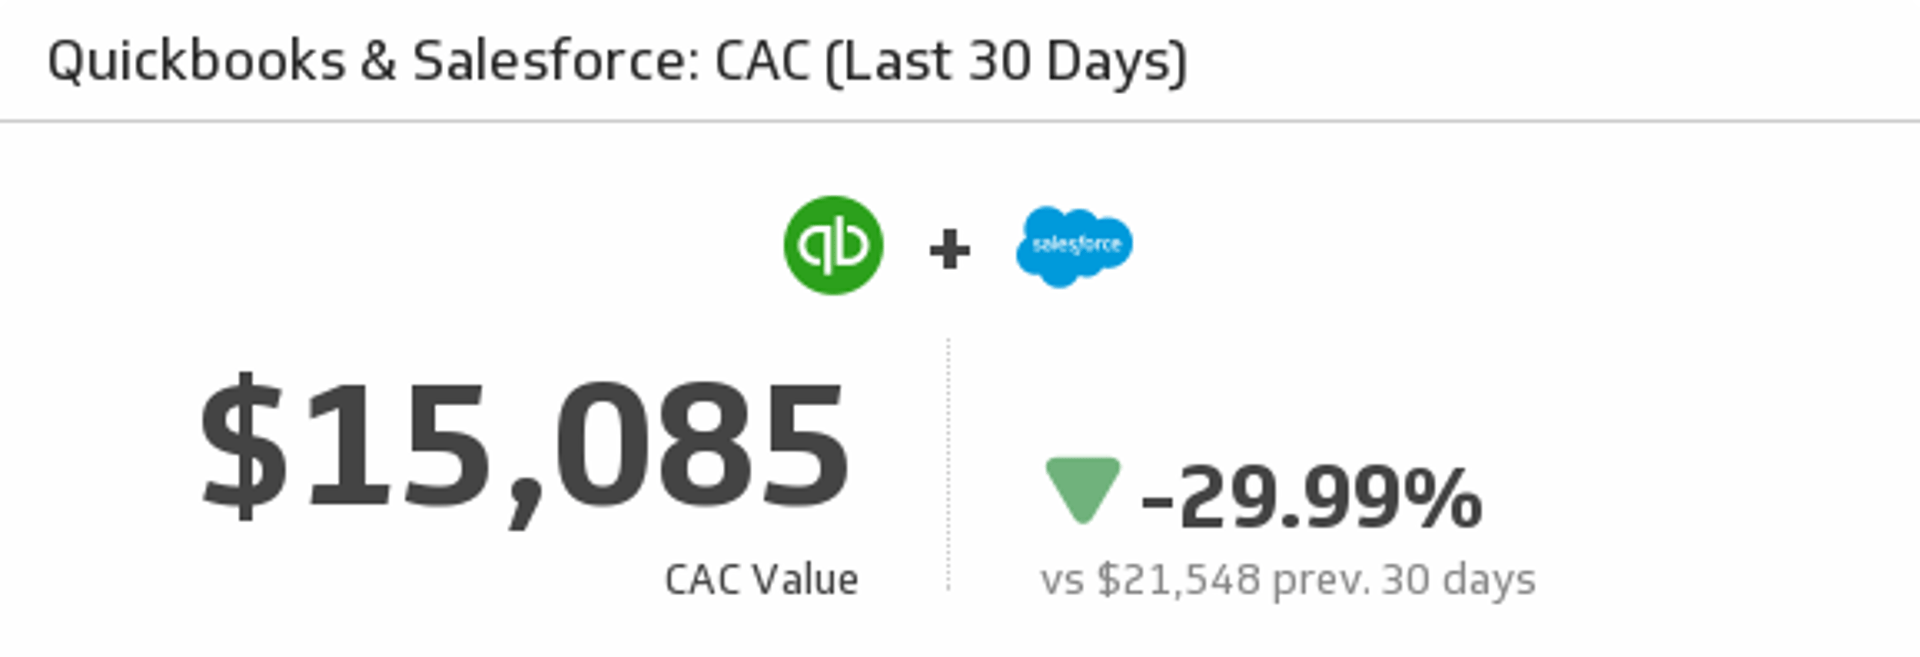
QuickBooks and Salesforce CAC (Last 30 Days)
Mash up your QuickBooks and Salesforce data to measure your Customer Acquisition Cost over the last 30 days.
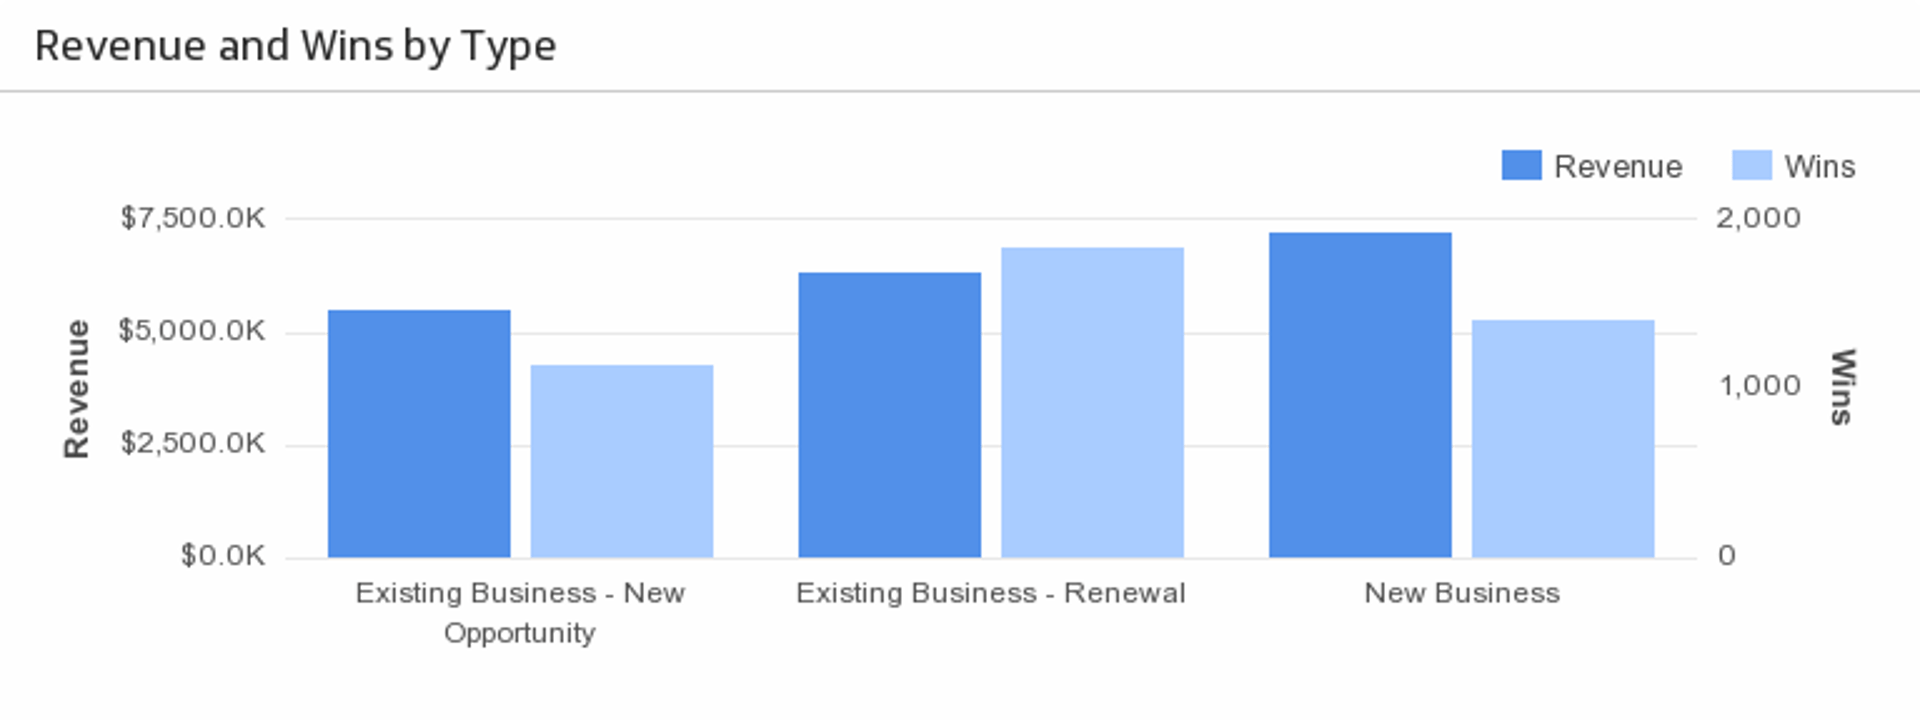
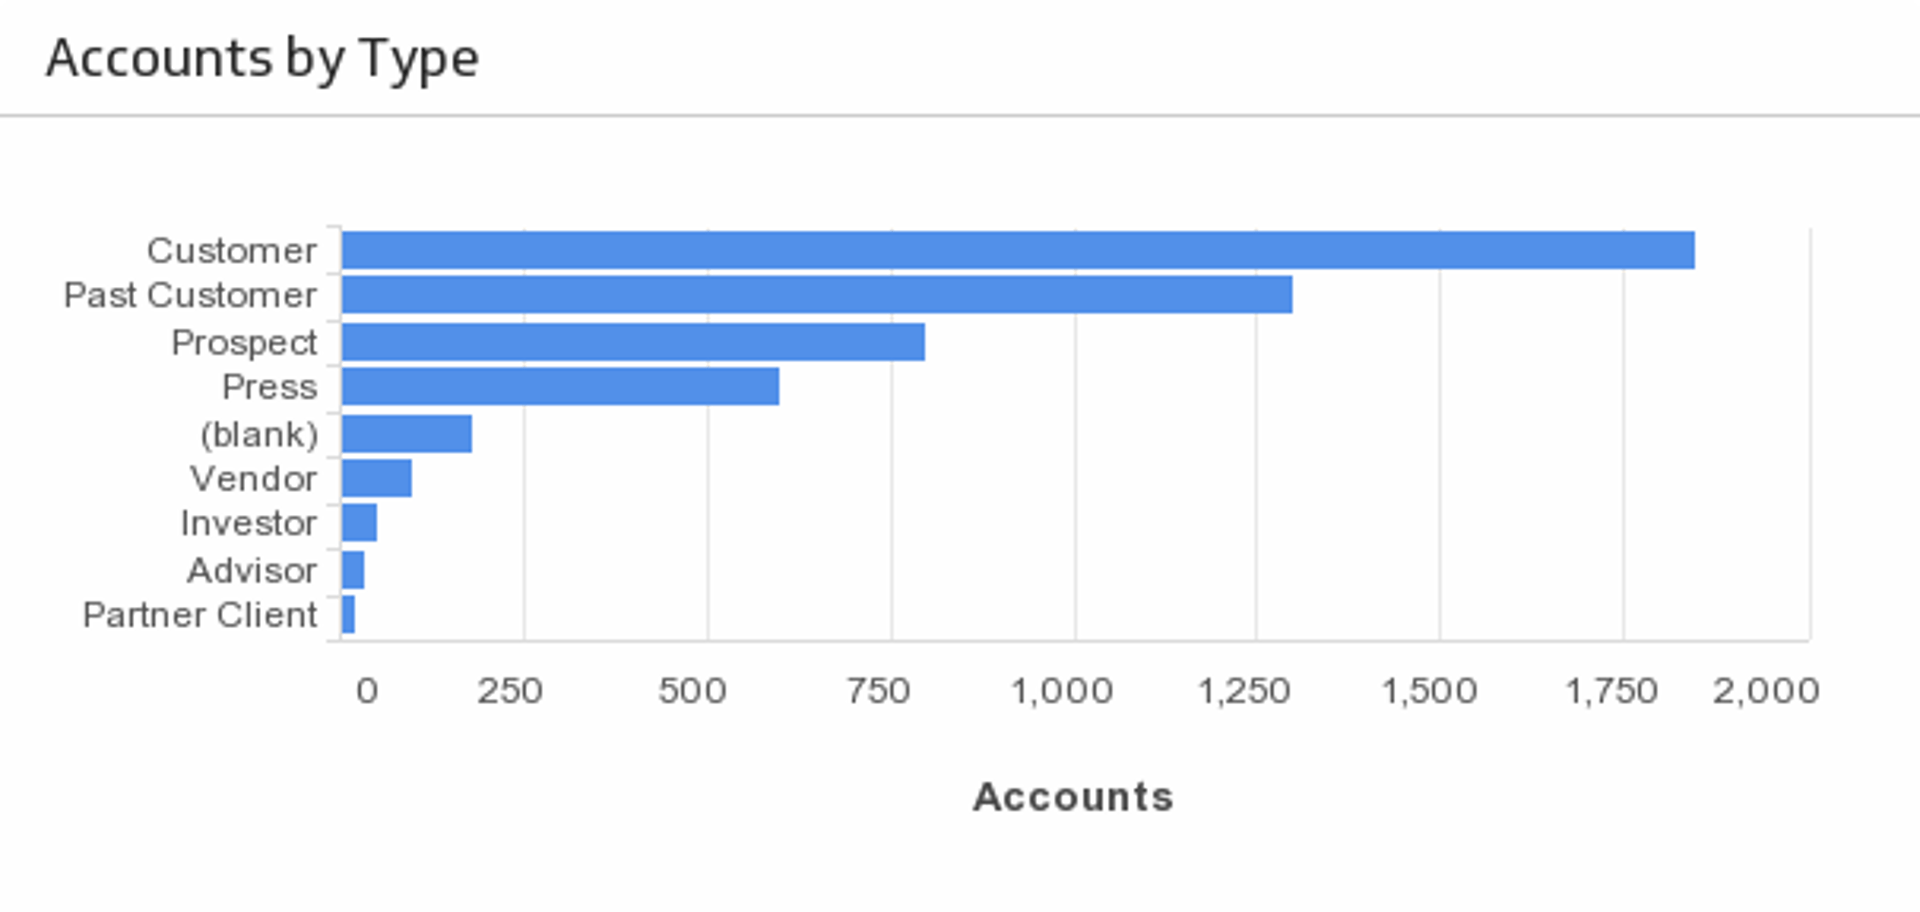
Revenue and Wins by Type
Understand what types of opportunities are bringing in the most revenue.
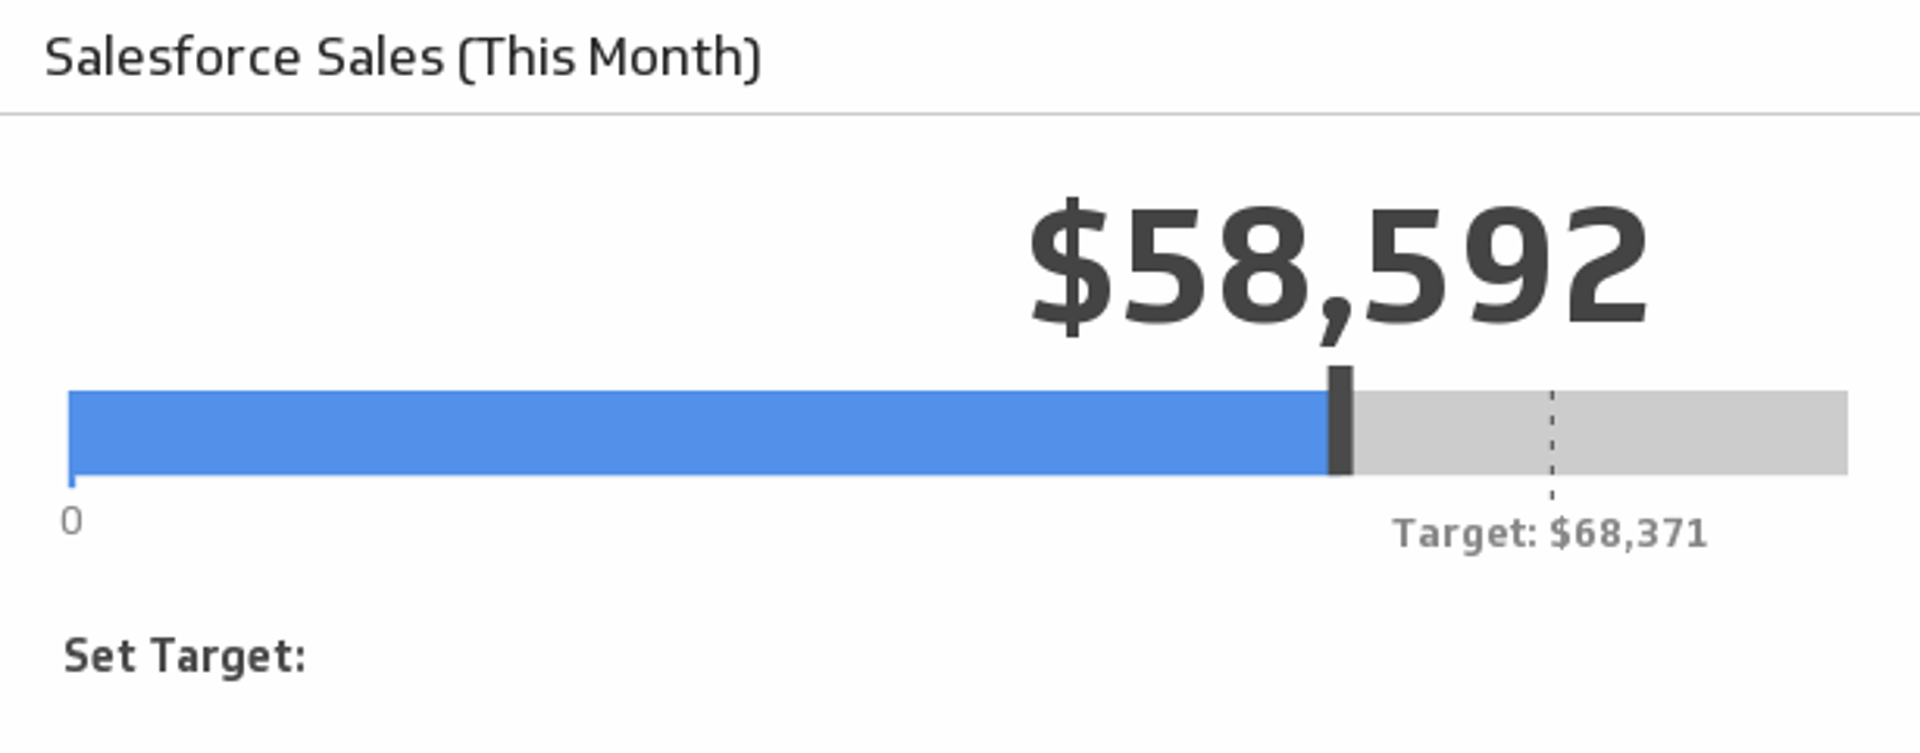
Sales This Month
Monitor your sales this month and compare to the average of the last three months.
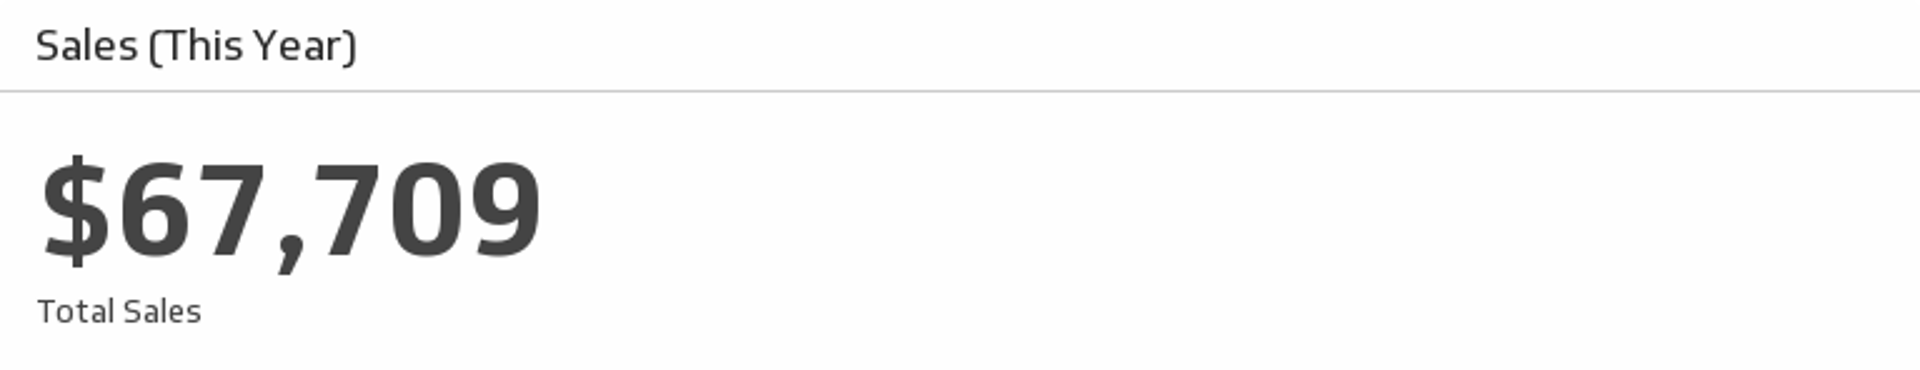
Sales This Year
Monitor the total value of your sales since January 1st.


Use the Connector Gallery to create a custom Salesforce dashboard
With our Connector Gallery, you can create custom API queries to pull in data from your Salesforce account. Building custom queries allows you to specify the metrics and time periods that you want to track.
You can use custom queries to build out visualizations in Klipfolio. You can also combine your Salesforce data with other relevant data to create your custom dashboard.
Learn more about working with the Salesforce API and how you can start building your own Salesforce queries in Klipfolio.
