

Summary - There's more to a KPI report than meets the eye. Here's how to compile the best business KPIs and present them in a KPI report.
KPIs are the rallying call of the data-driven. Defining your KPIs is the first step on the journey to understanding the health of your business. Many teams treat the KPI report as the final destination.
There is no final destination when it comes to KPIs and KPI reports. Establishing and monitoring key performance indicators is a continuous process, with the KPI report presentation simply serving as a great way to keep all appropriate parties aligned and informed.
For many teams, the idea of a KPI report conjures up images of being called into an office and being held accountable for team performance. It can be intimidating.

But it is a natural component of how smart businesses work. They structure their objectives around defined KPIs so that everyone, stakeholders, executives, managers, and employees, can track performance against objectives.
For a KPI to be successful, it must avoid common pitfalls, such as lacking ownership and accountability. Each KPI needs a clear owner who communicates how they will drive the result. That owner should also prepare and present the KPI report.

What is a KPI report?
A KPI report is a presentation that summarizes current performance compared to objectives. It can be presented in a variety of ways, from spreadsheets and slide decks to formal written reports and, preferably, dashboards.
A KPI dashboard, aside from offering easy-to-understand and real-time access to your KPIs, can double as a KPI report, especially when you want to provide a dynamic view of the data behind your KPIs. A KPI dashboard helps frame the conversation around clear charts and tables, and it can save you from scrambling at the end of the month or quarter to compile notes for your KPI report.
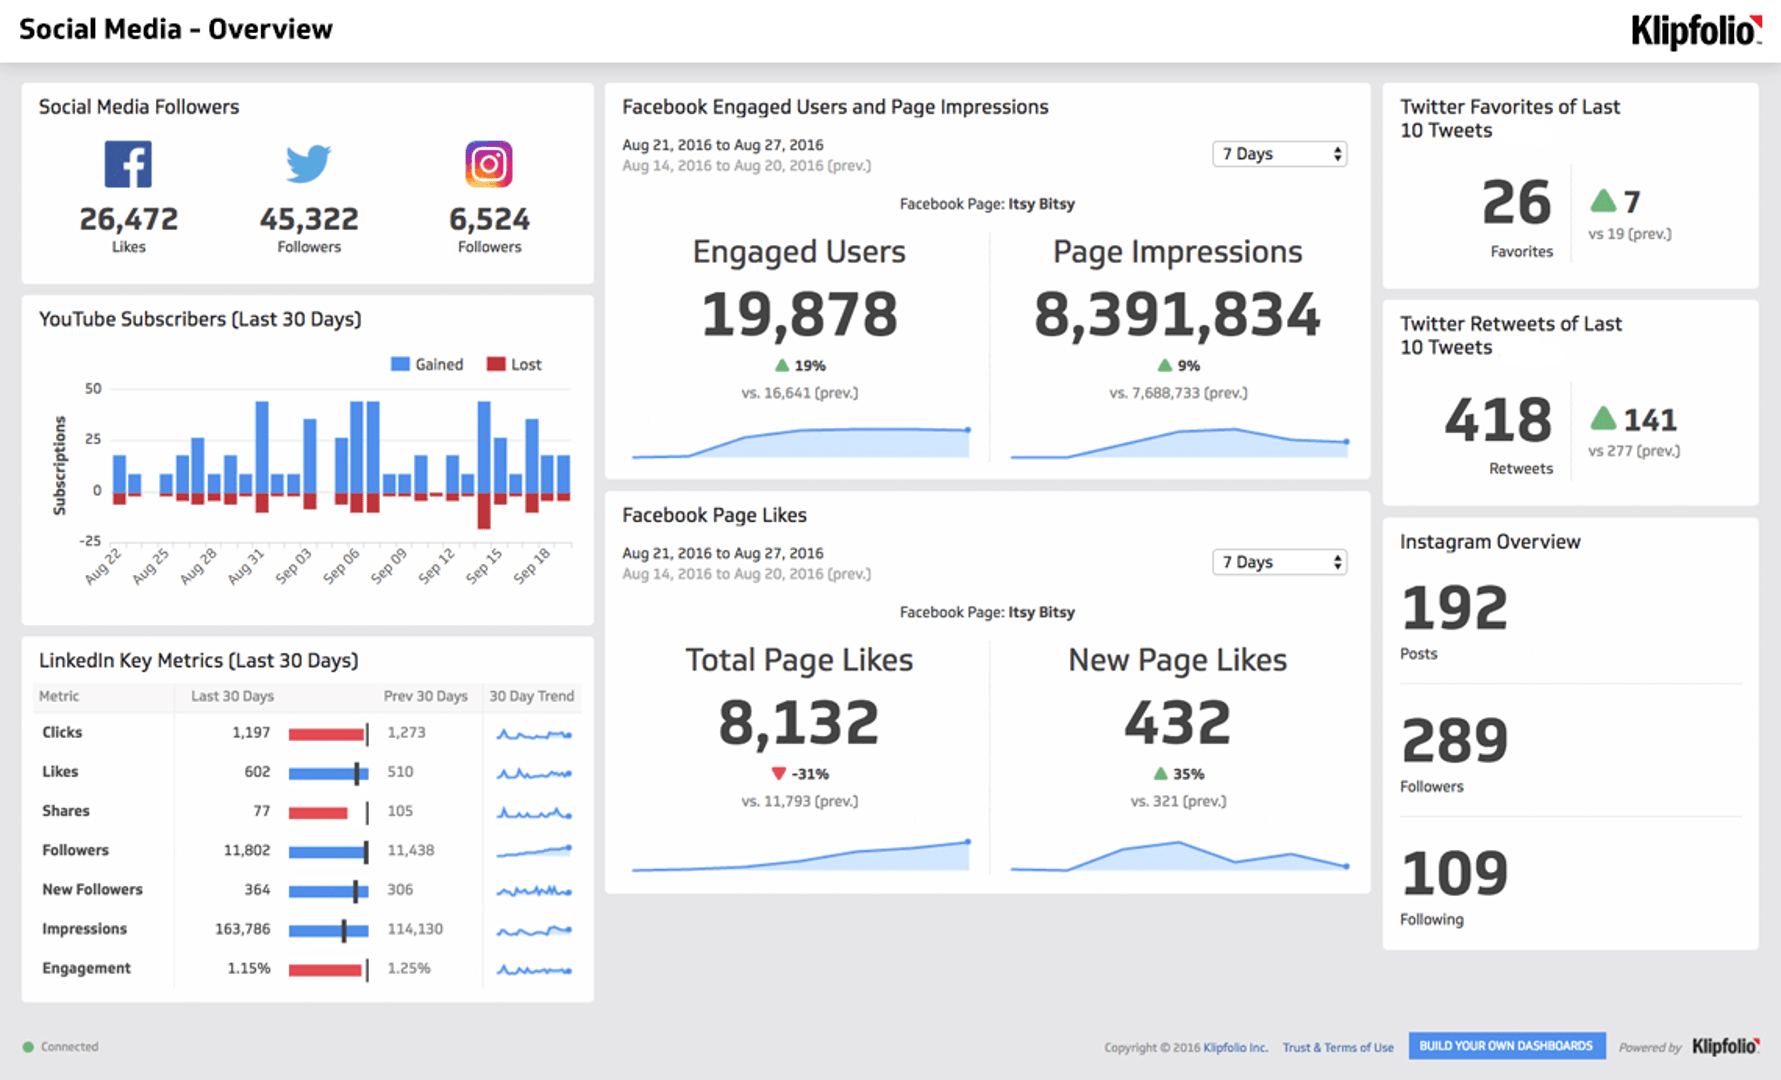
Dashboards can take work to build, but once you have done the upfront setup, you can step back and let the data you pull in update in real time. Below is an example of a social media KPI dashboard.
Delivering a solid KPI report is about striking a balance between managing the message and being transparent with the numbers.
How to deliver a KPI report

Deliver honest KPI reports
Whether your numbers are good or bad, provide stakeholders with a plain-spoken view of performance. If results are under target, explain why, document what you are changing next, and include a date for the next check-in.
Use visuals for your KPI report
Raw numbers rarely tell the full story. Choose visuals that fit the audience and the question. For example, a leaderboard is a clear way to present Salesforce dashboards.

Schedule regular KPI updates
KPIs must be accountable and time-bound. Targets should evolve as the business changes. Show progress by providing stakeholders with frequent, regular updates. A monthly reporting cadence keeps everyone aligned.
Redefine KPIs when needed
Ambitious targets are useful, unrealistic ones are not. Setting a top-line target that is far beyond current capacity can demoralize the team. Set stretch targets for your KPIs that are achievable with effort, and you will still see meaningful progress if you fall short.
Give transparent access to your KPIs
Make KPIs available to everyone to monitor in real time. TV dashboards are a simple way to democratize data and keep everyone on the same page.
Current best practices
- Limit the list: Focus each report on 3 to 7 KPIs per audience.
- Define clearly: Include metric definitions, owners, and data sources.
- Show targets: Add targets and thresholds with green, yellow, and red ranges.
- Provide context: Annotate major events, launches, or outages that affect results.
- Mix indicators: Pair leading indicators with lagging outcomes to avoid surprises.
- Standardize timing: Agree on a reporting cadence and lock it in the calendar.
KPI reporting improves performance through accountability
If you have set a KPI target, your KPI report is how you remain accountable to that target. Presenting a KPI report reinforces the goal, the plan, and the results, and it invites help when course corrections are needed.
For a deep dive into setting the right KPIs, see How to establish key business metrics. You can build and present live KPI reports with Klips.
Related Articles

5 tips to understand (and organize) your restaurant data
By Saleem Khatri — June 9th, 2026
6 dashboards I use daily to run my SaaS company
By Allan Wille, Co-Founder — April 10th, 2026
Business Metrics vs. KPIs: What’s the Difference?
By Jonathan Taylor — March 13th, 2026
