
Summary - You asked and we listened – today we’re thrilled to introduce two new fantastic features for metric builders: Data Feeds and Live Preview.
Less than a month after announcing new data exploration features in PowerMetrics, we’re back with more! You’ve told us the biggest barrier to creating amazing metrics and dashboards is prepping, cleaning, and transforming your data. You’ve also told us you’d love an interactive environment where you can see the progress of your metric as you’re building it. You asked and we listened – today we’re thrilled to introduce two new fantastic features for metric builders: Data Feeds and Live Preview.
New PowerMetrics customers will see these features right away. A staged release will ensure established customers get some time to understand and appreciate these changes before migrating from the old world to the new.
.png)
What is a Data Feed?
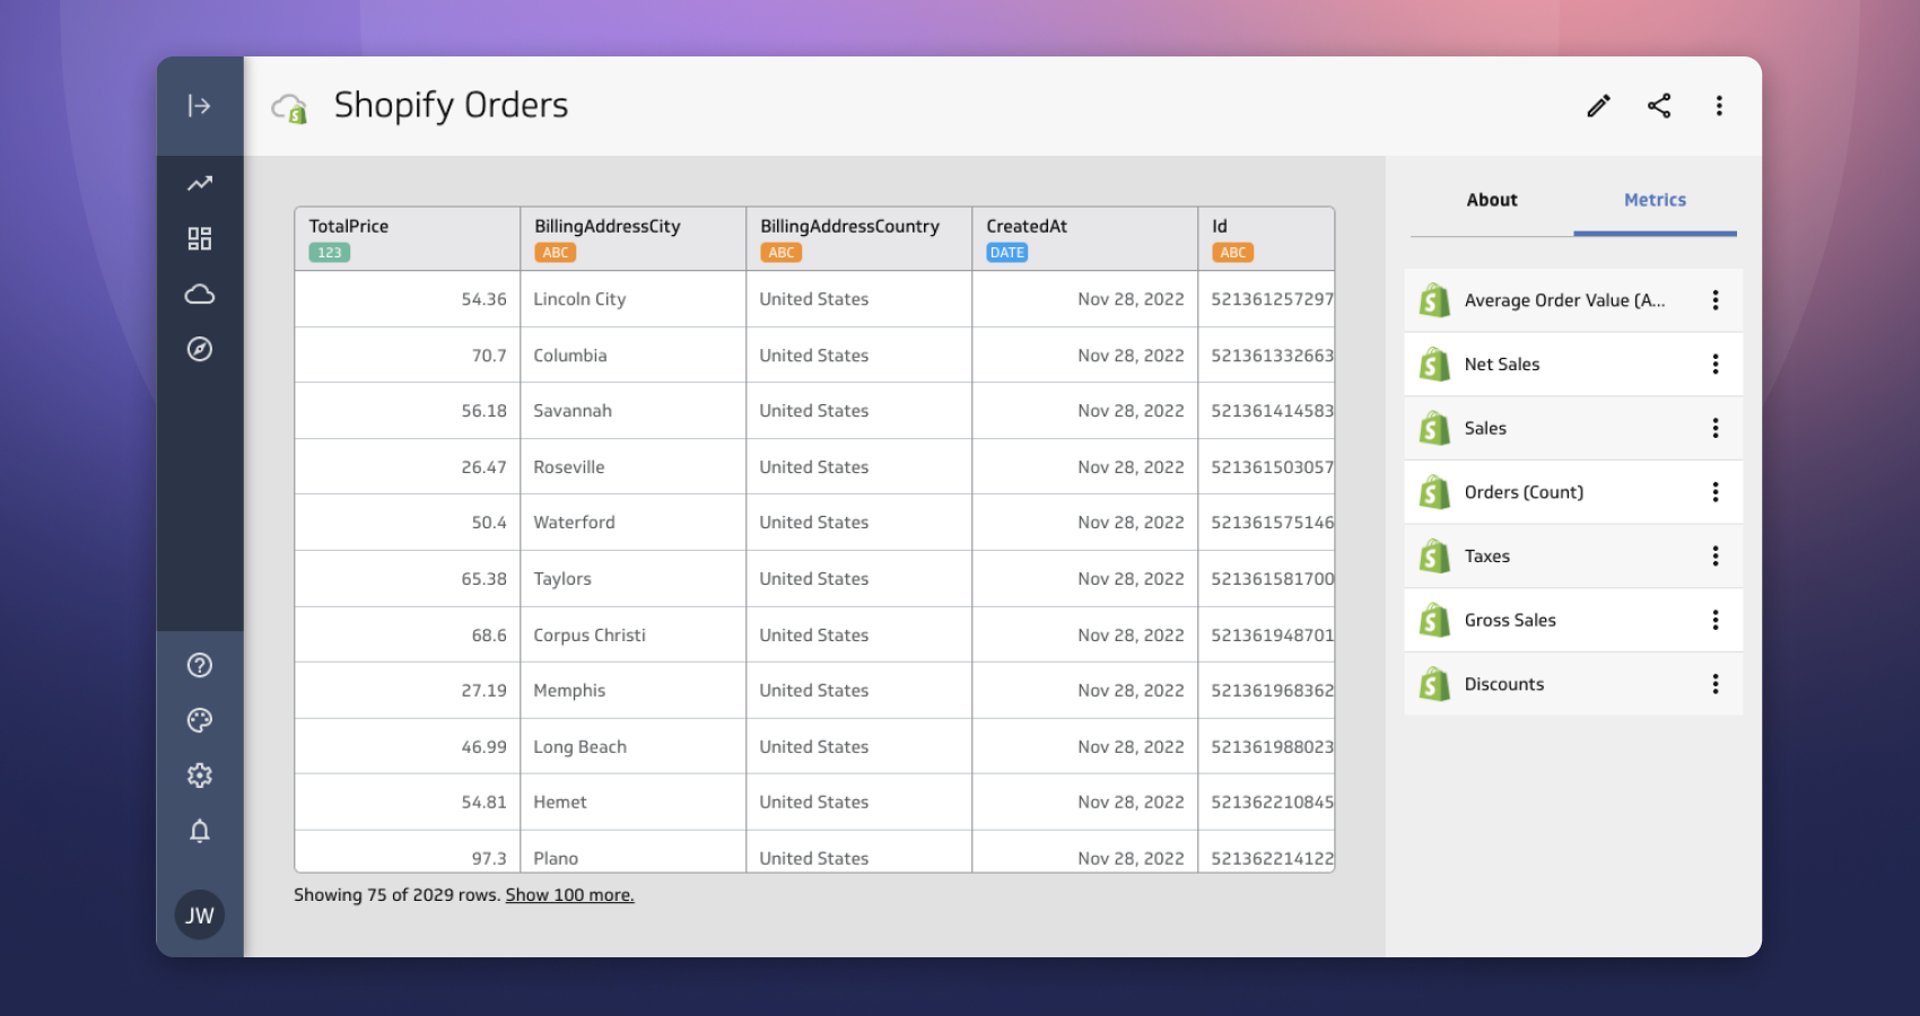
Data feeds are the easiest and most comprehensive tool for converting your data into a format you can use for metrics. By combining our visual query builder with improved modelling capabilities into a unified, all-in-one workflow, we’ve simplified data retrieval and data prep like never before. We’ve also combined your data query (formerly your data source) and data prep (formerly your model) into one object - your data feed. This allows you to connect to your data once and build one or more data feeds that can be reused across multiple metrics. It’s much easier (and faster) than before to see the connection between the source of your live raw data, your data feed, and your metric.
One of the most powerful things about data feeds is how they help you prepare, transform, and cleanse messy, incomplete or incorrect source data. Streamline your data by drilling down to the specific data you need for each metric. Preview the data your feed is capturing as you filter and refine your query. Transform and consolidate your data using Excel-like formulas and functions, unpivot, and merge/join. Automatically convert complex tree-structured data, like JSON or XML, into user-friendly tabular data. Data feeds make your data approachable and easy to work with, so more people on your team can understand it and apply it to their metrics.
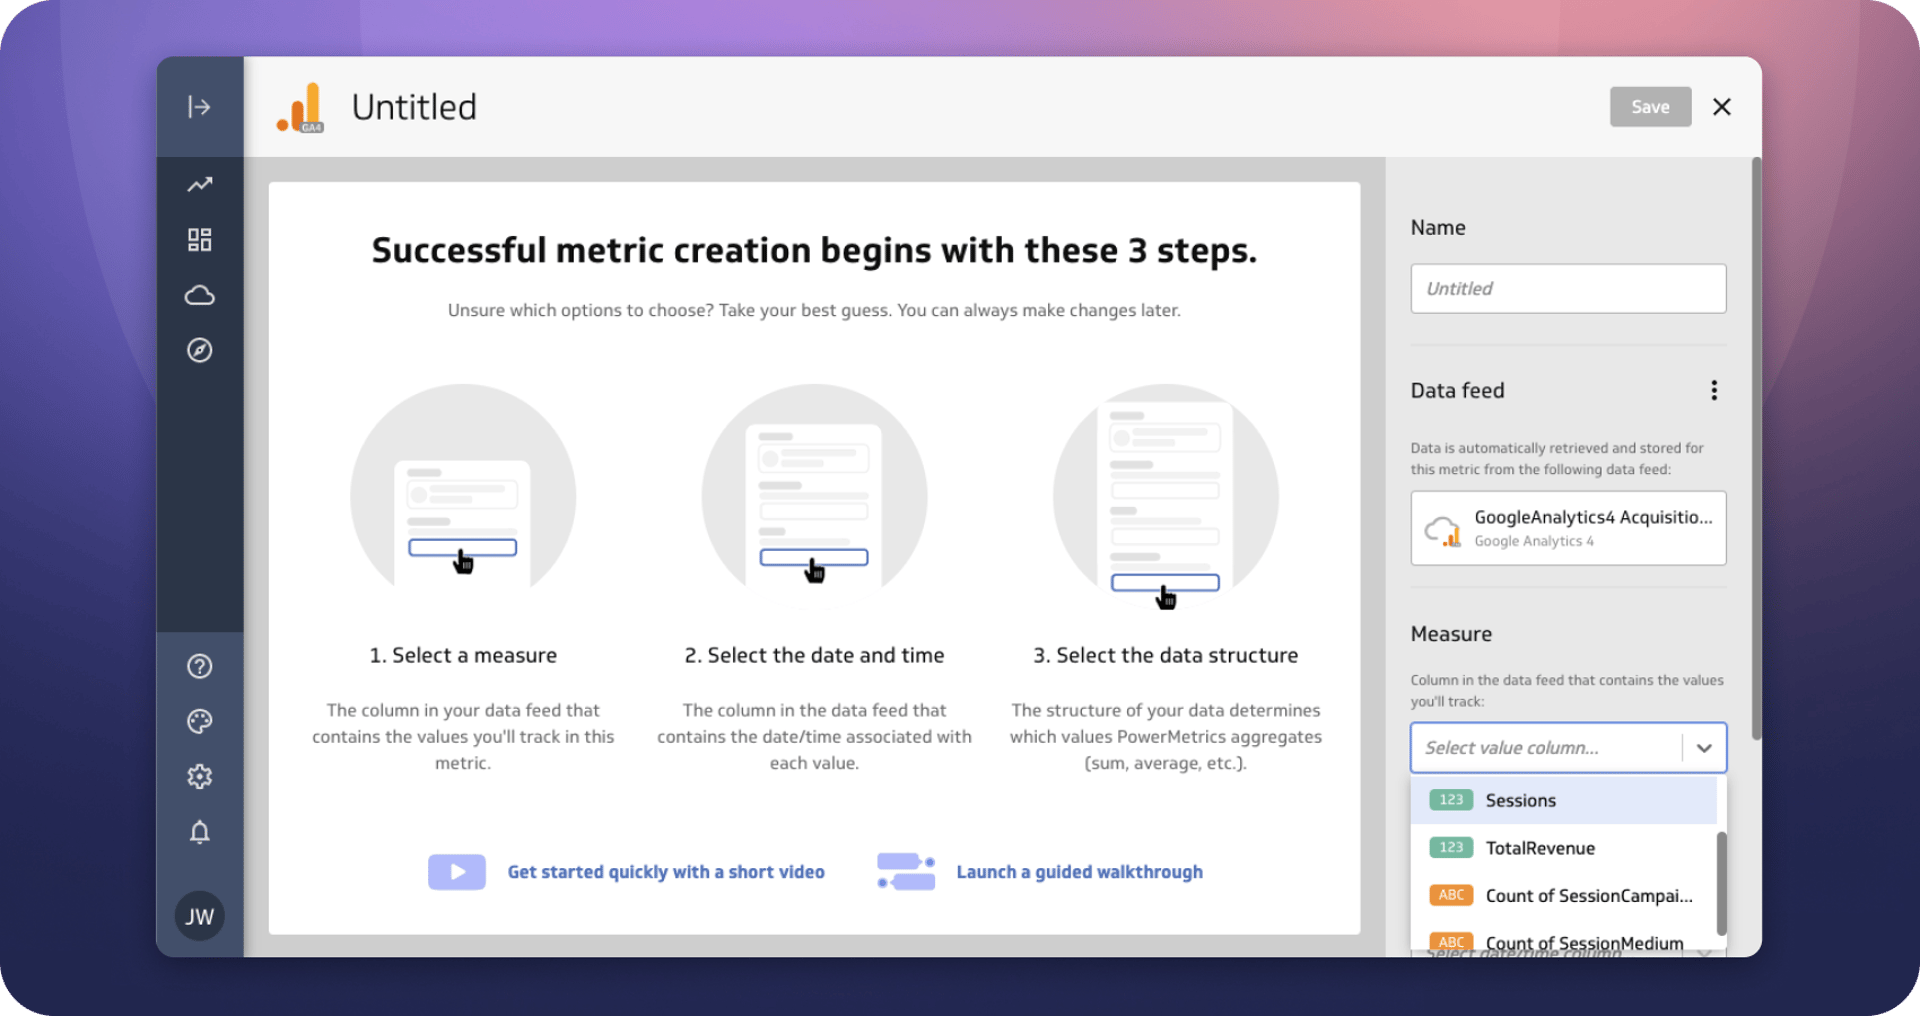
When you add custom metrics, you’ll craft your own data feeds, with the help of the visual query builder and an intuitive, comprehensive data feed editor. To make things even easier, when you add pre-built (instant) metrics for any service in our library, we’ll automatically create and manage your data feeds for you.
Data feeds ensure your metrics always display up-to-date information, automatically. With automated refresh, your data feeds channel new data into associated metrics, simultaneously adding to the metric’s history.
You’ll be in control of your data, with flexible sharing right options, data refreshes based on your schedule, and secure authentication. Access all your data feeds in one place in the all-new data feed library where you can filter and search to see the data feeds you want right now.
If you’re an existing PowerMetrics user, we’ll make sure you retain everything you’ve already built. Your existing data sources and models will be automatically migrated into data feeds so you can hit the ground running and immediately start enjoying the benefits of data feeds. Learn more about Data Feeds.
.png)
What is Live Preview?
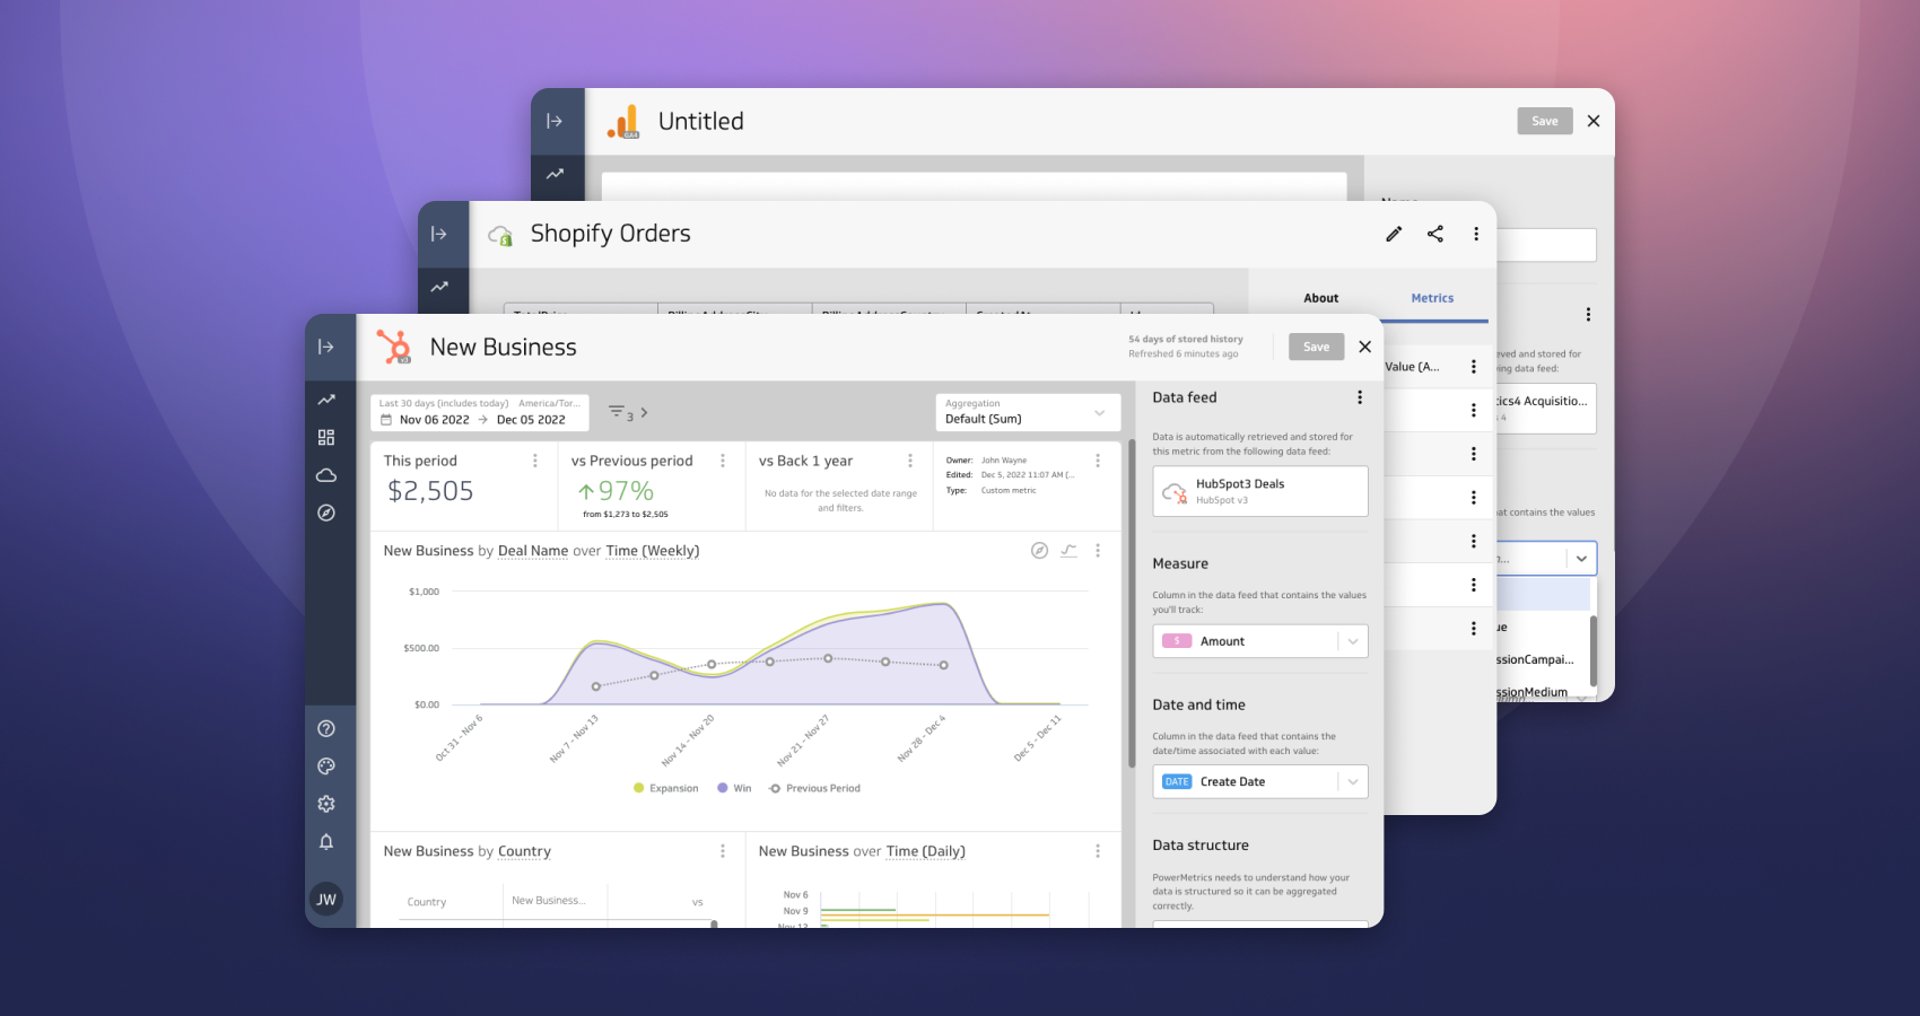
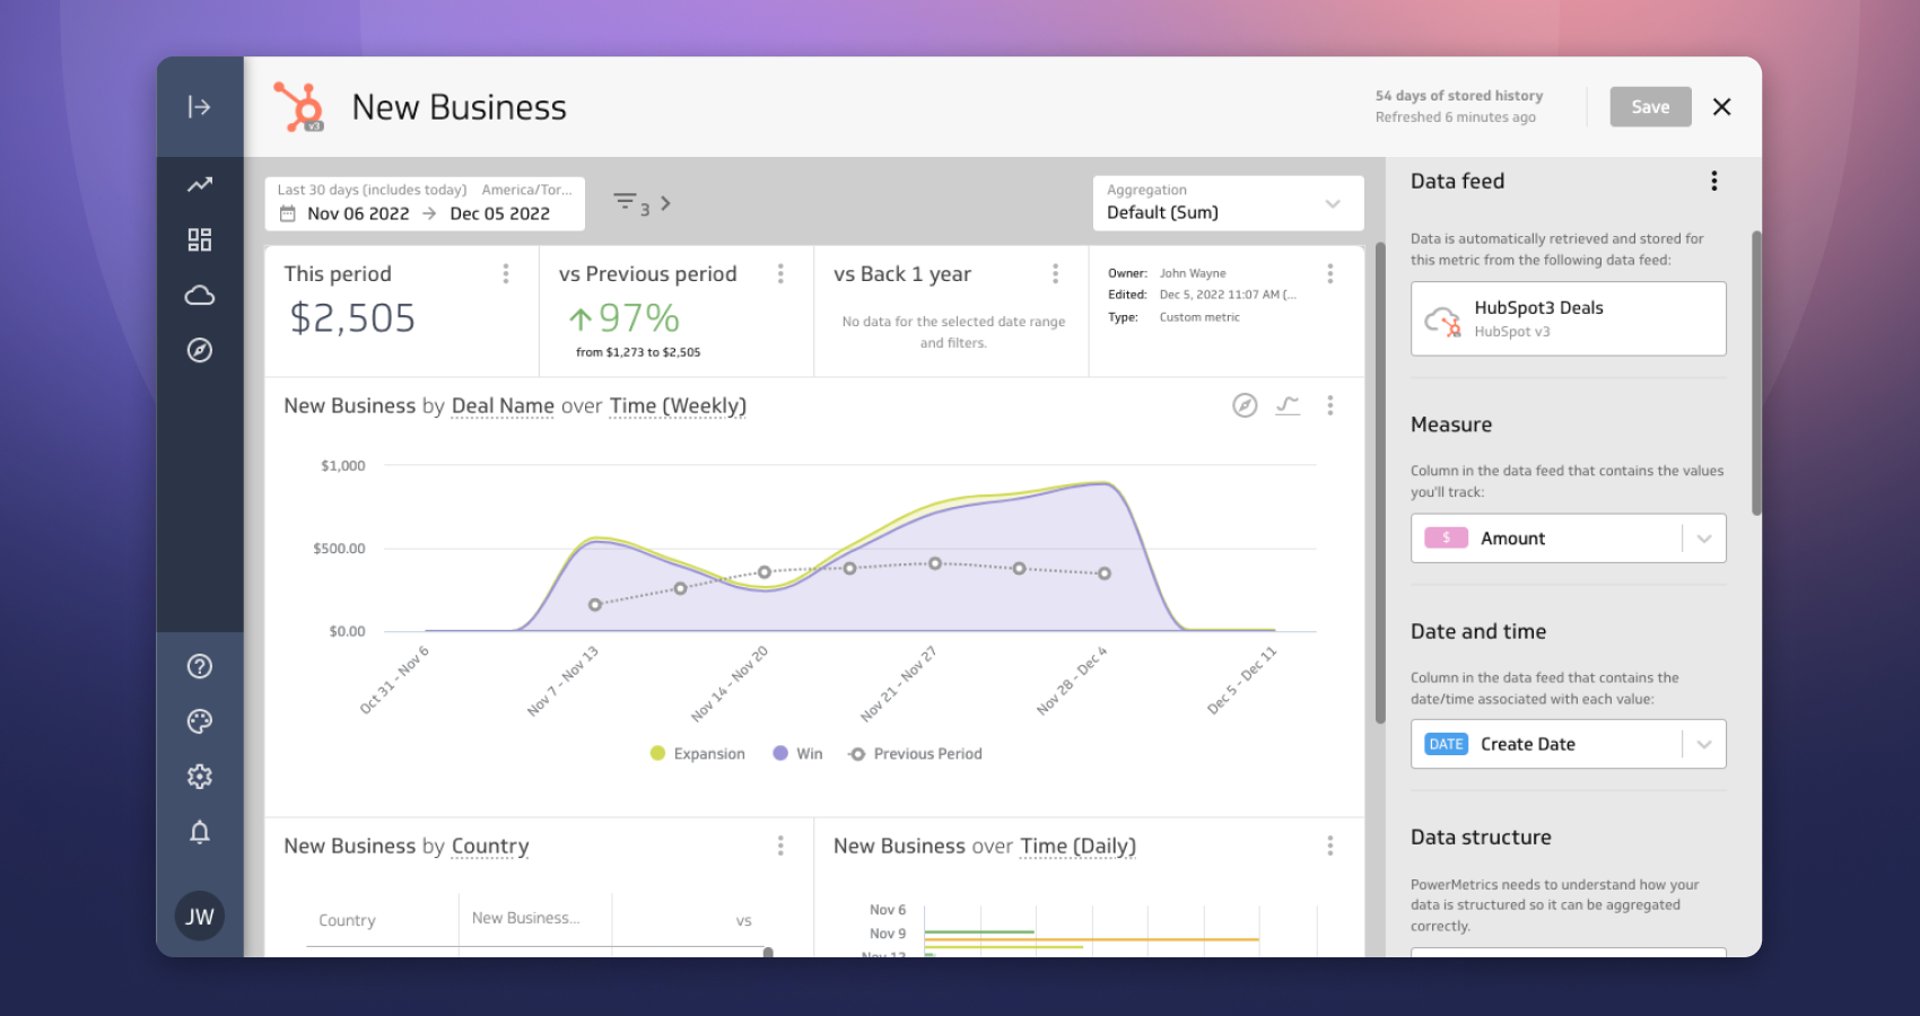
Your ask – simplify and speed up the process of creating custom metrics. Our answer – Live Preview. Our all-new single metric creation and editing environment - where you can see the impact of your choices as you create and edit your metrics. No more multi-step, static wizard. Now you can see your changes and feel free to experiment with data and settings selections, all before you commit and save the metric.
We’re bringing more focus to metrics. When we added data feeds we “flipped the script” so you don’t start with data anymore. Instead, you start with an empty metric, connect it to a data feed, select your measure, and then watch your metric come to life.
.png)
Our new design highlights the relationship between your data and your metric. When you make changes to the data feed, you’ll immediately see those changes in the metric. When you create or edit a metric, you’ll do it in the familiar environment of the metric’s homepage, which is increasingly becoming the place to be. On the homepage, you’ll start out with metric views based on our recommended settings. Feel free to customize and explore these views, with no risk to your data. Seeing your customizations as a live preview will help you understand how to build the best metrics and, hopefully, lead you to insightful data discoveries.
Use the live preview as a guide to get your metric right the first time. Experiment by choosing a different measure, time dimension, or data shape, applying filters, comparing previous periods, adding and removing dimensions, or even changing the aggregation. You’ll see the impact of your changes in real time, before saving. Save time by opening and editing the data feed directly from the metric (instead of going from the metric to the modelled data source page to the raw data source page). And … we didn’t forget about calculated metrics. They got a redesign too, with live preview and an enhanced formula bar.
Stay tuned…
We have more amazing features coming in the next month that you won’t want to miss. Here’s a hint – Improved security and the ability to view dashboards outside of PowerMetrics. Stay with us as we continue to add new features to help you succeed with data.
Related Articles

Case Study: How Media Propulsion Laboratory improved client analytics with the PowerMetrics – BigQuery integration
By Cathrin Schneider — September 12th, 2024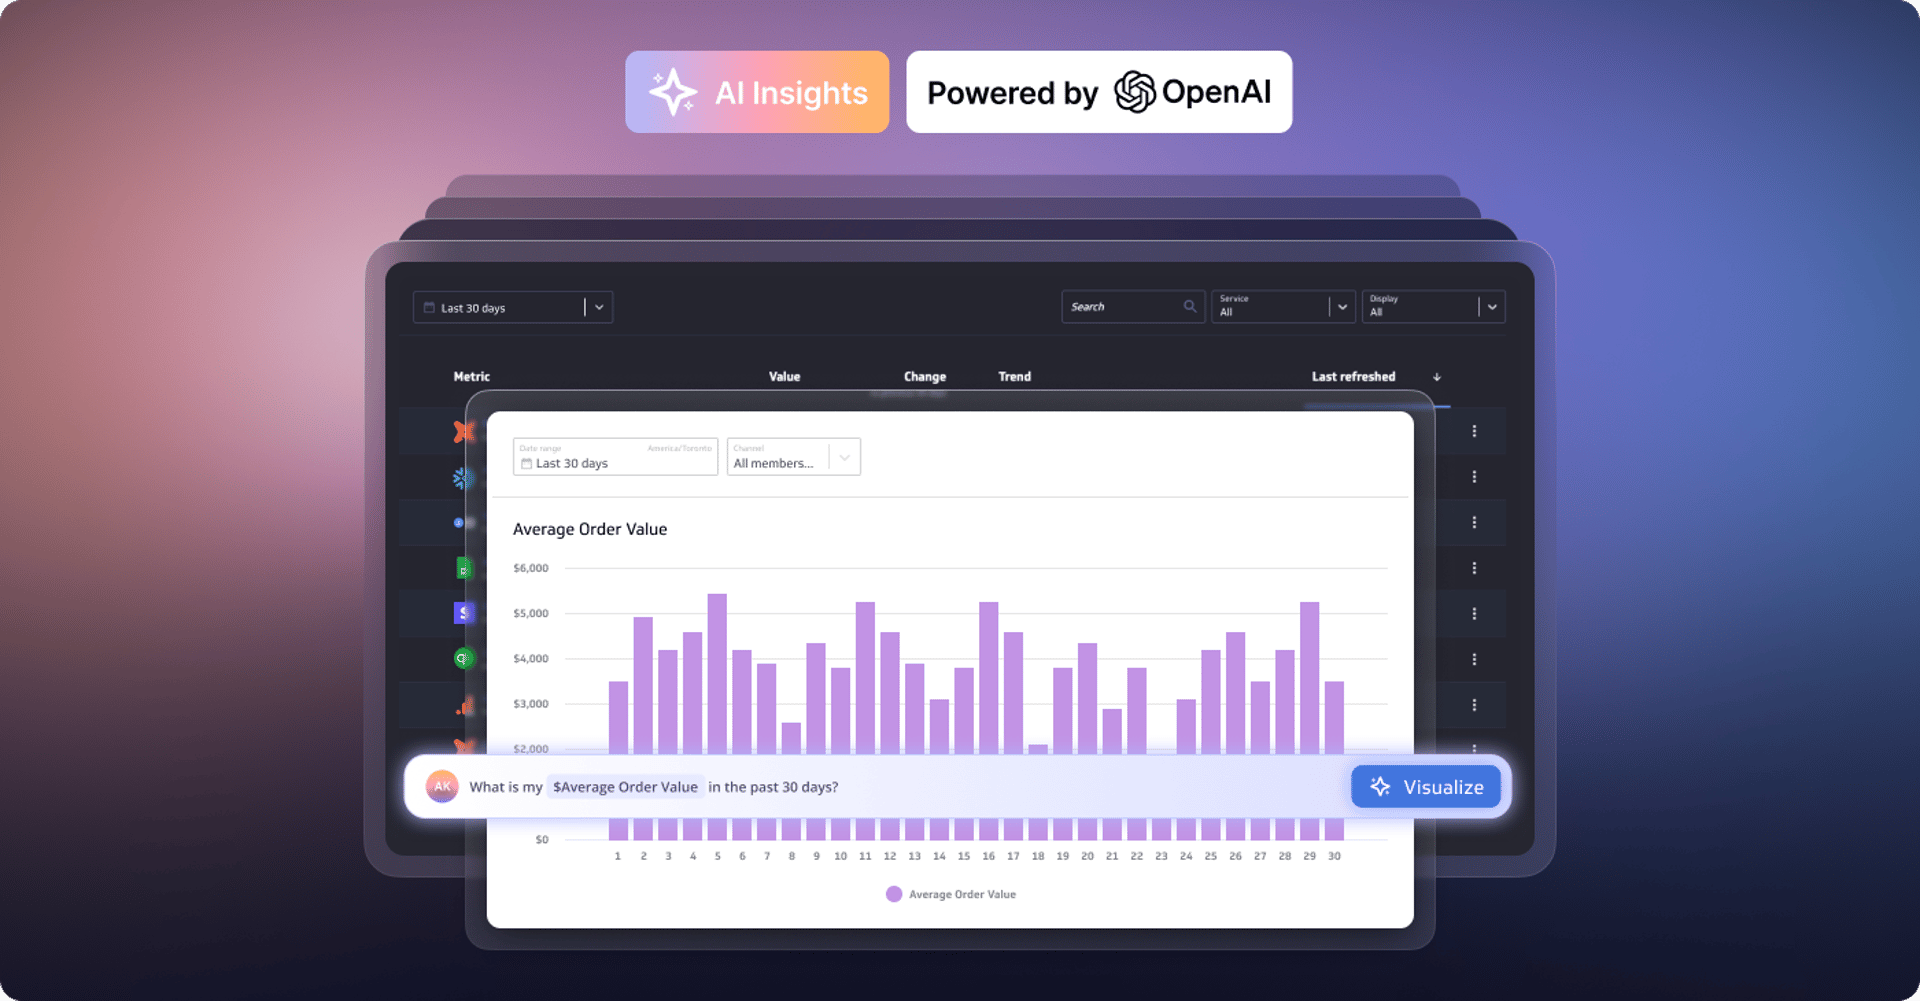
Metrics provide rich context for better AI: Introducing the new PowerMetrics AI experience
By David Mennie — June 21st, 2024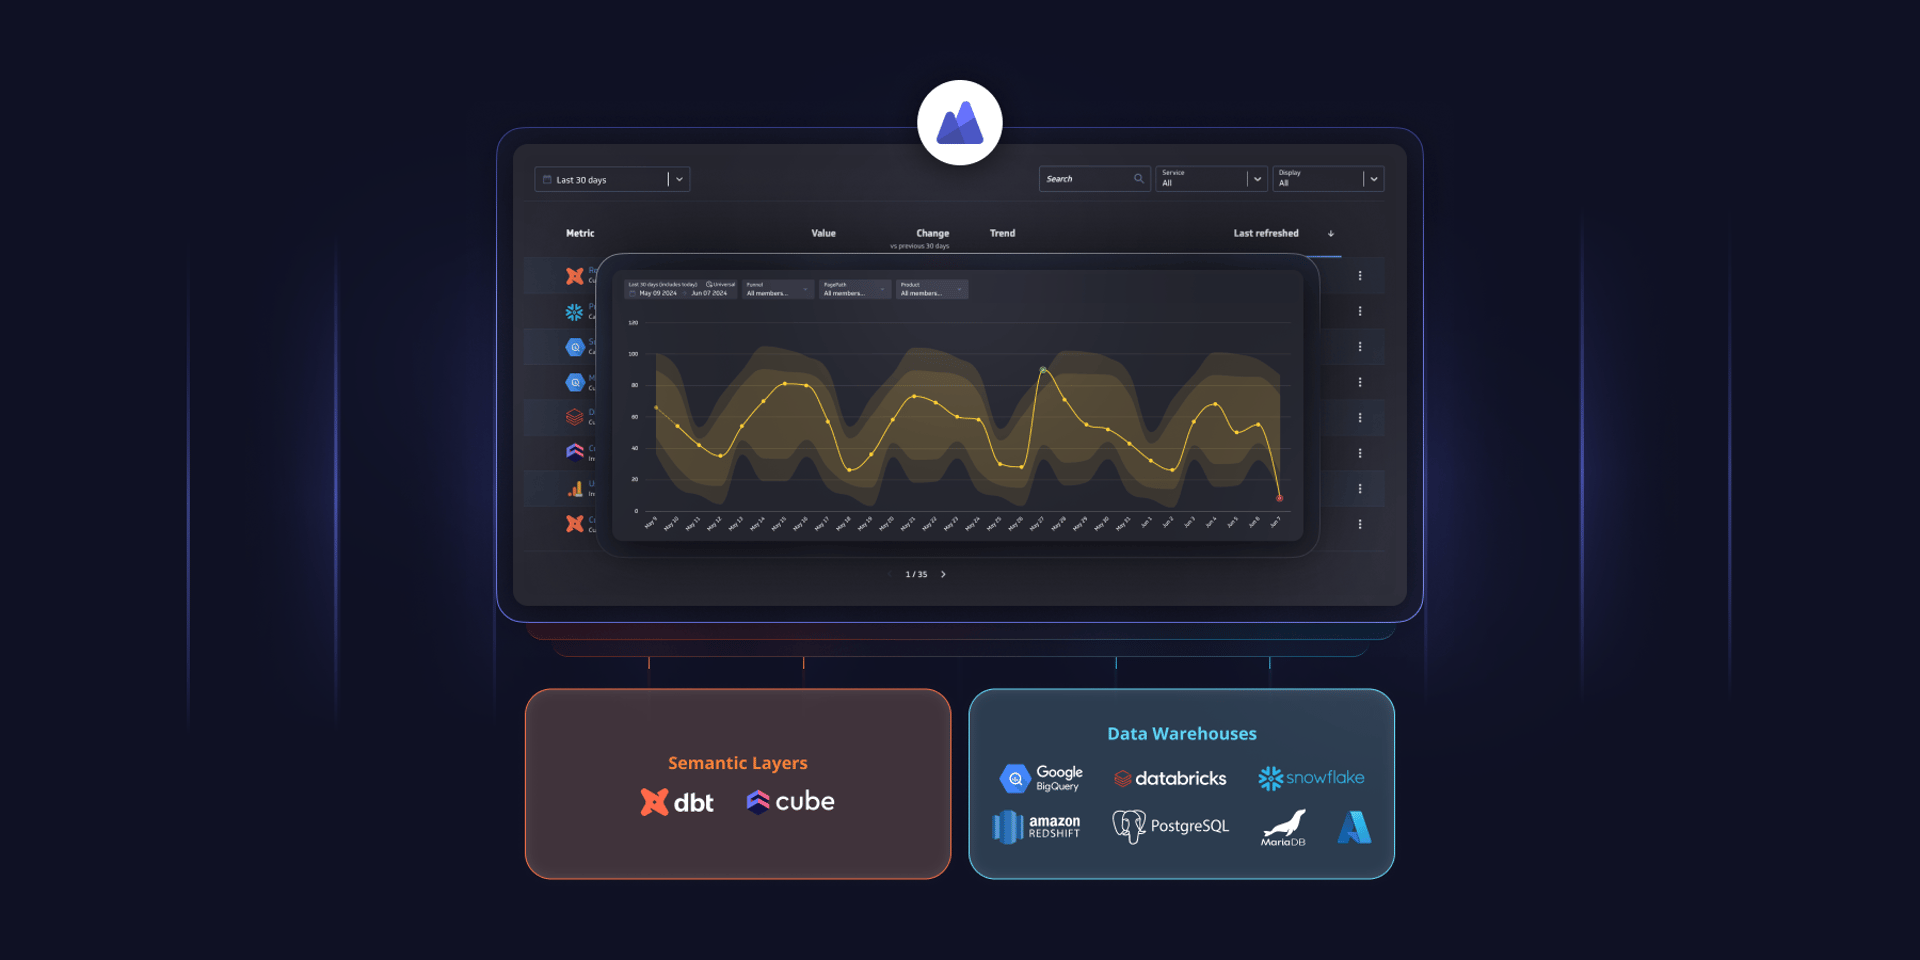
PowerMetrics - New data warehouse integrations and Cube semantic layer support
By David Mennie — June 14th, 2024