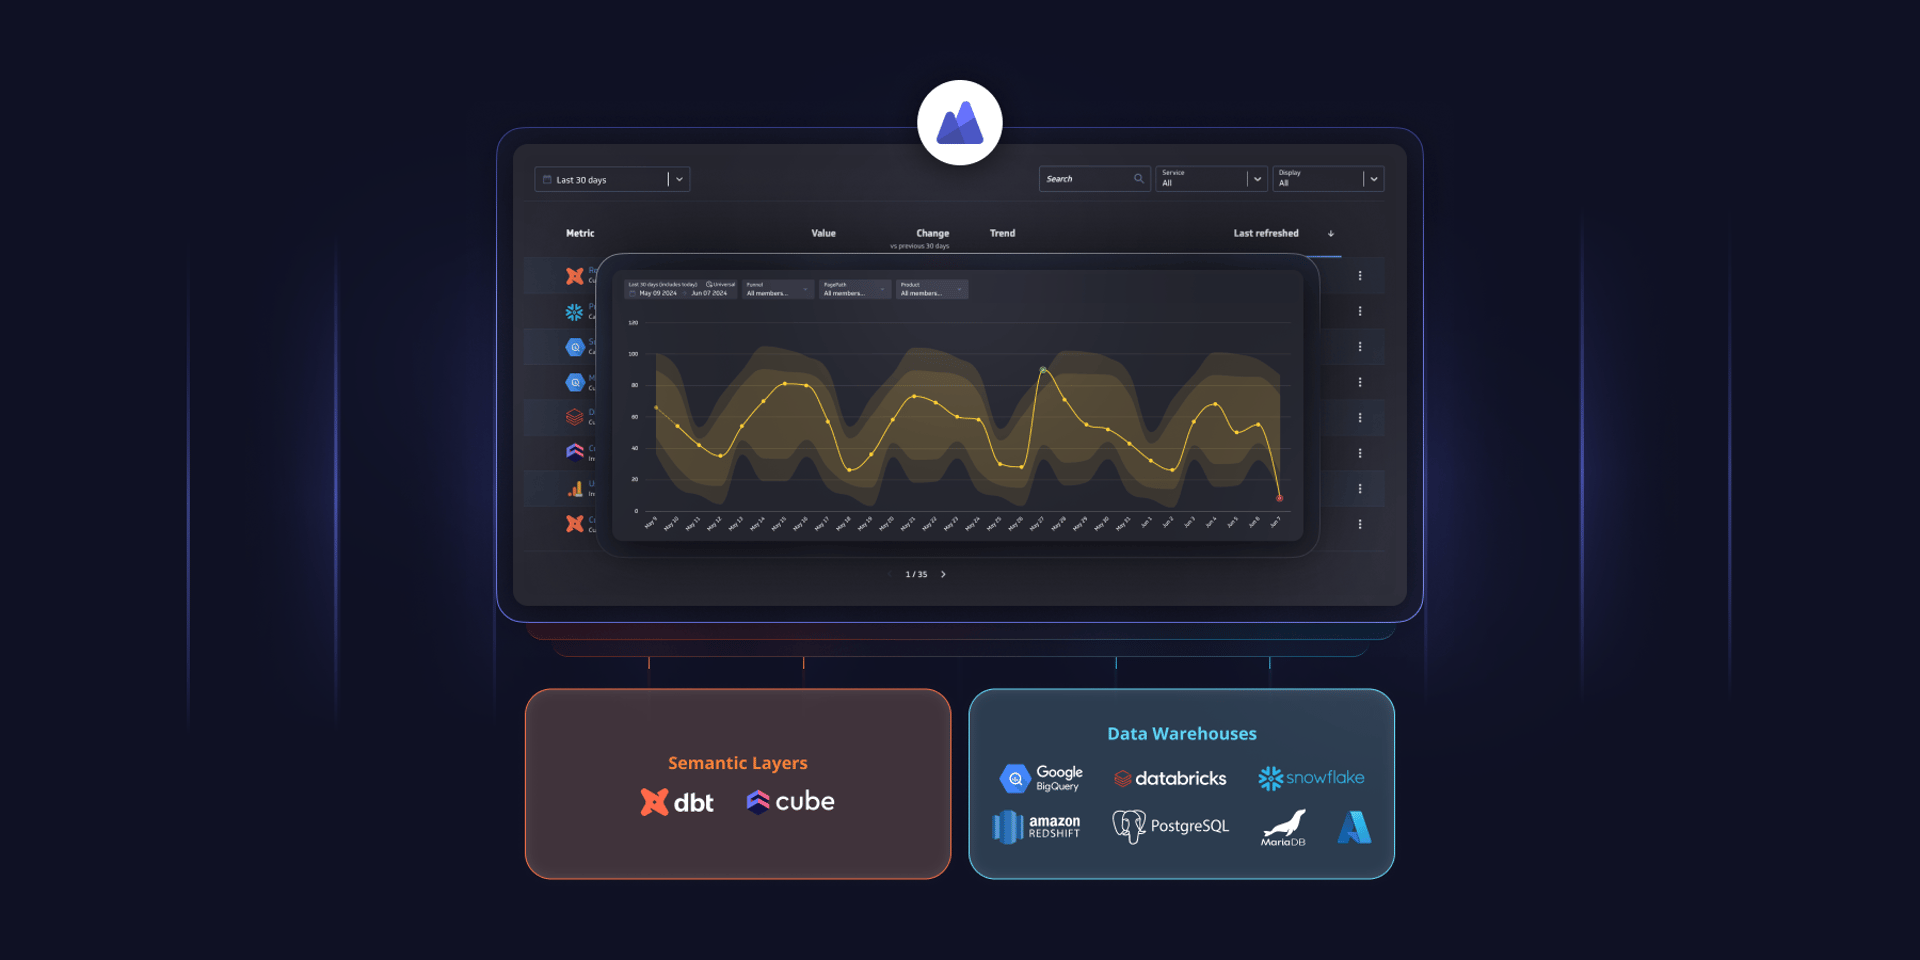

Summary - We’re excited to announce seven data warehouse integrations, including Snowflake, Google BigQuery, Databricks, Microsoft Azure SQL, Amazon Redshift, PostgreSQL, and MariaDB and support for the Cube semantic layer. PowerMetrics now has the most diverse set of metric data solutions available today with a full metric catalog and built-in analytics for hundreds of data sources. Kickstart a metric-first strategy within your existing data stack and add the power and flexibility to evolve into the future.
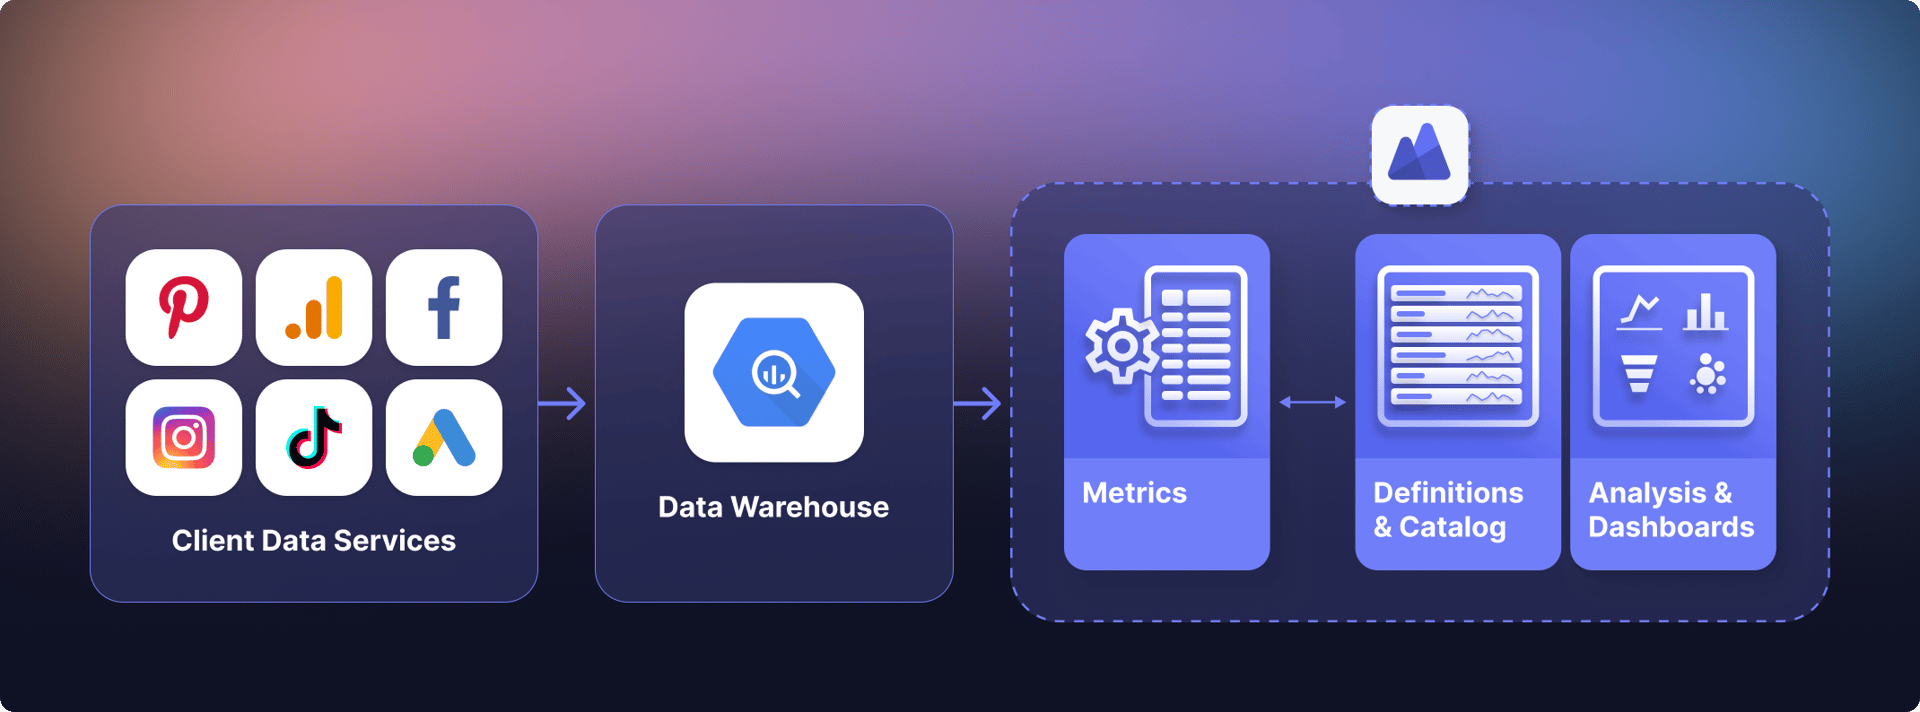
Metric-first analytics are taking the BI world by storm. Companies of all sizes are looking into how they too can incorporate a robust metrics strategy, including the exploration and visualization of metrics, all within their existing data stack. From universal semantic layers and data warehouses, for their gold-standard corporate data, to cloud service APIs, on-premise data, and spreadsheets, data teams are tasked with building a future-proof metrics strategy that evolves with their data stack.
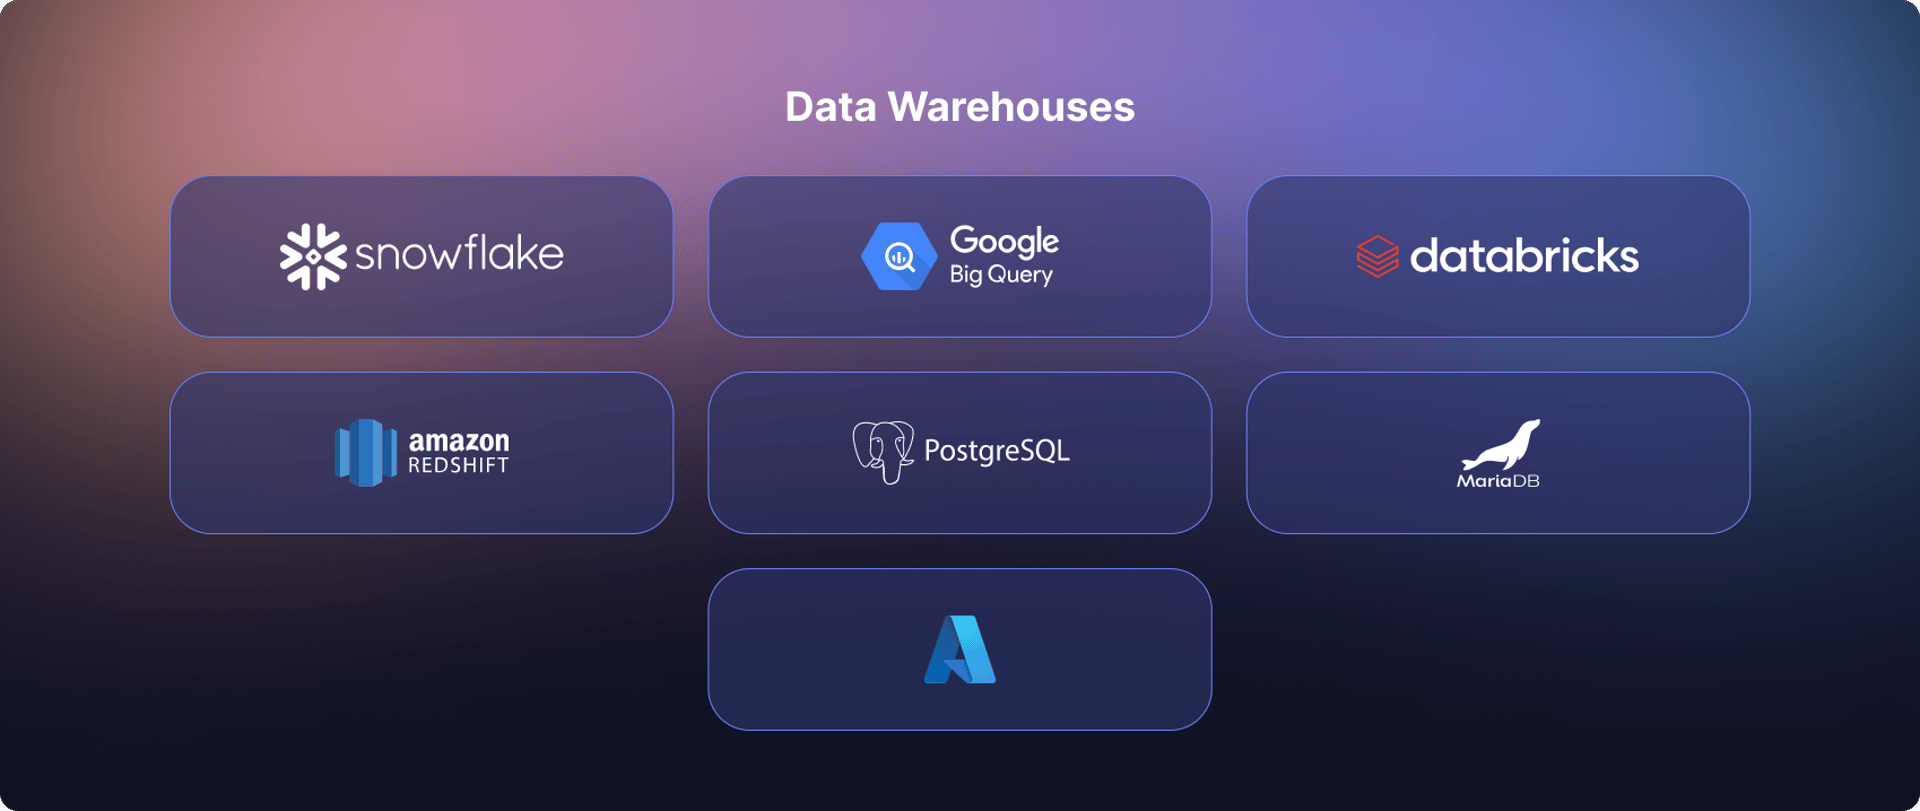
After months of development, we’re very excited to release our integration with seven leading data warehouses (Snowflake, Google BigQuery, Databricks, Microsoft Azure SQL, Amazon Redshift, PostgreSQL, and MariaDB) and support for Cube - a universal semantic layer. These new solutions not only give data teams more metric strategy options, PowerMetrics also adds value for business users, with an interactive metric catalog, advanced analysis, visualization, and dashboards.
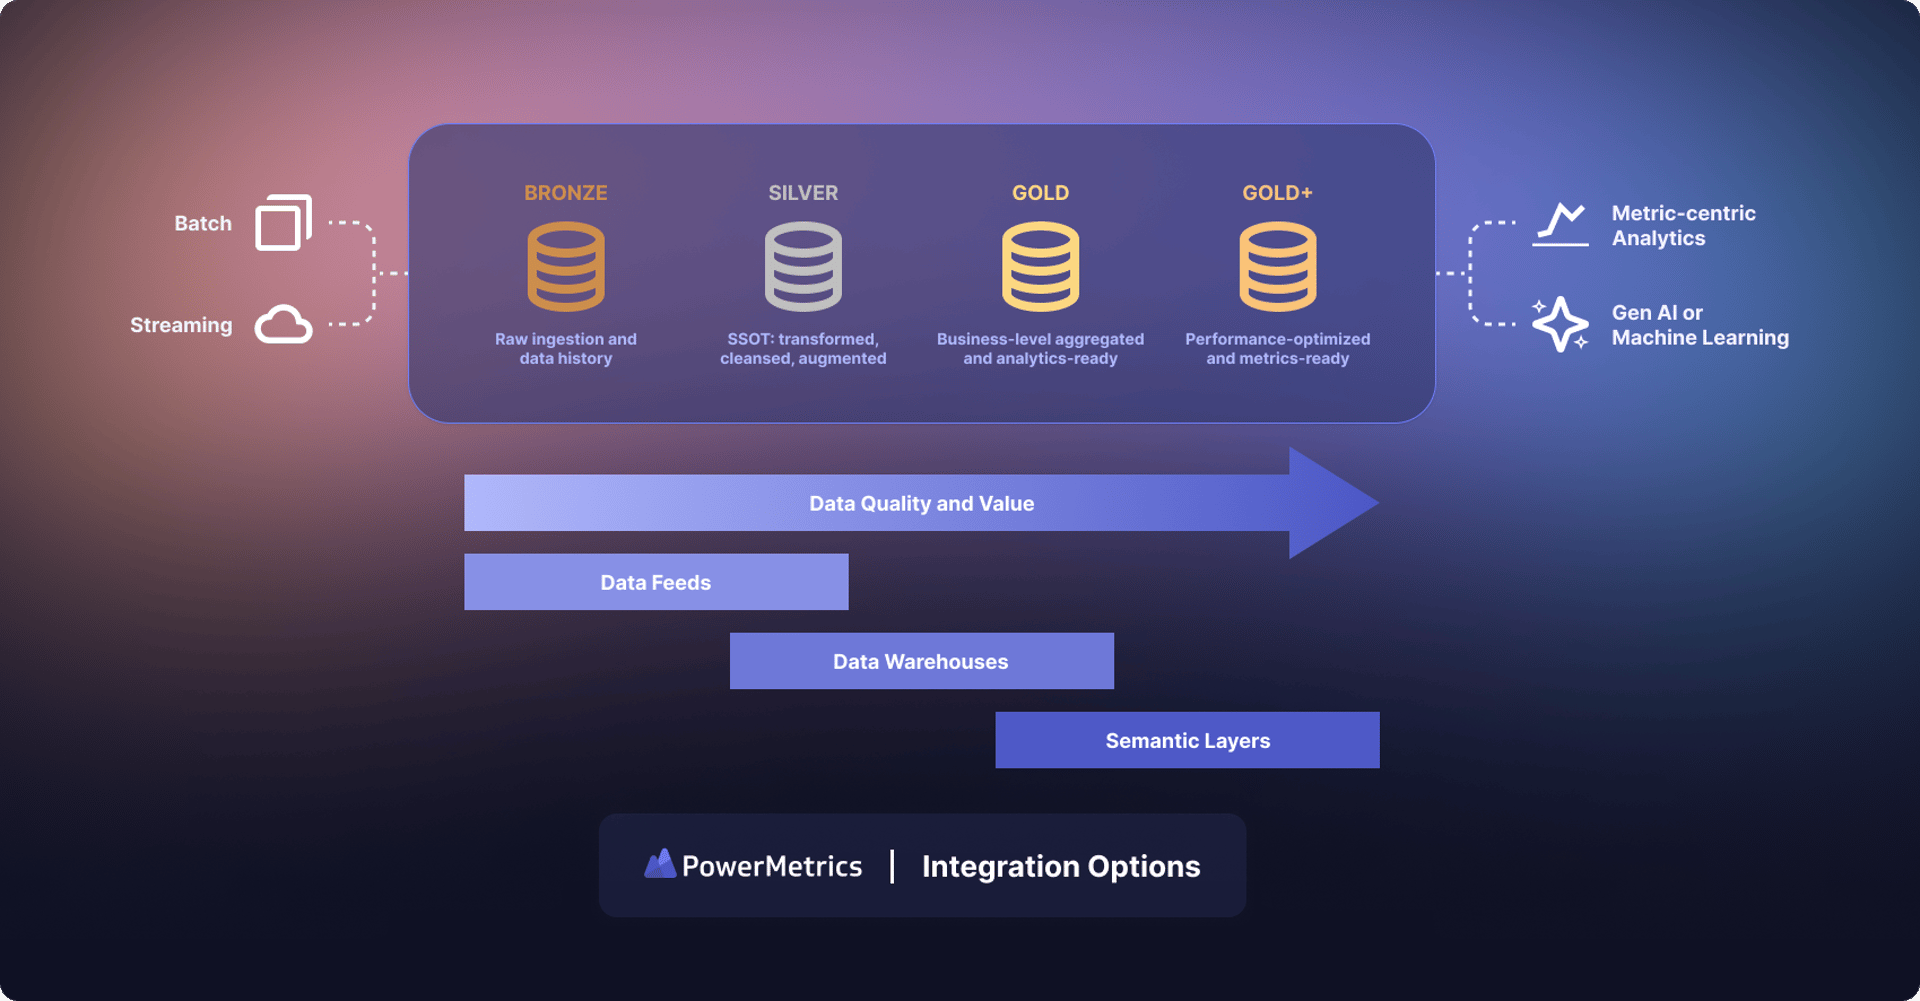
PowerMetrics is the only hybrid metrics solution available today that supports data warehouse metrics, semantic layer metrics (from Cube and dbt Labs Semantic Layer), and a custom modeling and hosted data solution used to create metrics with data pulled from hundreds of cloud based services, such as Shopify, Facebook Ads, and Zendesk, files, such as Excel, Google Sheets, Smartsheet, and Airtable, and direct REST/API queries for custom data applications. The reality is data teams work with data of varying quality - from raw to business-level, pre-aggregated, and analytics-ready data. PowerMetrics’ adaptable, futureproof metrics strategy connects to all of these sources and grows with you as your data stack evolves.
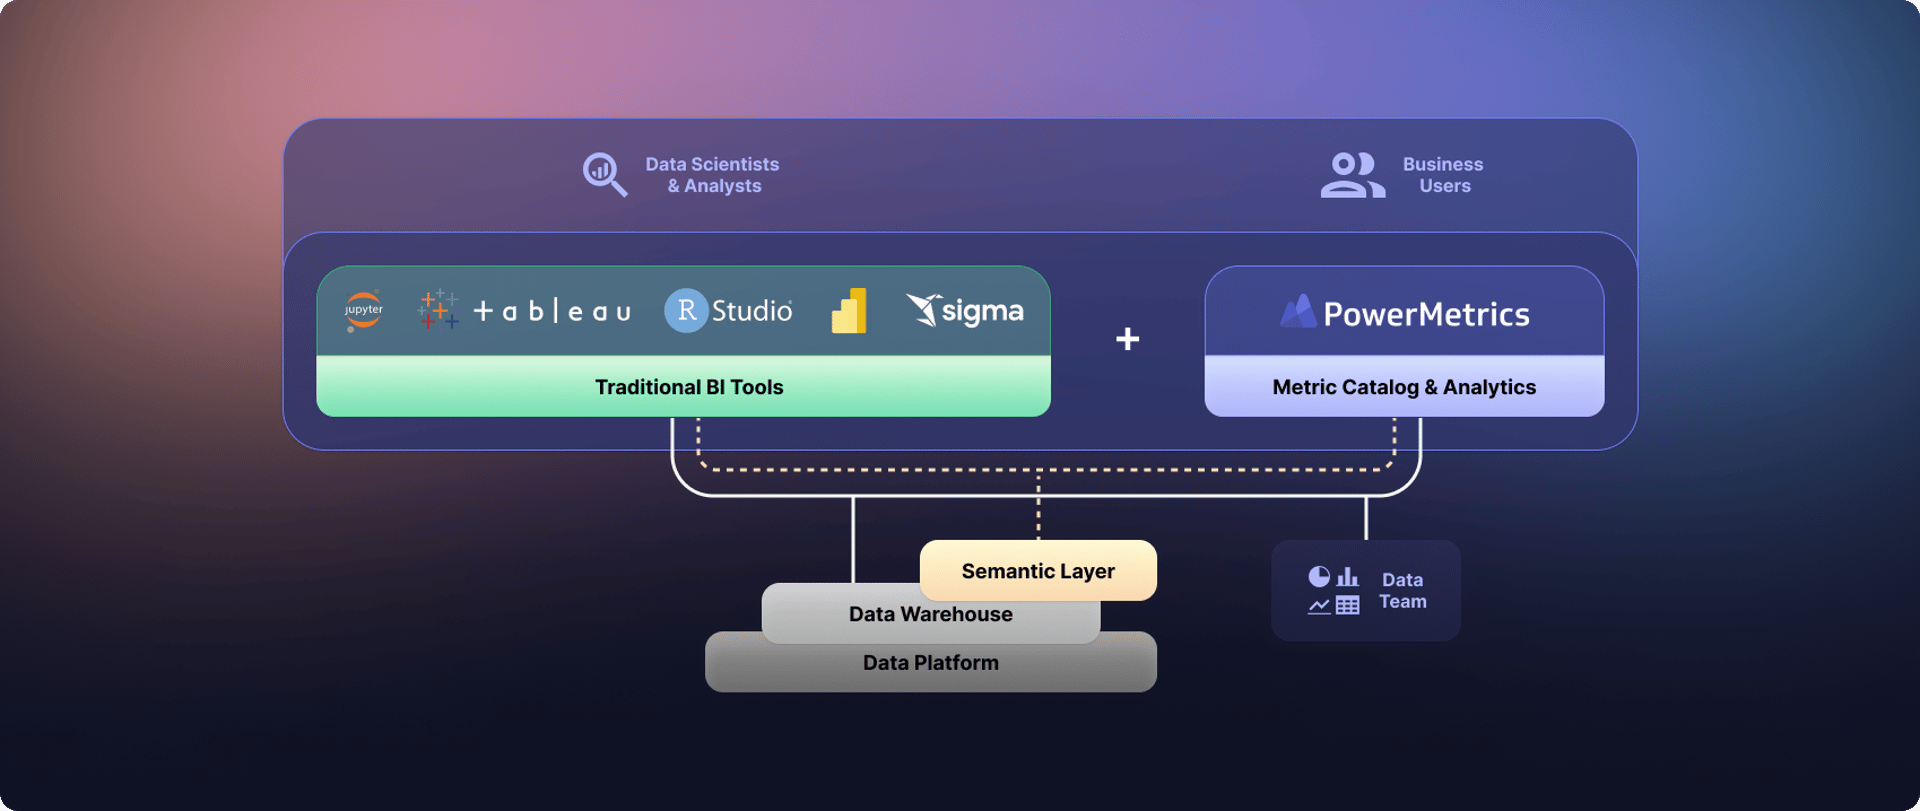
Are your data scientists or analysts using an enterprise BI solution, like Tableau, Power BI, or Sigma? PowerMetrics is designed to work alongside these tools, while providing a better experience that business users will love. This BI combination enables metric creators and consumers to use the application and interface that meets their needs.
Why data warehouse metrics?
Metrics created based on data warehouse tables/views have several advantages for data teams. One of the most important benefits is there’s no external storage of data. The single source of truth (SSOT) that exists in a company’s modern data stack is maintained and extended through to the metrics layer. The cleansing and transformation of data occurs within the data warehouse. This means preferred technologies, such as dbt Core or dbt Cloud, can be used to create the gold standard data required to be metrics-ready. Data teams have full control over the data transformation process, the exact columns in each table, the name of the table, and any optimizations they need to make. Finally, all the power and performance of the underlying data warehouse can be leveraged directly.
Our new data warehouse integrations enable:
- The fastest creation of metrics, based on data warehouse tables/views, in the industry
- Data teams to easily create metrics from tables or views from the most popular data warehouses
- All queries to be performed in real time on the data warehouse - no data is transferred externally
- The true power and performance of the data warehouse to be leveraged - no data size limitations
- PowerMetrics to update as soon as the underlying table or view in the data warehouse changes via a webhook
- Data teams to clean and define their own metrics-ready data within their data warehouse - no vendor lock-in or proprietary table formats
- Data teams to empower their business users to consume and visualize metrics from data warehouses in a true self-service fashion, all while maintaining full control of the underlying data stack
- Data warehouse metrics to be used interchangeably with semantic layer metrics, data feed metrics, calculated metrics, and instant metrics.
Data warehouse customer snapshot
Media Propulsion Laboratory (MPL) is a large digital advertising consultancy using PowerMetrics and BigQuery to visualize client campaign data.
Part of the Craft&Crew group of companies, MPL has clients including Google and Conagra Brands. MPL needed to visualize and share their marketing and ad campaign data internally and with customers. They moved from Looker Studio to PowerMetrics because of its user-friendly design. PowerMetrics solved their need for a professional, yet intuitive solution as most of their users work in marketing, not data teams. As such, they needed a less technical solution to enable their clients to make data-driven decisions.
MPL uses data from a wide array of marketing services including Pinterest, Google Analytics 4, and Facebook, but they store all their data in BigQuery. They connect to BigQuery data using the PowerMetrics data warehouse integration which allows a table/view within the data warehouse to be used across multiple metrics. Metrics are then shared with business stakeholders and made available to them via the metric catalog. Consumers access this “buffet of metrics” and instantly know which metrics to analyze - they’re the metrics certified by the data team. Non-technical users are able to easily analyze single or multiple metrics and create dashboards and reports. The data team has full control over which user can see or edit which metric or dashboard.
PowerMetrics has transformed our approach to data analytics at Media Propulsion Laboratory. The intuitive look and feel, coupled with the remarkable ease of use, have empowered our teams throughout the company. Klipfolio’s fast-moving, responsive, knowledgeable, and collaborative approach made the entire experience truly exceptional.
Richard Marginson, General Manager, Media Propulsion Laboratory
What are Cube metrics?
Cube is a popular universal semantic layer that helps give meaning to data and makes it accessible to everyone. Data engineers and application developers use Cube’s developer-friendly platform to organize data from their cloud data warehouses into centralized, consistent definitions, and deliver it to every downstream tool via its APIs. PowerMetrics connects directly to Cube Cloud, synchronizes with the data in a cube, and associates it with a metric definition for visualization.
Cube metrics do not store data in PowerMetrics. Instead, they define the necessary transformations from their metric query language into SQL against the data directly in supported data warehouses, query engines, and databases, such as Microsoft Fabric, ClickHouse, MotherDuck, and Trino, in addition to, Snowflake, Google BigQuery, Databricks, and Redshift.
Our new Cube integration enables:
- Data teams to define metrics from cubes directly in PowerMetrics
- Full support for Cube's two-level caching system (in-memory and pre-aggregations)
- PowerMetrics to update as soon as the underlying cube data changes via a webhook
- Cube metrics to be used in calculations and within the PowerMetrics metric catalog and combined with metrics using other data strategies, such as data warehouse, data feeds, and instant metrics.
- Business users to explore, analyze, visualize, share, and build dashboards using Cube-based metrics
Data teams create and curate the metric catalog. Business users access and explore metrics in the catalog without assistance from the data team. That's the true power of PowerMetrics.
How do data warehouse metrics and Cube metrics work in PowerMetrics?
PowerMetrics enables you to create metrics from data, and from calculations based on other metrics. No matter the underlying metric type, PowerMetrics provides a consistent and rich set of capabilities. Data warehouse and Cube metrics work naturally alongside metrics based on data feeds, providing a comprehensive, seamless user experience.
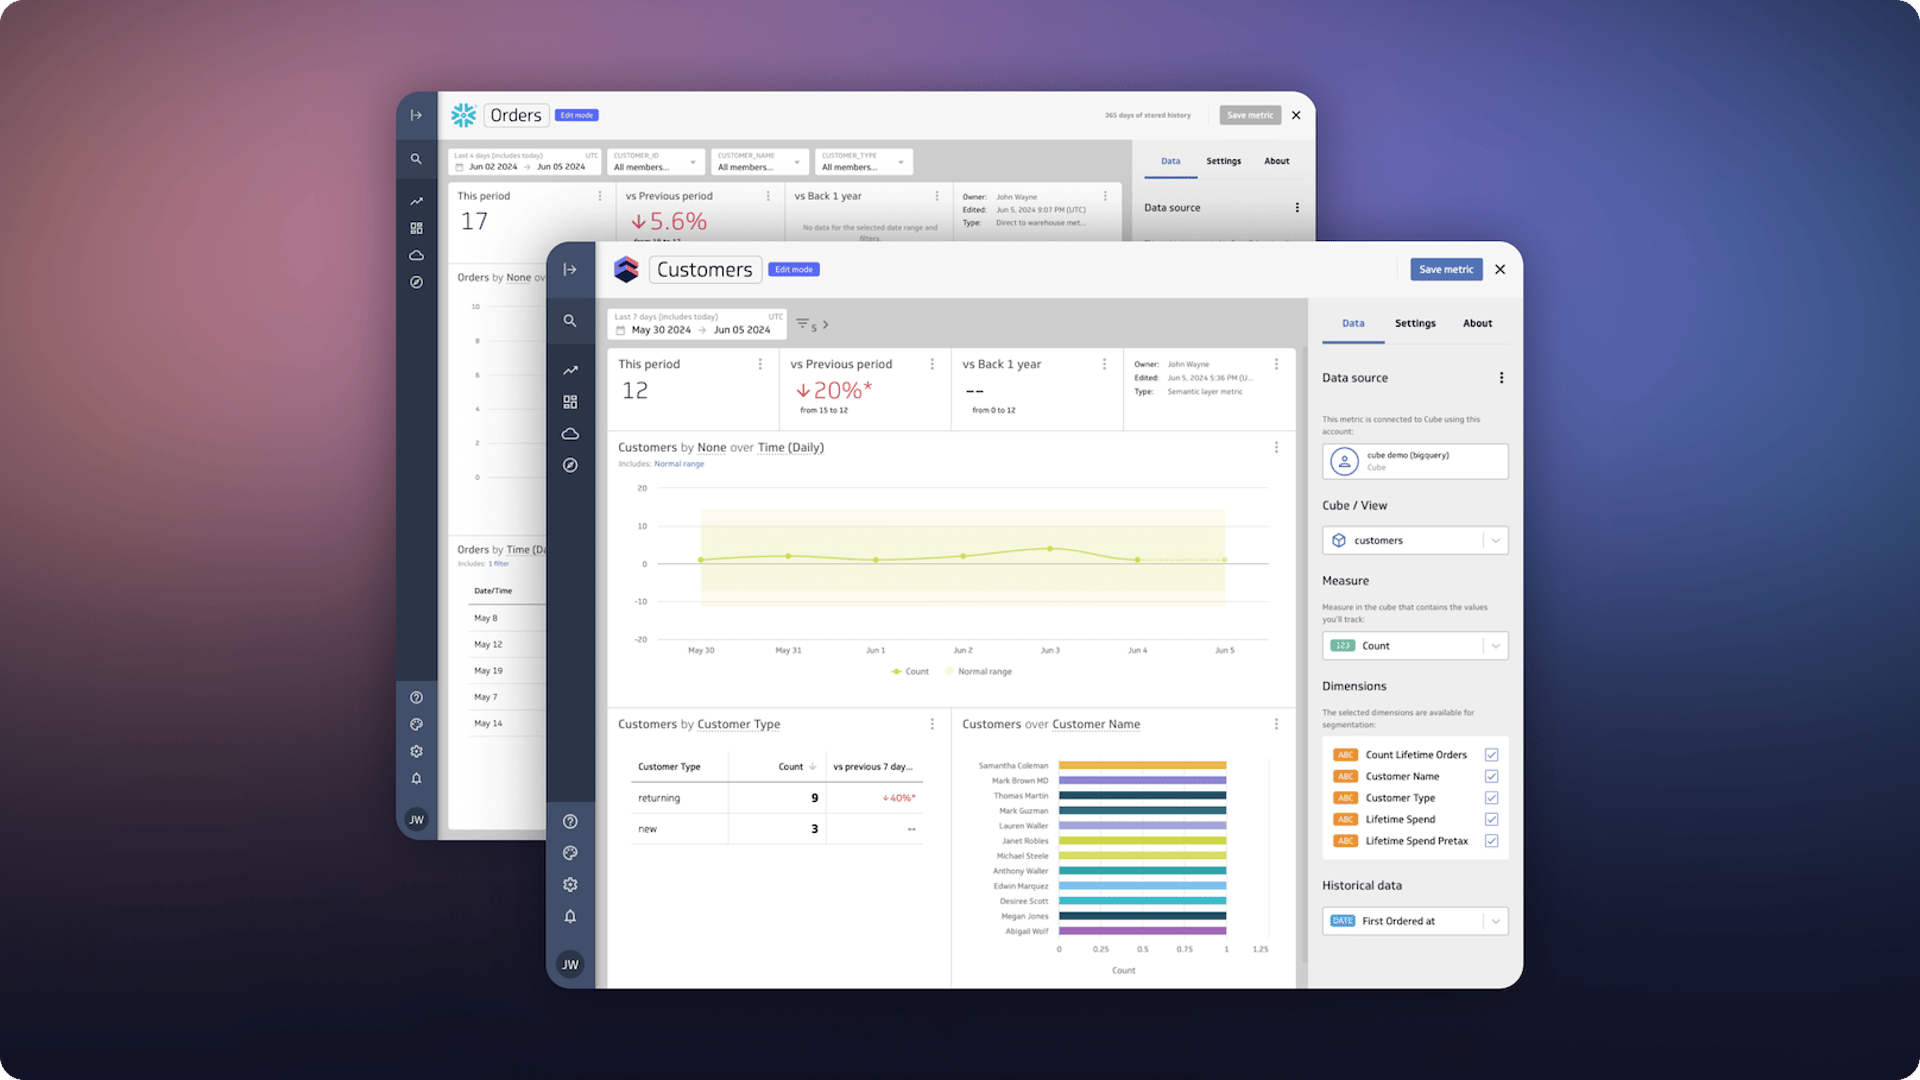
In PowerMetrics, you can set up a connection to access data from a data warehouse or from Cube with a valid environment id and token. After entering these credentials, you’ll be presented with a list of available tables, views, or cubes. Next, you select a measure, configure dimensions, and choose the date field to use for the metric. Additional properties, such as the value format, metric value trending up is positive/negative, etc. can also be set. When you’re happy with the settings, save the metric. It’s automatically added to your metric catalog.
Ensuring changes to data warehouse and Cube metrics are reflected in PowerMetrics
As data is added to a data warehouse table or a cube, changes to your metrics are reflected in PowerMetrics so everyone sees the latest version of the data. A webhook can be set up to notify PowerMetrics when there’s new data to consume, keeping metrics and metadata in sync.
Get started today
Connect today to your data warehouse or Cube, create and curate metrics, and enable self-serve analysis, visualization, and dashboard creation for your business users. These new integrations are available now. Let PowerMetrics help you streamline your analytics journey and ensure your metrics strategy remains adaptable and resilient. Try it for yourself and we look forward to your feedback!
To learn more, join us for a live webinar - Get Metrics-Ready with Your Existing Data Stack - on June 18th at 1 PM EDT / 10 AM PDT / 7 PM CEST. Learn from product experts at Klipfolio, Cube, dbt Labs, and Datateer as we dig into the new integrations. Register now!
Related Articles

Case Study: How Media Propulsion Laboratory improved client analytics with the PowerMetrics – BigQuery integration
By Cathrin Schneider — September 12th, 2024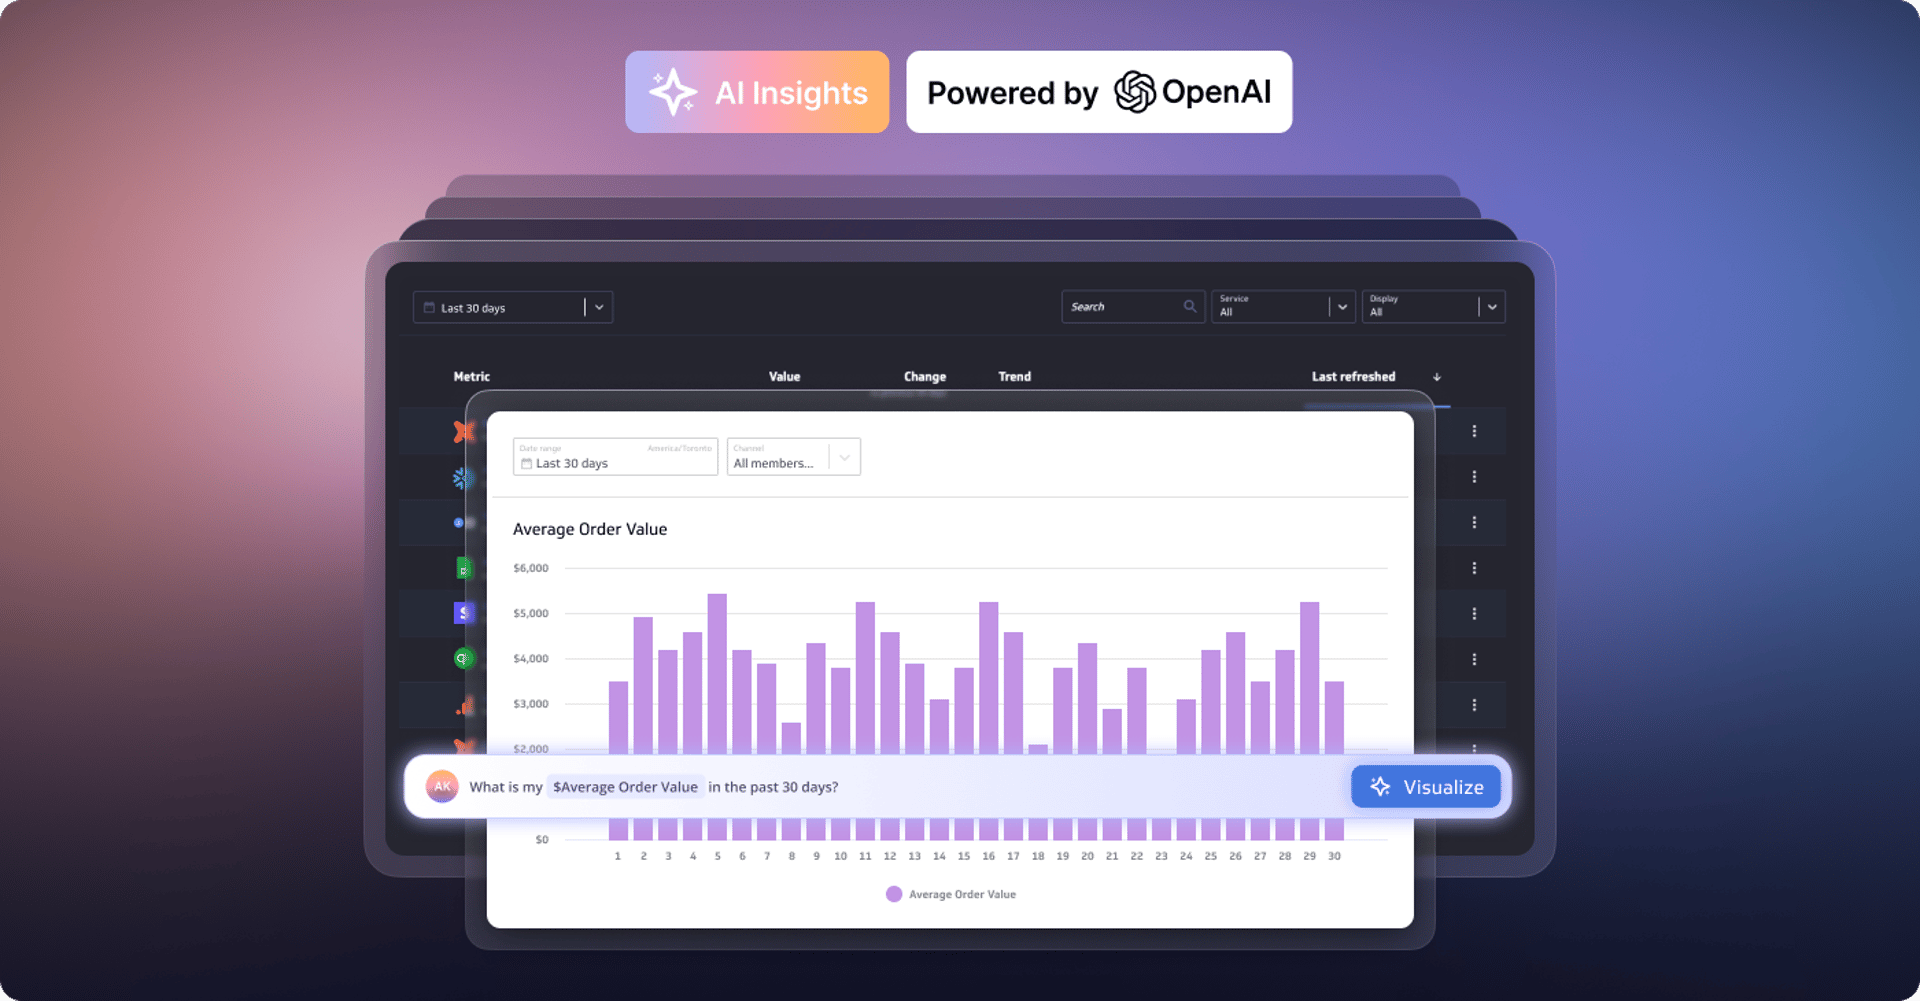
Metrics provide rich context for better AI: Introducing the new PowerMetrics AI experience
By David Mennie — June 21st, 2024
Partner Case Study: Eyeful
By Cathrin Schneider — May 21st, 2024