LinkedIn Pages
LinkedIn Pages is the professional networking platform where businesses build their brand, grow their audience, and share content. Connect LinkedIn Pages to Klipfolio to track follower growth, engagement, and page statistics in automated, real-time dashboards.
Tracking LinkedIn Pages data manually means constant exports, disconnected spreadsheets, and reporting that's always a step behind. Connect LinkedIn Pages to Klipfolio and your dashboard updates automatically, so you always have a current view of your page performance.
How to connect LinkedIn Pages to Klipfolio
LinkedIn Pages uses OAuth authentication. The setup takes about four steps.
- Open the data source wizard. In the left navigation sidebar, click the three-dot menu beside Data Sources and select + New data source. On the Where is your data? page, select LinkedIn Pages.
- Choose your connection type. Select a pre-built data source from the list, or click Create a custom LinkedIn Pages data source to write your own query.
- Authenticate your account. If this is your first time connecting, click Connect an account, enter your LinkedIn credentials, and click Allow Access. If you've connected before, select your existing connection from the drop-down and click Continue.
- Configure and save. Select your LinkedIn Company Page from the drop-down, click Get data, review the results, then name your data source, set a refresh schedule, and click Save.
Your data source appears in the Data Source Library and is ready to power your Klips.
View the step-by-step setup guide
Using a custom query
If the pre-built data sources don't return exactly what you need, switch to custom settings and modify the query URL directly. You'll need your LinkedIn Company ID — find it by navigating to your company page on LinkedIn and copying the number that appears after www.linkedin.com/company/ in the URL.
As of July 2023, LinkedIn Pages uses a versioned API that updates monthly. When building a custom query, confirm the Type field is set to Header. The Value is auto-filled but can be adjusted if needed.
Refer to the LinkedIn API documentation for available data requests
Top reasons to use Klipfolio for LinkedIn Pages dashboards
See your page performance in real time. Pull follower growth, engagement rates, and post reach into a live dashboard instead of waiting for weekly exports.
Combine LinkedIn with your other marketing channels. Blend LinkedIn Pages data with Google Analytics 4, Meta, and other sources to see how your social presence drives broader results.
Use pre-built data sources to get started fast. Pre-built connections surface the most commonly tracked LinkedIn metrics, including page statistics and follower trends, without any custom coding.
Share dashboards across your team. Distribute live dashboards by link, embed, scheduled PDF, or TV mode, so stakeholders always have access to current data without needing a Klipfolio login.
Refresh on your schedule. Set data refresh rates from one minute to 24 hours to match how often your team needs updated numbers.
What Klipfolio adds to your LinkedIn workflow
| What you do in LinkedIn Pages | What Klipfolio adds |
|---|---|
| Export page statistics manually as CSV | Automated dashboards that update on a set schedule |
| View follower data inside LinkedIn's native interface | Centralized reporting alongside all your other marketing channels |
| Screenshot or copy metrics into slide decks | Shareable, always-current dashboards distributed by link, email, or embed |
| Check individual post performance one at a time | Aggregated engagement metrics across your page in a single view |
Stop stitching together manual exports. Start tracking LinkedIn Pages performance the moment it changes.
Use pre-built LinkedIn Pages metrics
Assemble a LinkedIn Pages dashboard by selecting pre-built metrics from the Klip Gallery.
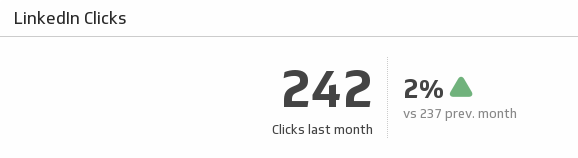
Clicks
Make sure your LinkedIn content continues to attract attention by comparing last month's page clicks with the previous month.
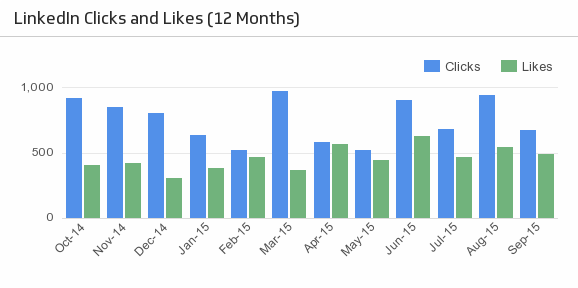
UsesClicks and Likes (12 Months)
See how your LinkedIn clicks and likes trend over time.
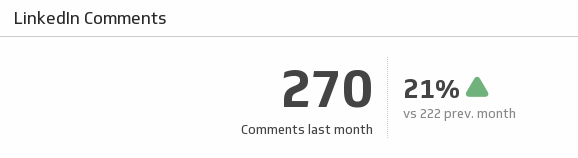
UsesComments
Keep your LinkedIn followers talking! Monitor your total comments last month and compare it to the previous month.
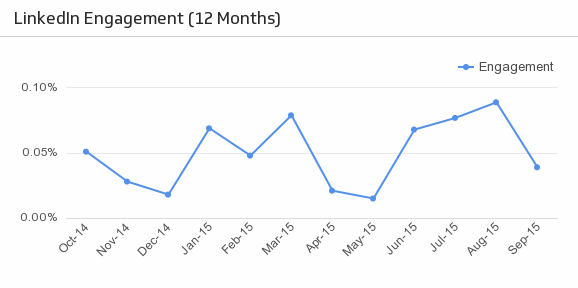
UsesEngagement (Last 12 Months)
Discover important trends in your LinkedIn page engagement over the past 12 months.
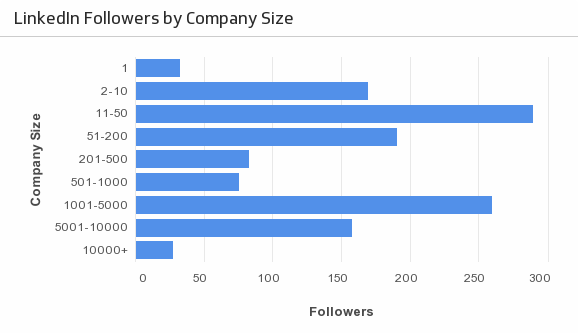
UsesFollowers by Company Size
Segment your LinkedIn followers by company size over the past 12 months.
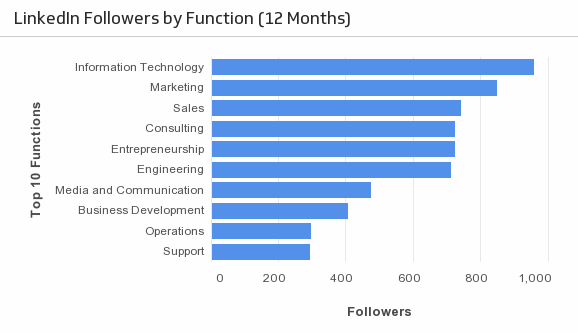
UsesFollowers by Function
See what role and function your LinkedIn followers have. (Past 12 months)
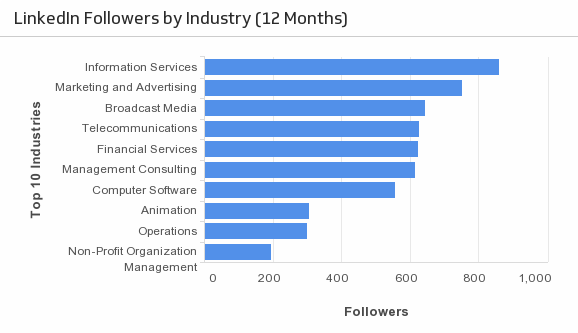
UsesFollowers by Industry
See what industries are dominant amongst your LinkedIn followers. (Past 12 months)
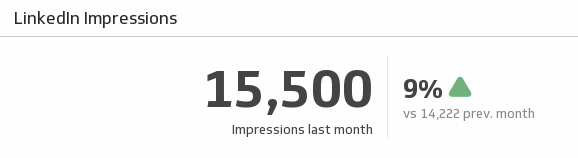
UsesImpressions
Track your LinkedIn page impressions for last month and understand how it compares to the previous month.
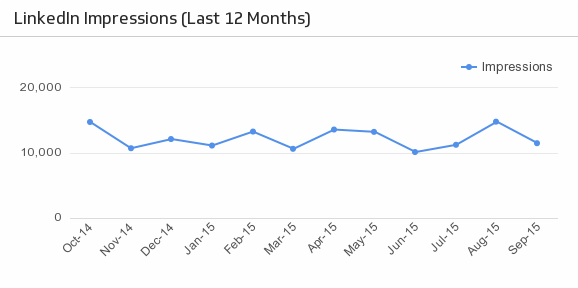
UsesImpressions (Last 12 Months)
Reveal how your LinkedIn impressions trend over time.
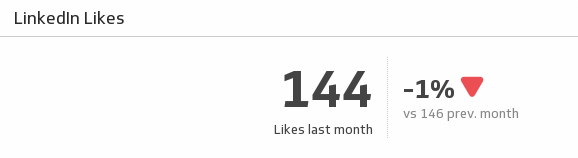
UsesLikes
Showcase the number of likes your LinkedIn page got at the end of last month and understand how it compares to the previous month.
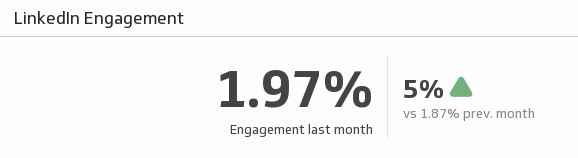
UsesLinkedIn Engagement
From comments to shares, Engagement measures how people react to your updates. See your LinkedIn page engagement for last month and see how it compares to the previous month.
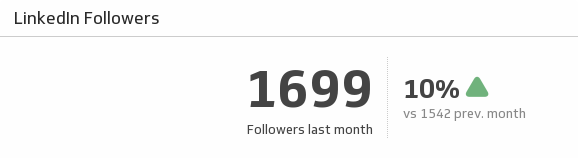
UsesLinkedIn Followers
See how many LinkedIn followers you had last month and compare it to the previous month.
UsesLinkedIn Key Metrics
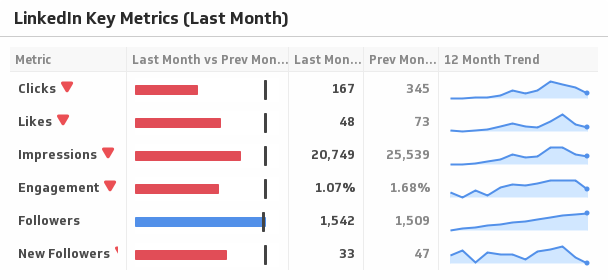
Use this sophisticated Klip to compare your key LinkedIn metrics last month to the previous month, and display the trends over time.
UsesNew Followers
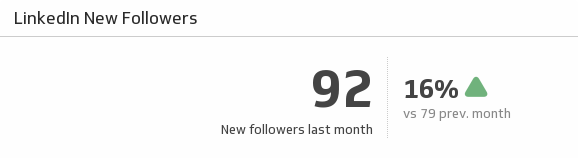
See how many new followers your LinkedIn page gained at the end of last month and understand how it compares to the previous month.
UsesShares
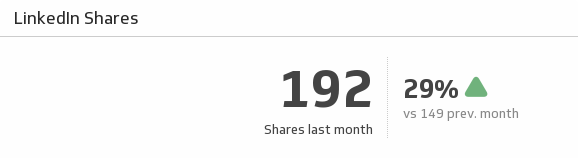
Determine your success in creating viral updates. See how many shares your page had at the end of last month and compare it to the previous month.
Uses