How you can use dashboards to report on key performance indicators (KPIs) and metrics
Building reports on your key performance indicators and metrics can be an excruciating task. There are so many sources of data – and so many reporting metrics companies are choosing to follow – that pulling together KPI reports is arduous and time-consuming.
It doesn’t have to be this way, though.
A Klipfolio dashboard gives you everything you need to get up and running with tracking your KPIs and metrics in real-time. Klipfolio allows you to quickly connect the data that matters most – while cutting out the statistical noise.
The importance of KPI and metric reporting
Data is cheap these days. It used to be that getting reliable, up-to-date numbers was an arduous process. Nowadays, a wealth of metrics are only a few clicks away.
Because the barrier to access is so low, many companies have now gone overboard with reporting, to the point where nearly everything that can be measured, is. What’s lost, though, is the focus on the data that really matters.
That’s where KPIs can make a world of difference.
What are key performance indicators?
Klipfolio defines a KPI as follows:
A KPI is a measurable value that demonstrates how effectively an organization is achieving key business objectives.
That’s a lot to unpack! What’s worth noting, for our purposes here, is that a KPI is a metric. But it’s not just any old metric. It’s a measurement of what is fundamental to the success of your business, department or organization.
Businesses need to resist the urge to track as many metrics as they have access to. It means that a lot of unnecessary numbers get thrown into the mix, creating confusion about what your organization is trying to achieve.
KPIs cut out all that noise and force you to focus on the metrics that really measure the success or failure of your business.
Why you should regularly report on KPIs
KPIs are great. But you can’t just set and forget them. You need to be constantly reporting on them so you can understand where you’re succeeding, where you’re not and how well your business is performing overall.
Reporting on KPIs:
- Increases accountability in your organization: Your KPIs can quickly get away from you if no one is checking in on how they are performing. The knowledge that you’re going to need to report on your performance is a great motivator for teams to do everything they can to make good on their goals.
- Communicates to the rest of the team how well you are performing: Those who regularly review their organizational metrics can sometimes overlook an often-forgotten fact: The rest of their team might not be as aware of how they are performing. Regularly reporting on KPIs lets your team know the areas that need improvement, which can in turn allow them to focus their energy on what will have the most impact.
- Allows you to modify and edit your KPIs: KPIs need constant revision. Some goals you will quickly find to be too aspirational and will need to be revised downward in the future. Others will have been too easy to achieve and will need to be revised upward. At other times you may find that the metrics you have chosen as KPIs simply don’t align with your strategic goals. In that case you’ll want to switch them out for ones that do.
At Klipfolio we recommend reporting to the rest of your team on a monthly basis. This is frequent enough to keep everyone informed, but not so frequent that you’re overwhelming the rest of your team with numbers.
But when it comes to the KPIs for which you are responsible, you’ll want to keep an eye on them more regularly. That way you’ll be able to identify any shortcomings and, most importantly, take any corrective action before it’s time to report to the rest of the team.
That’s where a dashboard from Klipfolio can help.
KPI reporting with a custom dashboard
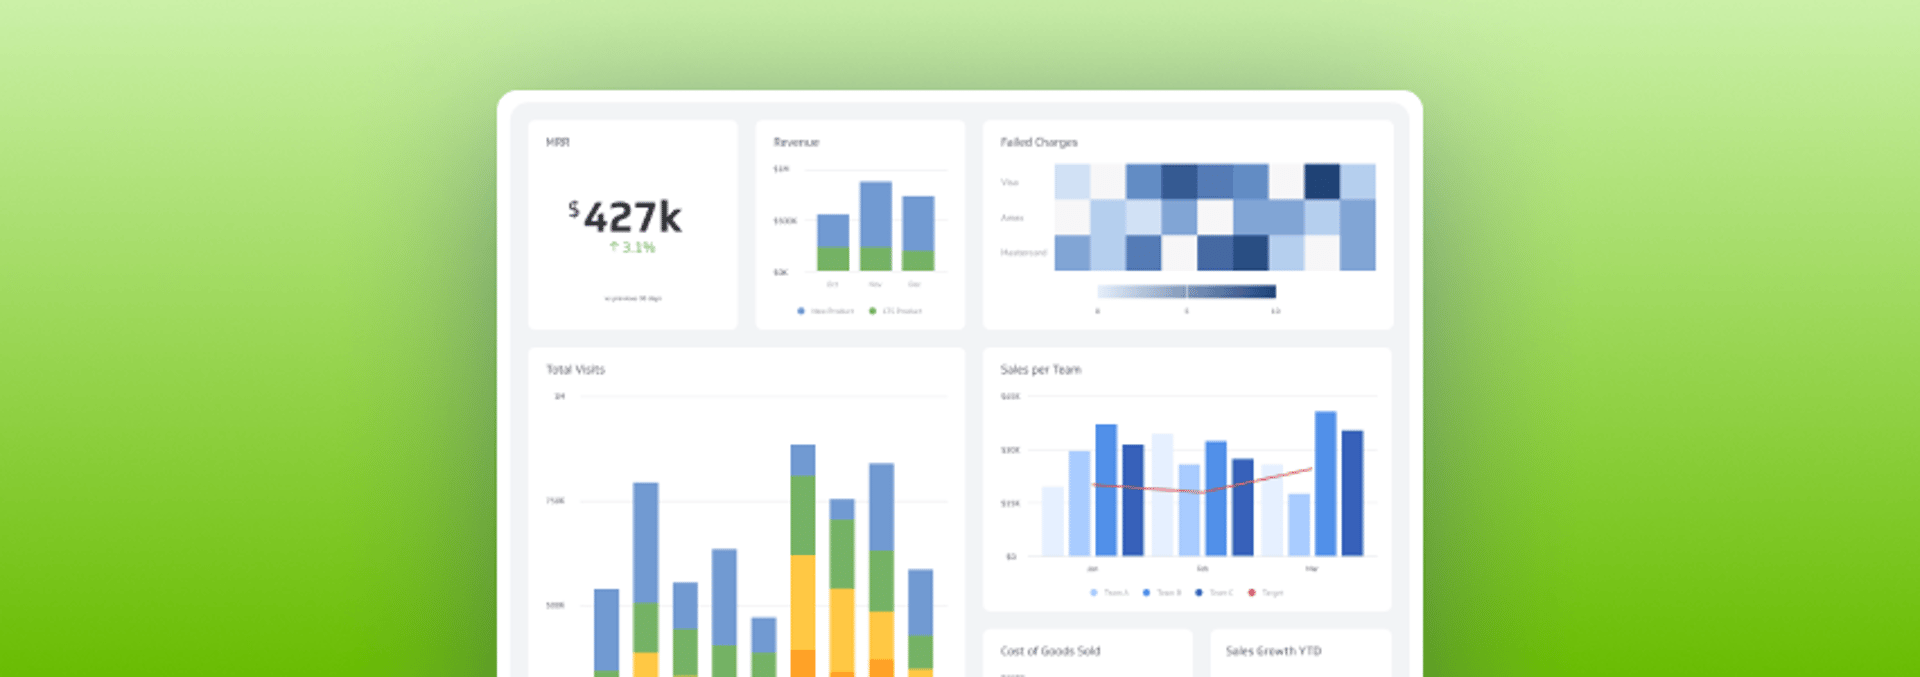
A data dashboard visually tracks, analyzes and displays key performance indicators (KPI). Behind the scenes, a dashboard connects to your files, attachments, services and API’s, but on the surface displays all this data in the form of tables, line charts, bar charts and gauges.
Custom dashboards are ideal for KPI reporting for a few reasons.
The barrier to entry for looking at results is low
Reporting on some metrics require only a little bit of expertise with the tool in question – say, looking at Twitter or Facebook followers. Others, such as Google Analytics, have a high barrier to entry that prevents just anyone from using it.
Either way, rooting around a variety of platforms to do reporting is time-consuming, either for a manager or any entry-level employee assigned with gathering data.
Dashboards save time and effort by allowing you to look only at your KPIs. No more spending hours searching around a variety of sources looking for your data. Just open up your dashboard and – boom – everything you need is in one place.
Everyone is looking at accurate data
It’s easy to make a mistake when it comes to reporting on your KPIs. One small error on a feature of the platform, such as the date range you’ve entered, and all of a sudden your results aren’t going to match reality.
Dashboards significantly reduce the likelihood that you’re reporting is inaccurate.
What’s more, dashboards allow you to give access to large numbers of people. That means everyone on the team can see how you are performing simply by logging into the platform.
No more feelings of confusion or disconnectedness when it comes to performance.
You can get updated in real-time
One of the disadvantages of traditional KPI reporting is that it’s nearly always backwards-looking. Compiling all the data on which you want to report can be time-consuming, particularly if your KPIs aren’t well-defined and you’re looking at a slew of different metrics that may or may not be connected to key business goals.
Dashboards, because they update in real-time, reduce the lag from results to reporting to nearly zero. Scheduling regular intervals where everyone can check in on results is still important, but real-time updates allow managers who are responsible for results to get regular updates on how they are performing in the interim.
That way there won’t be any more surprises when reporting time rolls around.
The Klipfolio Advantage
Klipfolio offers you everything you need to set up a KPI reporting dashboard, whether you’re a first-time dashboarder or old hand at KPI reporting.
Get up and running fast…
The real work of setting up a KPI dashboard should be defining what you want your KPIs to be and then designing what you want the dashboard to look like.
Actually pulling in the data and getting the dashboard up and running? That’s where Klipfolio has a huge role to play. We make pulling the data you need into your dashboard simple.
Say you’re looking to measure your Twitter followers as a KPI. All you need to do is head on over to the Klip Gallery, select the Klip for Twitter followers and connect your data. Boom! You’re tracking your KPI.
As for actually designing your dashboard, we’ve got you covered there as well. The Dashboard Gallery is your one-stop shop for pre-built dashboards. Just click the “Get This Dashboard+” button” and you’re good to go.
...then customize where you need to
Klipfolio understands that your KPIs are unique to you and your business. If they weren’t, there wouldn’t be anything to separate you from the competition (and that just doesn’t make any sense).
We give you all the tools you need to set up a dashboard that’s customized for you. You can build a custom dashboard using the Integration Gallery then head on over to the Dashboard Journey Guide to learn the ins and outs of the Klipfolio tool.
You can present your data in a way that makes sense
How often have you been handed a report with reams and reams and data but don’t retain a single thing from it?
Maybe the metrics that were chosen didn’t really reflect underlying business objectives. Maybe the data is presented in a format that isn’t compelling or is too hard to understand. Maybe there are simply too many metrics to realistically stay on top of them all.
With Klipfolio it’s easy to present your data in a way that makes people want to pay attention. Simply plug in your data and then use a variety of templates for presenting the information in the form of tables, line charts, bar charts and gauges.
Put your user at the centre of dashboard design
At Klipfolio we understand that the person who’s using the dashboard should be the most important factor in its design. Fancy features and compelling graphs and spot-on KPIs are great. But if no one cares enough to pay attention to your dashboard, then it’s failing to achieve its goal.
Different people in your organization will have different needs from a dashboard. For example: Managers will want to look at KPIs through an operational lens, while an executive will want more of a reporting dashboard.
We give you what you need to design a dashboard that fits your needs.
Different publication formats
Your dashboard doesn’t just need to live on an internet browser. With Klipfolio you can deploy your KPI reporting in a variety of different ways.
- Email reporting capabilities
- Integration with chat tools like Slack
- Television displays
KPIs are an essential tool for measuring the health of your business. But those KPIs will fail your organization if they’re not presented in a way that compels employees to take action on them.
Klipfolio is the essential tool you need to start measuring your performance against your KPIs in a way that makes sense to the most important people around: Your employees.