All your sales metrics and KPIs in one BI reporting tool
The control you want, the sales data you need.
Track your sales KPIs in minutes
Sign up for free and start making decisions for your business with confidence.
From our sales team to yours
We know how important it is to have control of your data, which is why we put together this quick video to show you what dashboards we use on a daily basis to help drive our own sales efforts. Watch the video and see what’s possible in Klipfolio.
Sales dashboard examples
Curious to see what sales data you can track in Klipfolio? View these live dashboard examples to get a better look.

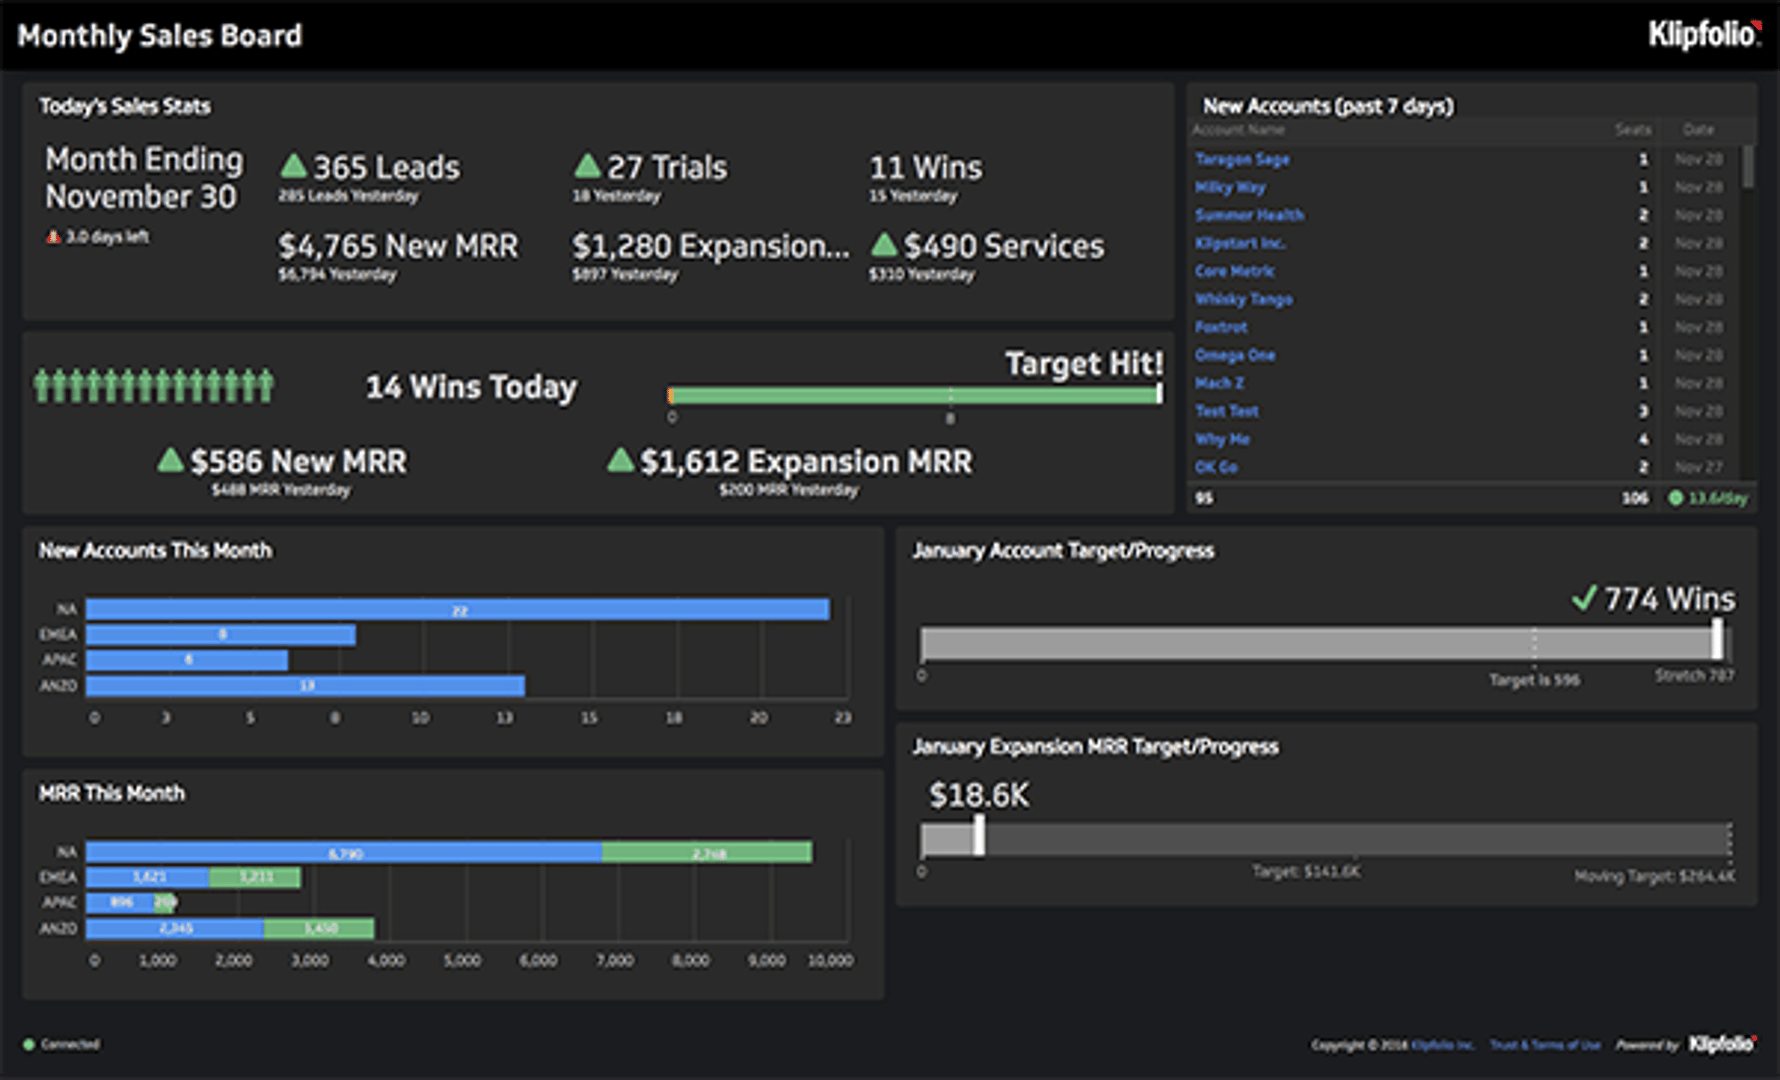
Monthly Sales Dashboard
- Get a real time, interactive view of your sales performance
- Track your sales against daily and monthly targets to reach your goals
- Stay on top of key sales metrics like MRR and Expansion rates
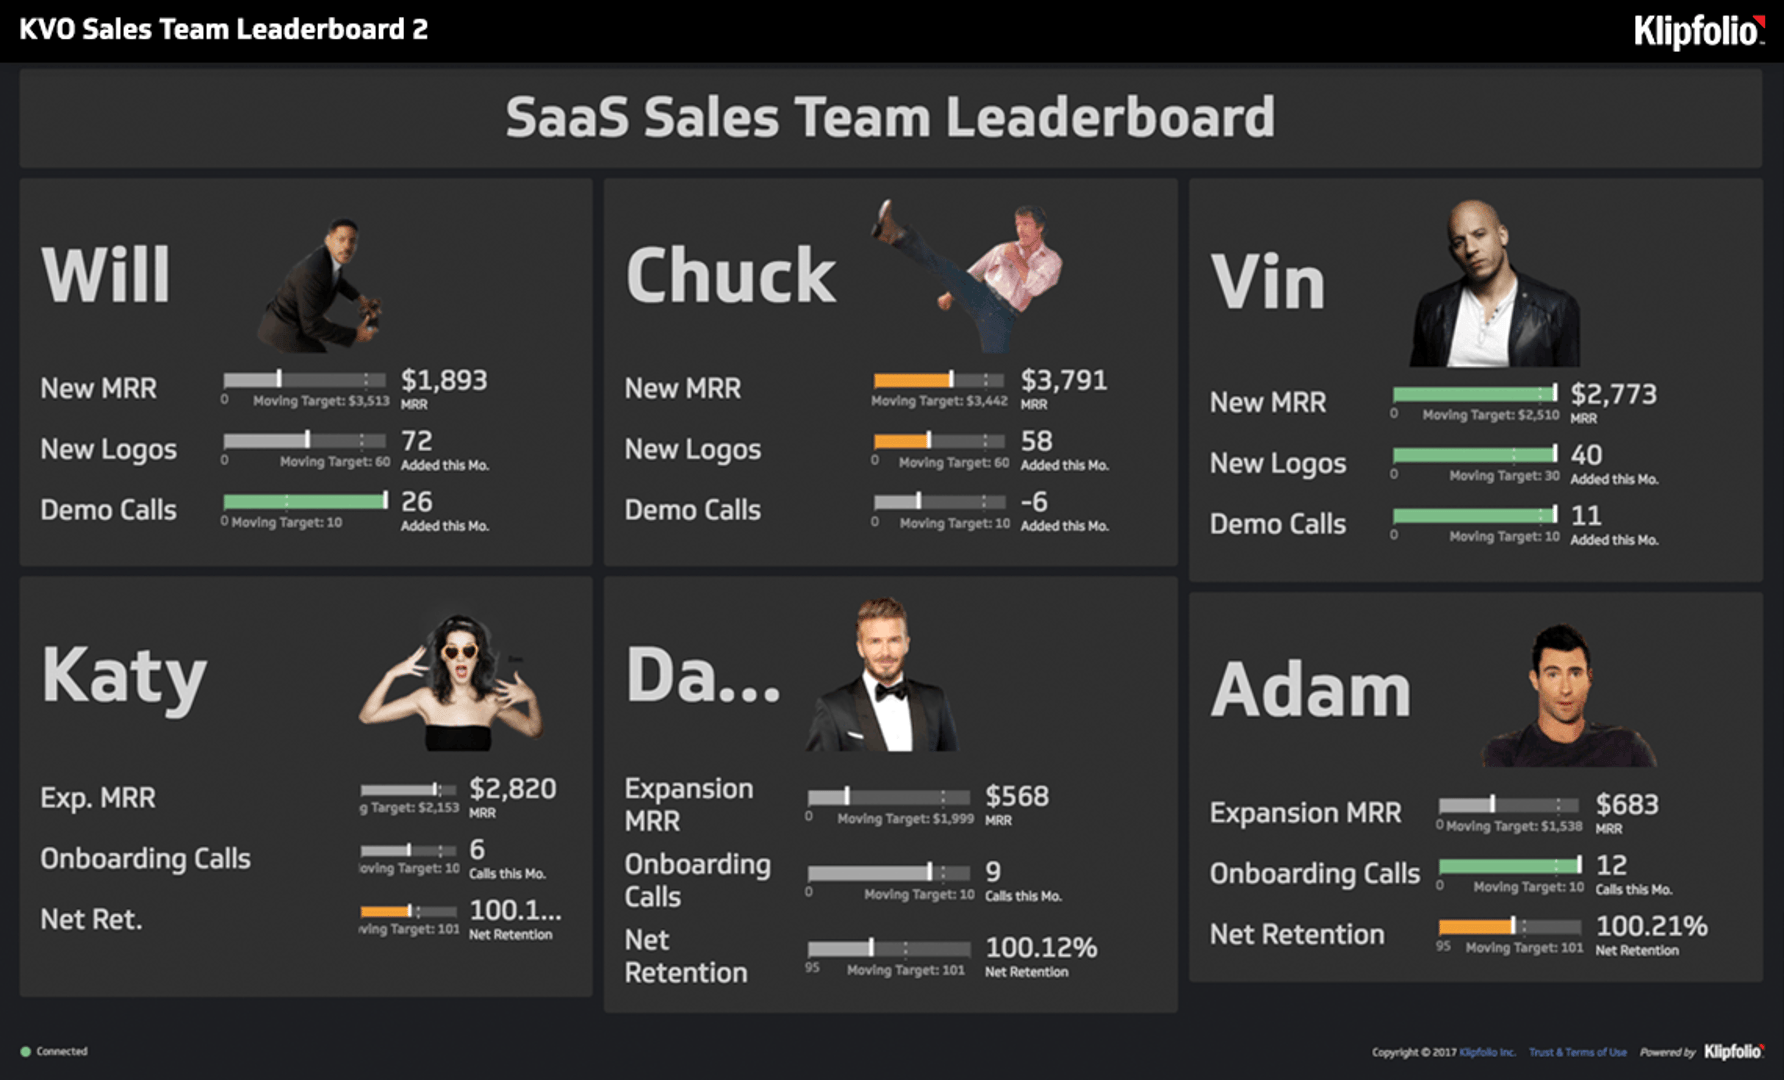
Sales Team Leaderboard
- Motivate your sales team with a real-time leaderboard
- Track new MRR, new logos, and demo calls
- Create an open culture and competitive nature to drive up sales
Metrics for Sales Professionals and Teams
Want to motivate your team and stay up to date on your data, but not sure which metrics to start with? Not to worry, we've compiled a list of the top, most common sales KPIs (key performance indicators) our users have built using Klipfolio. If you are looking for more, check out our KPI Library:
- Sales Target: Measure and compare current sales to a target or past performance
- Sales Opportunities: Organize prospects based on opportunity value and probability
- Conversion Rate: Measure of the effectiveness of your sales team at converting leads into new customers
- Sales-to-Date: Monitor and measure the total value of sales that have occurred over-time
- Sale per Rep: Measure the performance of each of your sales reps or sales teams
- Product Performance: Track and rank your products based on sales revenue performance
- Sales by Region: Zero in on the volume of sales by location
- Average Purchase Value: Measure the average sales value of each transaction
- Customer Acquisition Cost: Measure how much it costs to obtain a new customer
- Customer Lifetime Value (CLV or LTV): Measure the amount of money a customer brings in over the entire time they do business with a company
- Trial Accounts: Track the number of open trial accounta
- Gross Margin Return on Investment (GMROI): Measure the total revenue gained after covering the investment of making the sale
- Sales Cycle Duration: Monitor the length of time between the initation of the sales process to the final sale
- Unit Sales to Avg Market Sales: Compare the total share of the market your company holds campared to the market average
- Potential Revenue in Pipeline Measure the potential revenue that could be gained with the volume in the sales funnel
- Lead-to-Win Ratio Track how many leads turn into customers
- Product-Line Profitability: Measure the total profit gained from a specific product line
- Time to Break Even: Measure the time between product-launch and when it will start making profit
- Sales Quota Attainment: Track progression towards hitting sales targets
- Sales by Division/Team: Measure the total sales revenue gained by each division, team, individual
- Sales Growth: Analyze the growth of your sales
Build a custom sales dashboard
Once you've assembled a few dashboards with our pre-built metrics, you're going to want to build custom dashboards from the ground up, with data flowing through the CRM or sales automation platform of your choice.
There’s a learning curve with any powerful software tool, but you’re in good hands and will soon be building out your own custom dashboards. We promise it'll be worth it.
Learn more about connecting your data with Klipfolio.
How to build your custom sales dashboard:
- Draw your dashboard on a napkin
- Decide which data sources you'll need to access in order to create your dashboard
- Use the custom editor to start bringing your data to life
- Adjust targets, indicators, data visualizations and dashboard layouts to suit your sales process, pipeline and culture
- Show current performance metrics against results for similar time periods in the past (Today vs. Yesterday, This Week vs. Last Week, etc.)
- Share dashboards among your sales team, or across the organization if you so choose, via wall-mounted TVs
Use a TV Dashboard display to share your dashboards
A TV Dashboard is a monitor setup to display key business metrics in real-time. TV Dashboards have evolved over the years from office whiteboards to office monitors that continuously display a business’ data.
There are a number of benefits to setting up a TV dashboard in your office such as transparency on all levels of the business, metrics-driven teams that can spot opportunity and fix discrepancies, as well as the ability for managers and executives to make real-time business decisions.
What’s the best way to display a TV Dashboard?
Dashboards can be displayed on TV horizontally or vertically. Vertical TV dashboard display is ideal for longer dashboards, typically ones that have more than 5 or 6 metrics. Due to the fact that TV dashboards are meant for quick, at-a-glance information, it’s best practice to limit your dashboard being horizontally displayed to a few of your most important metrics that you need to monitor multiple times a day in order to keep size large for optimal visibility
For more on TV dashboard options, check out our TV dashboard article.
