
Solutions
Dashboard software for executives who want to continuously monitor the health of their business.
The control you want, the data you need.
From our executive team to yours
We understand the importance of data-driven decision-making. Discover how Klipfolio can provide you with actionable insights, uncover trends, and drive strategic growth through customizable dashboards.
Live executives dashboards
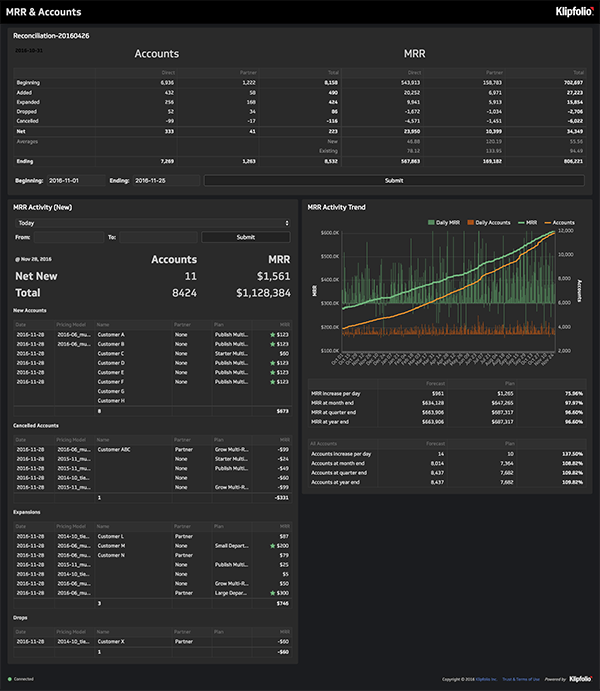
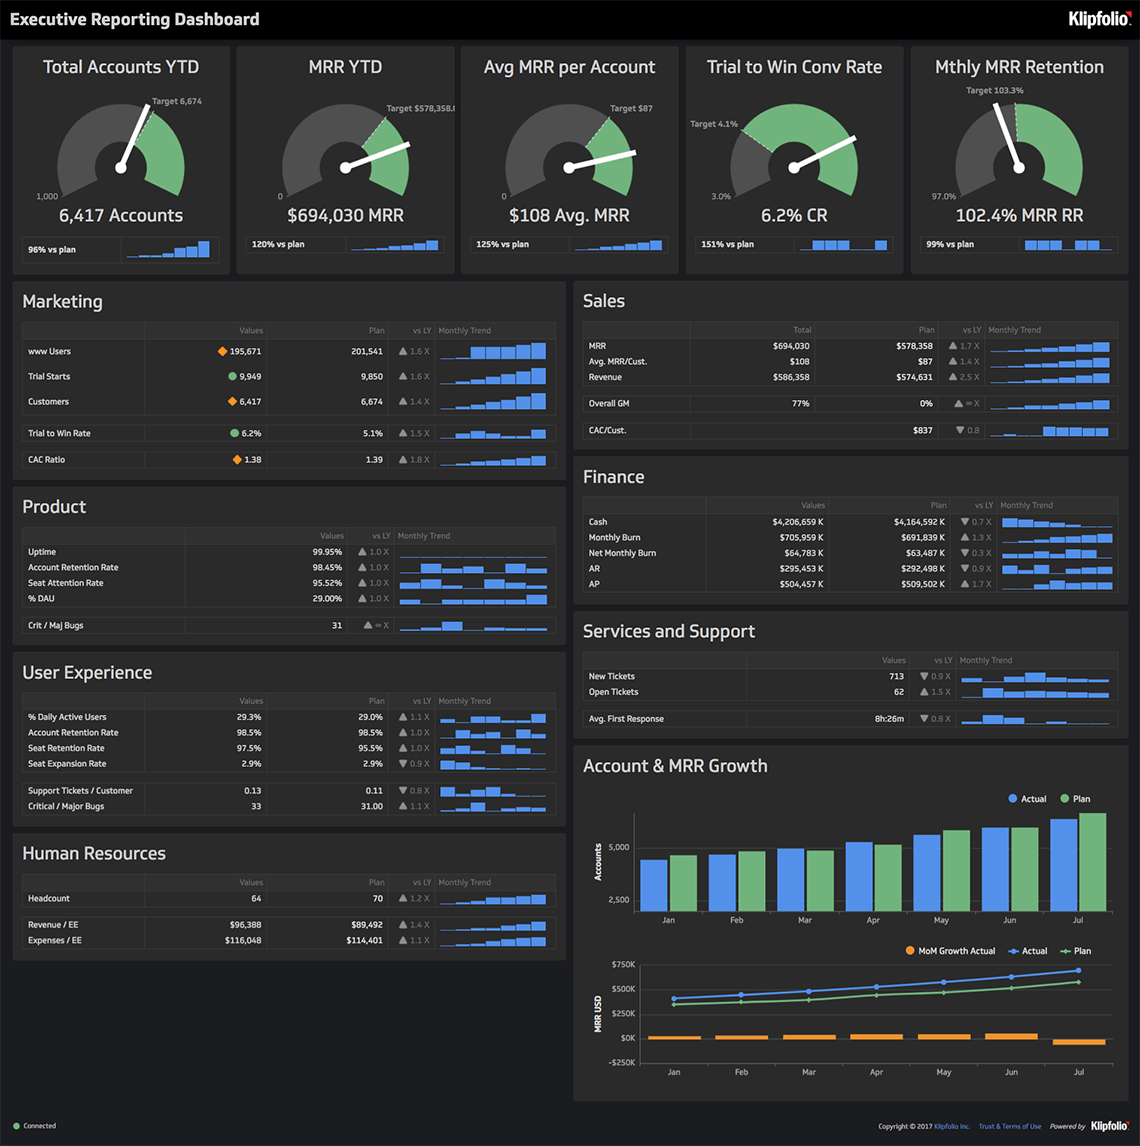
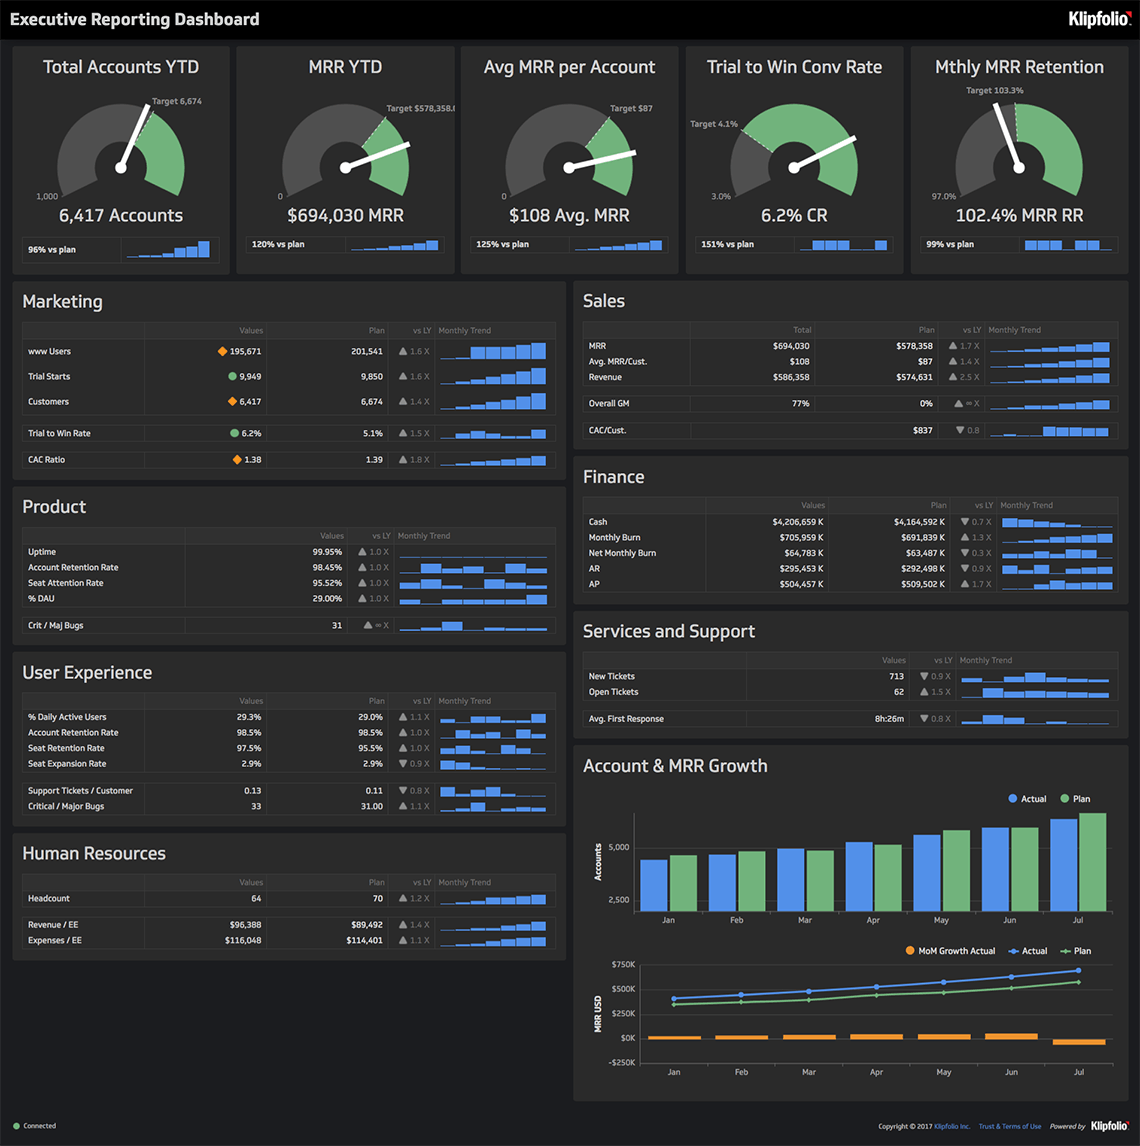
Metrics for Executives and C-Suites
Holding a top-tier position in a company is hard work - not only do you have to manage your employees, investor expectations, and overall business direction, but you also have to monitor, measure, and analyze all the company data coming your way. It can be incredibly difficult to keep an eye on all these assets while still keeping your head afloat.
Luckily, dashboards and KPIs are here to help you out. Rather than forcing you to dive into all your data platforms, bases, and warehouses, metric visualizations bring your data to the surface, eliminating the time you would spend in the thick of it all searching for a single peice of information.
To save you even more time, here are a few of the top, most common executive-level KPIs (key performance indicators) our uses have built using Klipfolio. If you are looking for more, check out our KPI Library:
- Account & MRR Growth
- Avereage MRR per Account
- Trial to Win Conversion Rate
- Revenue YTD
- Market Share
- Monthly Burn Rate
- Product Uptime
- Expenses per Employee
- Trial Starts this Week/Month/Quarter
- Sales Target
- Return On Assets (ROA)
- Return on Equity (ROE)
- Quick Ratio/Current Ratio
- Price/Earnings Ratio (P/E)
- Working Capital
- Debt-to-Equity
- Operating Profit Margin
- Net Profit Margin
- Top Products/Services in Revenue
- Customer Lifetime Value (CLV or LTV)
Popular integrations
Klipfolio for SaaS Executives
Are you in charge of scaling your startup to the next level? We’ve got you covered.
Use a TV Dashboard display to share your dashboards
A TV Dashboard is a monitor setup to display key business metrics in real-time. TV Dashboards have evolved over the years from office whiteboards to office monitors that continuously display a business’ data.
There are a number of benefits to setting up a TV dashboard in your office such as transparency on all levels of the business, metrics-driven teams that can spot opportunity and fix discrepancies, as well as the ability for managers and executives to make real-time business decisions.
What’s the best way to display a TV Dashboard?
Dashboards can be displayed on TV horizontally or vertically. Vertical TV dashboard display is ideal for longer dashboards, typically ones that have more than 5 or 6 metrics. Due to the fact that TV dashboards are meant for quick, at-a-glance information, it’s best practice to limit your dashboard being horizontally displayed to a few of your most important metrics that you need to monitor multiple times a day in order to keep size large for optimal visibility.