Google Analytics 4
Connect Google Analytics 4 directly to Klipfolio and build live dashboards that update automatically. Replace manual exports with cross-channel reporting, custom visualizations, and flexible distribution.
Track all your Google Analytics 4 KPIs in one place
Sign up for free and start making decisions for your business with confidence.


Custom Google Analytics 4 dashboards
Stop copying data out of Google Analytics manually. Klipfolio connects directly to Google Analytics 4 so your dashboards update automatically, giving your team a live view of the metrics that matter.
How to build a Google Analytics 4 dashboard
Connect your data: Use the Klipfolio Google Analytics 4 connector to authenticate your account and pull in your GA4 properties. Follow the step-by-step setup guide to get connected in minutes.
Query your data: Use the Google Analytics Query Explorer to select the dimensions and metrics you want, such as sessions, conversions, traffic sources, or user paths.
Build your Klips: Choose from 30+ visualization types to display your GA4 data. Apply Excel-like formulas to model and transform your data directly in Klipfolio.
Combine your sources: Layer in data from Facebook Ads, HubSpot, Google Ads, and 100+ other connectors to build cross-channel dashboards that show the full picture.
View the step-by-step setup guide
Top reasons to use Klipfolio for Google Analytics 4 dashboards
Automated data refresh: Your GA4 data updates on a schedule — no manual exports, no stale numbers.
Cross-channel reporting: Combine GA4 with your CRM, ad platforms, and other marketing tools in a single dashboard.
Custom visualizations: Build dashboards tailored to your audience, from executive summaries to granular campaign breakdowns.
Flexible distribution: Share dashboards via public links, embedded views, scheduled PDF reports, or on a TV in your office.
Granular access control: Set roles and permissions so each team member sees exactly what they need.
From manual exports to live dashboards
If you're used to downloading GA4 reports and pasting data into spreadsheets, Klipfolio replaces that workflow entirely.
| What you do in GA4 | What Klipfolio adds |
|---|---|
| Export CSV reports manually | Automatic, scheduled data sync |
| Merge spreadsheets across channels | Combine 100+ connectors in one dashboard |
| Email report attachments | Live links, embeds, or scheduled PDFs |
| Re-export data every time it changes | Refreshes as often as every minute |
Stop manual exports. Start automating your GA4 reporting.
Build your first Google Analytics 4 dashboard and get your team working from the same live data. Start your free trial — no credit card required.
Use pre-built Google Analytics 4 metrics
Assemble a Google Analytics 4 dashboard by selecting pre-built metrics from the Klip Gallery.
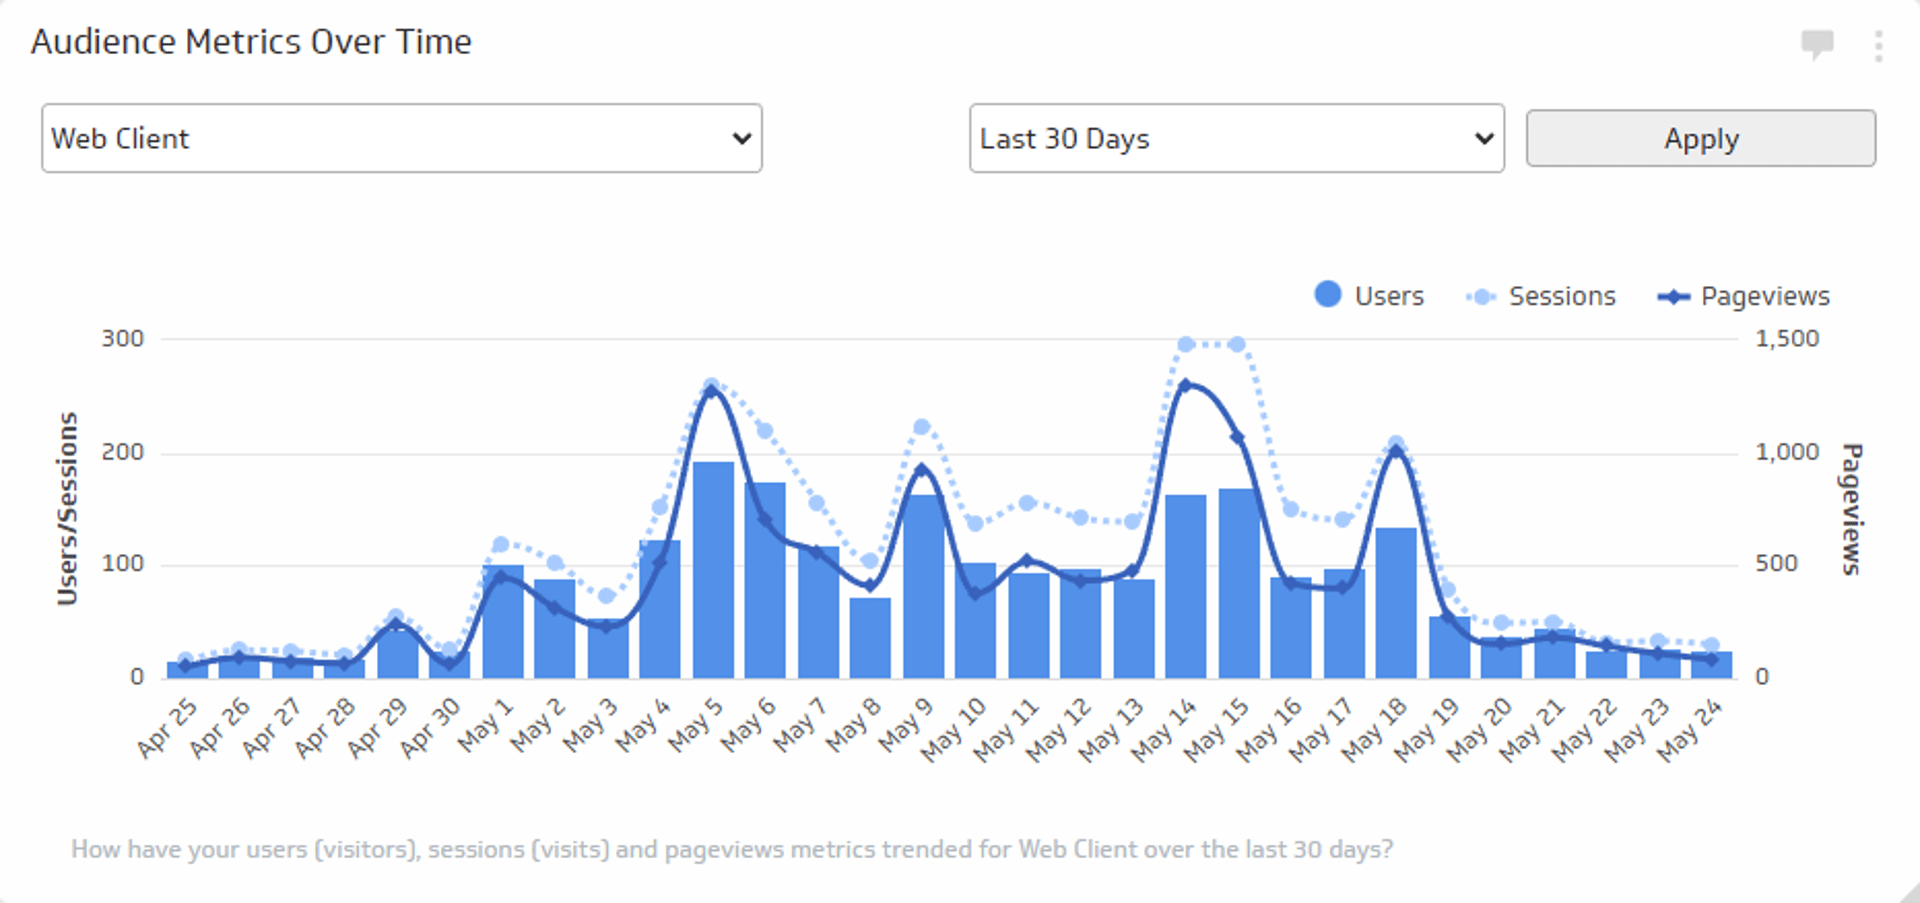
Audience Metrics Over Time
Track the total number of users, sessions, and views trend over time.
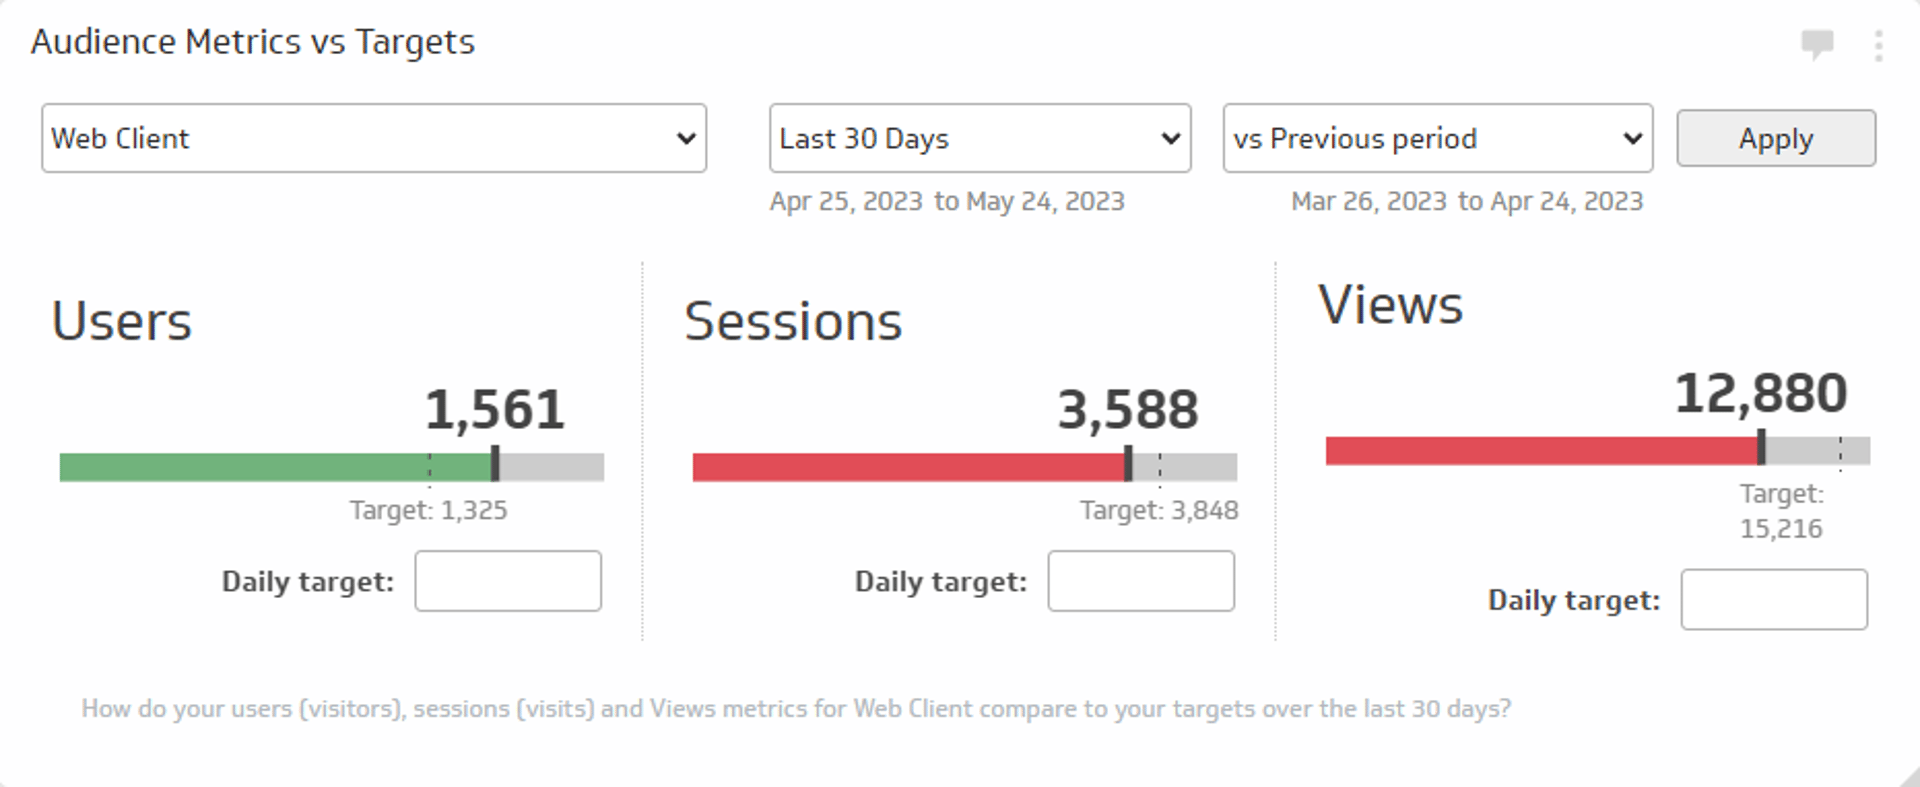
Audience Metrics vs. Targets
Track the total number of users, sessions, and views for a specific time period and compare those values to daily targets or to a previous period.
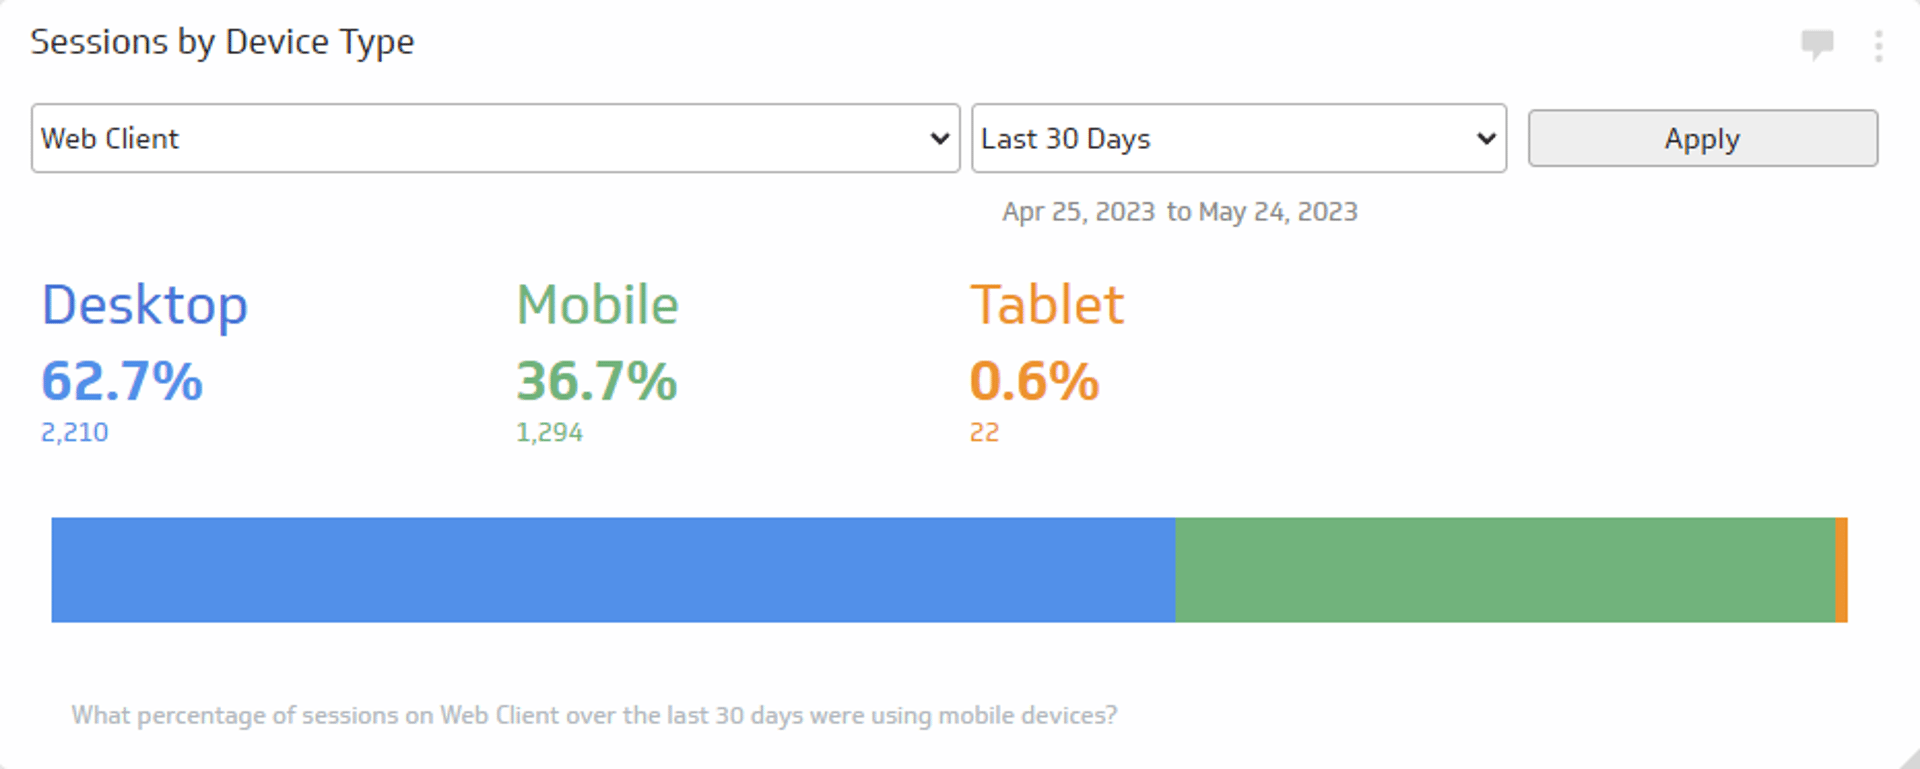
Sessions by Device Type
See what devices your website traffic is using for the time period of your choice.
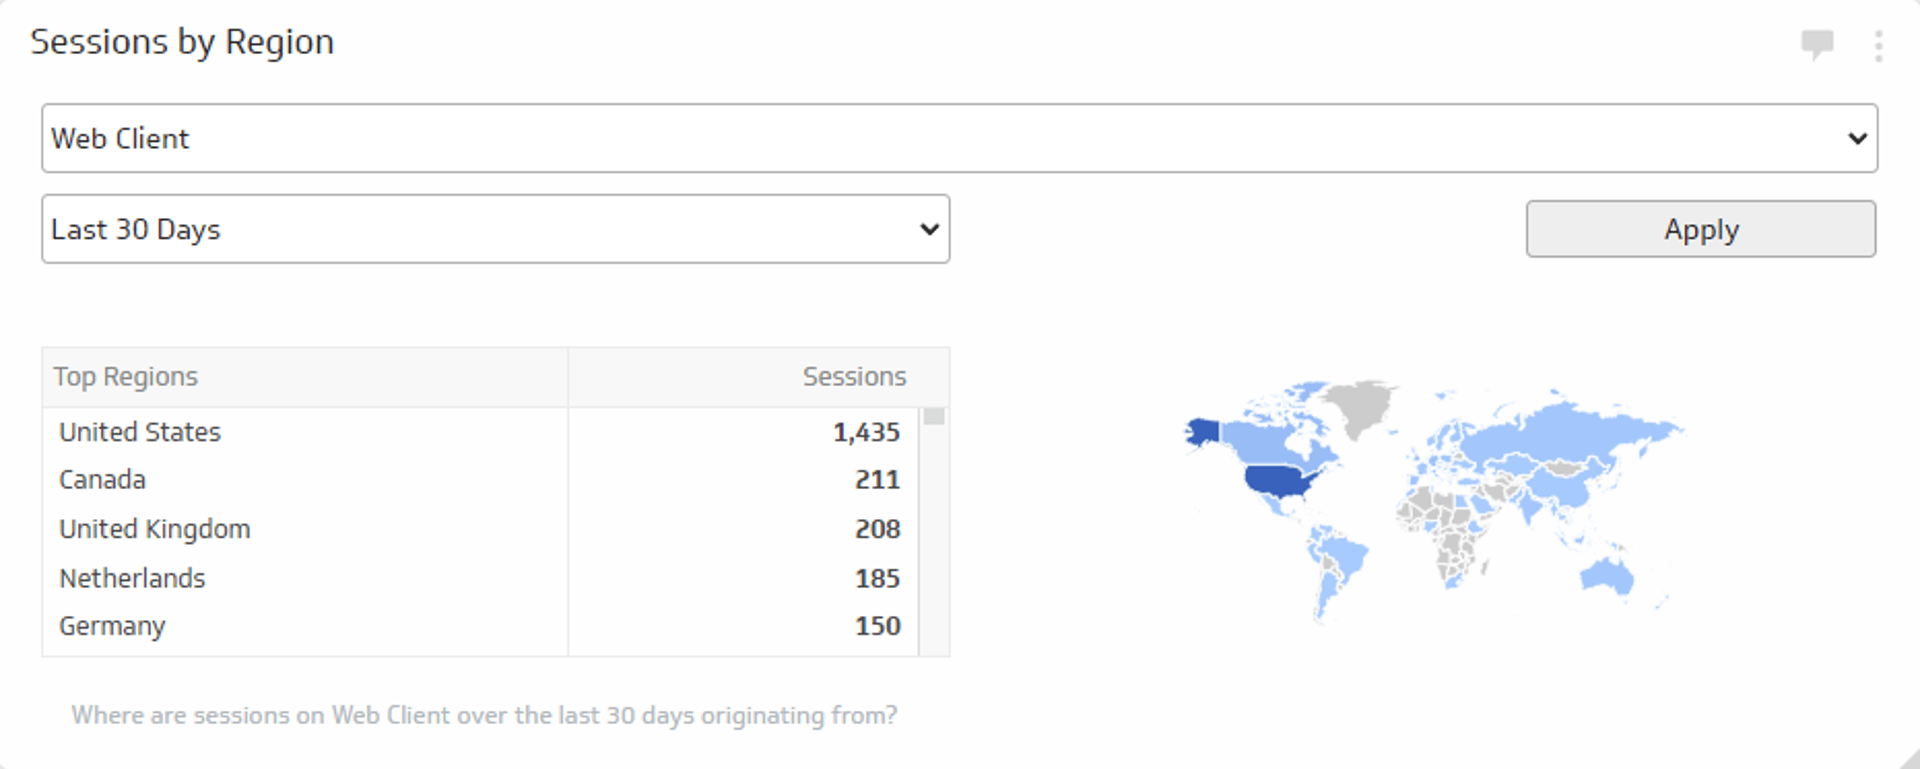
Sessions by Region
Track where around the world your website sessions are coming from during the time period of your choice.
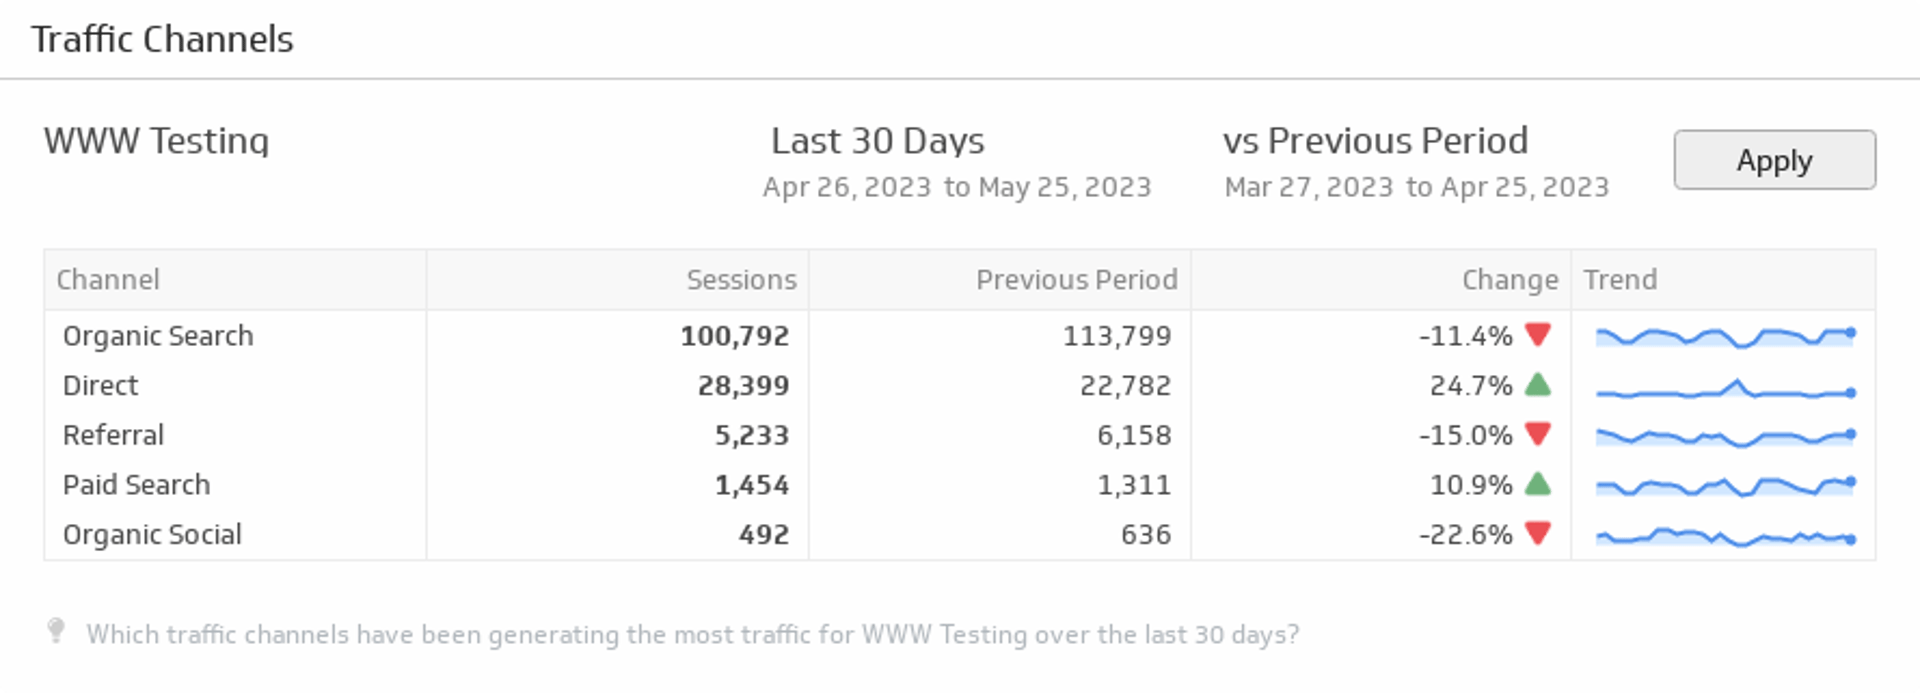
Traffic Channels
Displays the top online channels generating traffic to your website during the time period of your choice.
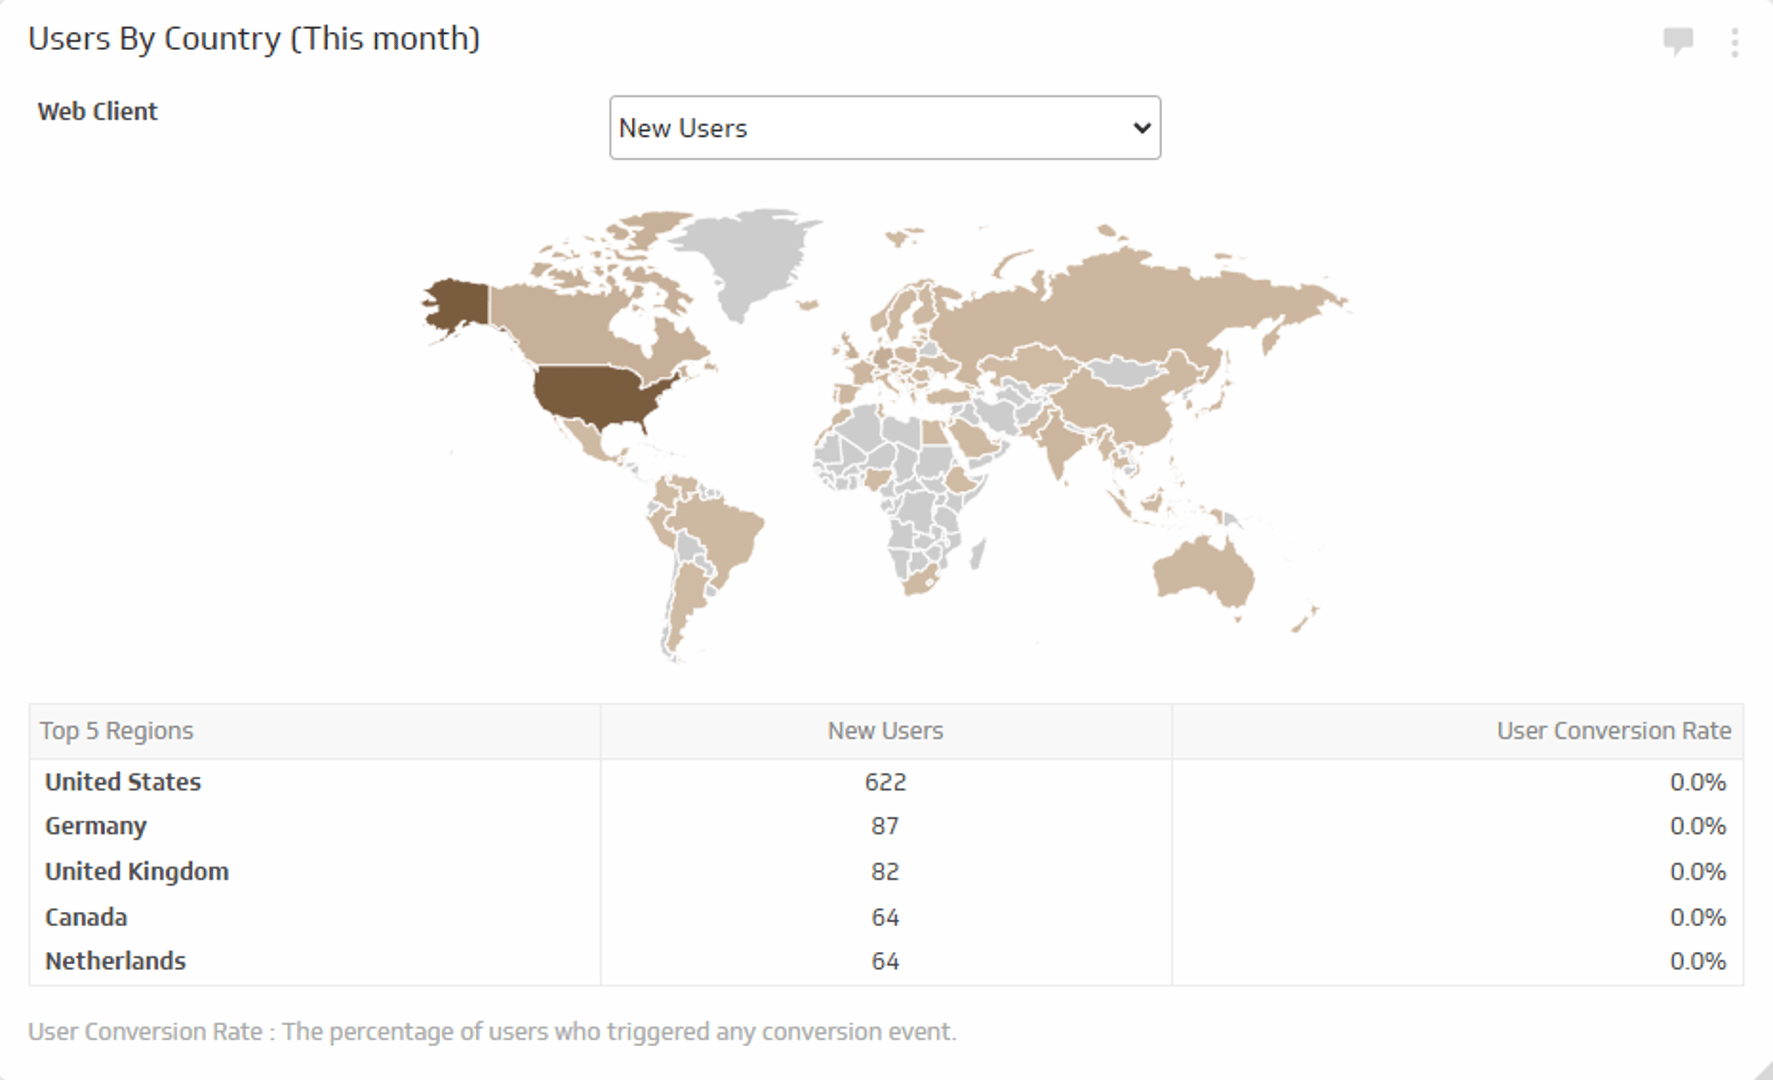
Users by Country - This Month
Track the number of new users and total users and their conversion rate for this month.
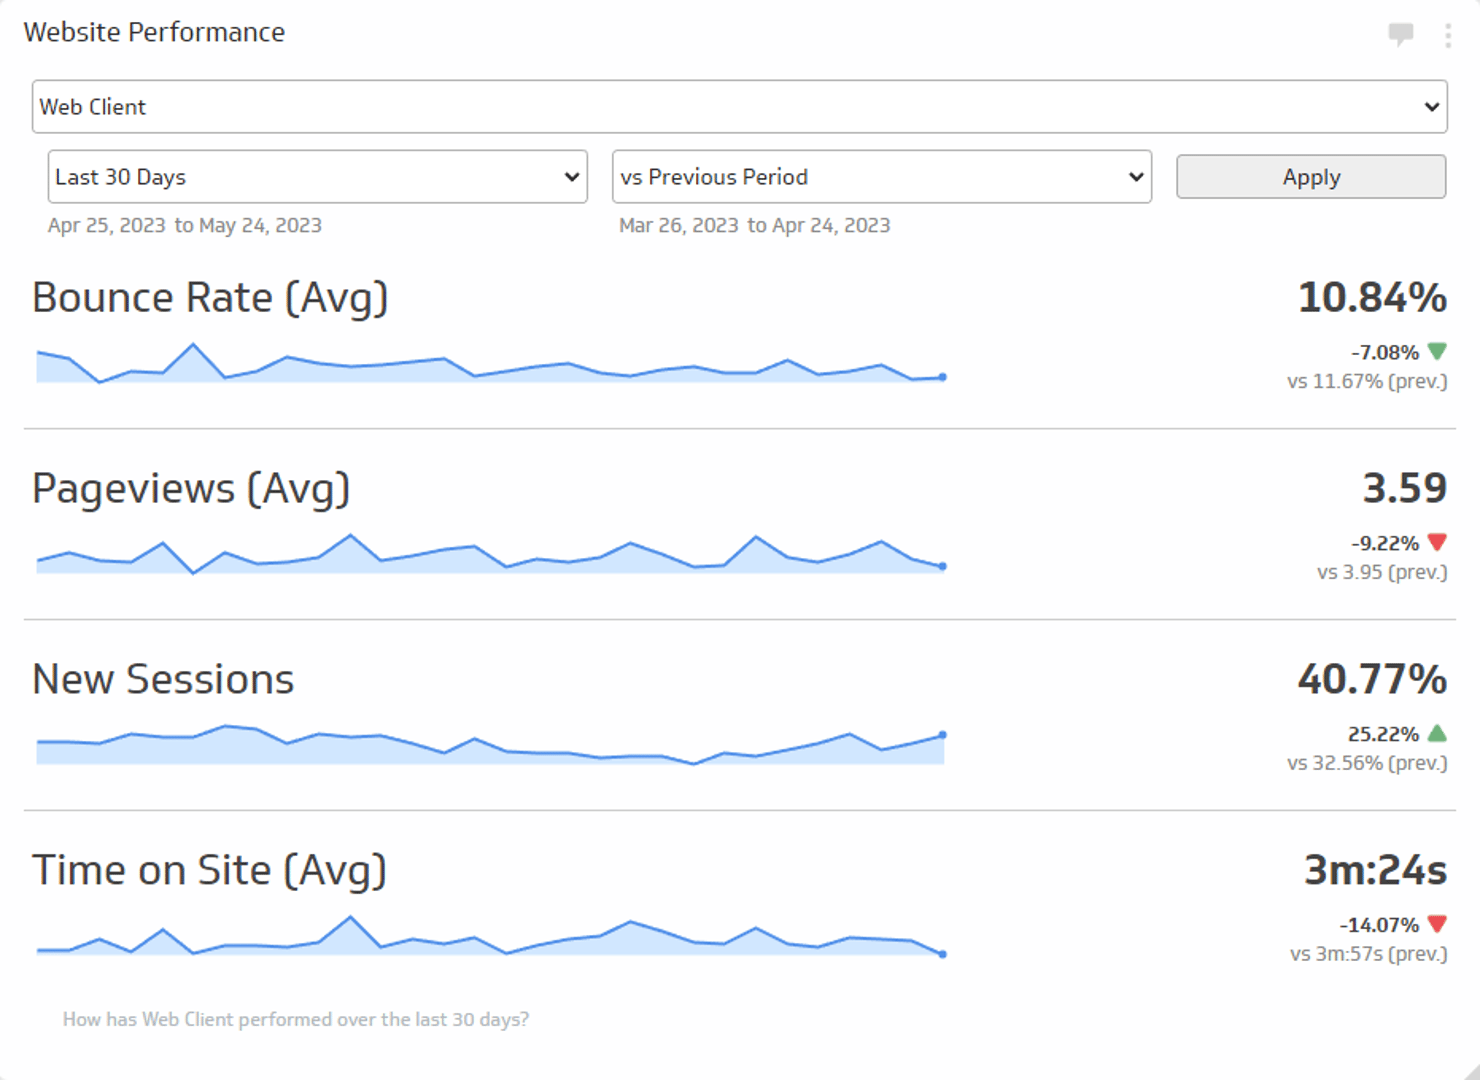
Website Performance
Track the average Bounce Rate, average Pageviews, new Sessions, and average Time on Site during the time period of your choice.

Use the Connector Gallery to create a custom Google Analytics 4 dashboard
With our Connector Gallery, you can create custom API queries to pull in data from your Google Analytics 4 account. Building custom queries allows you to specify the metrics and time periods that you want to track.
You can use custom queries to build out visualizations in Klipfolio. You can also combine your Google Analytics 4 data with other relevant data to create your custom dashboard.
Learn more about working with the Google Analytics 4 API and how you can start building your own Google Analytics 4 queries in Klipfolio.
