Facebook Ads Campaign Performance
Make sure your message is reaching the right audience by measuring your Facebook Ads campaign performance for the date range of your choice.
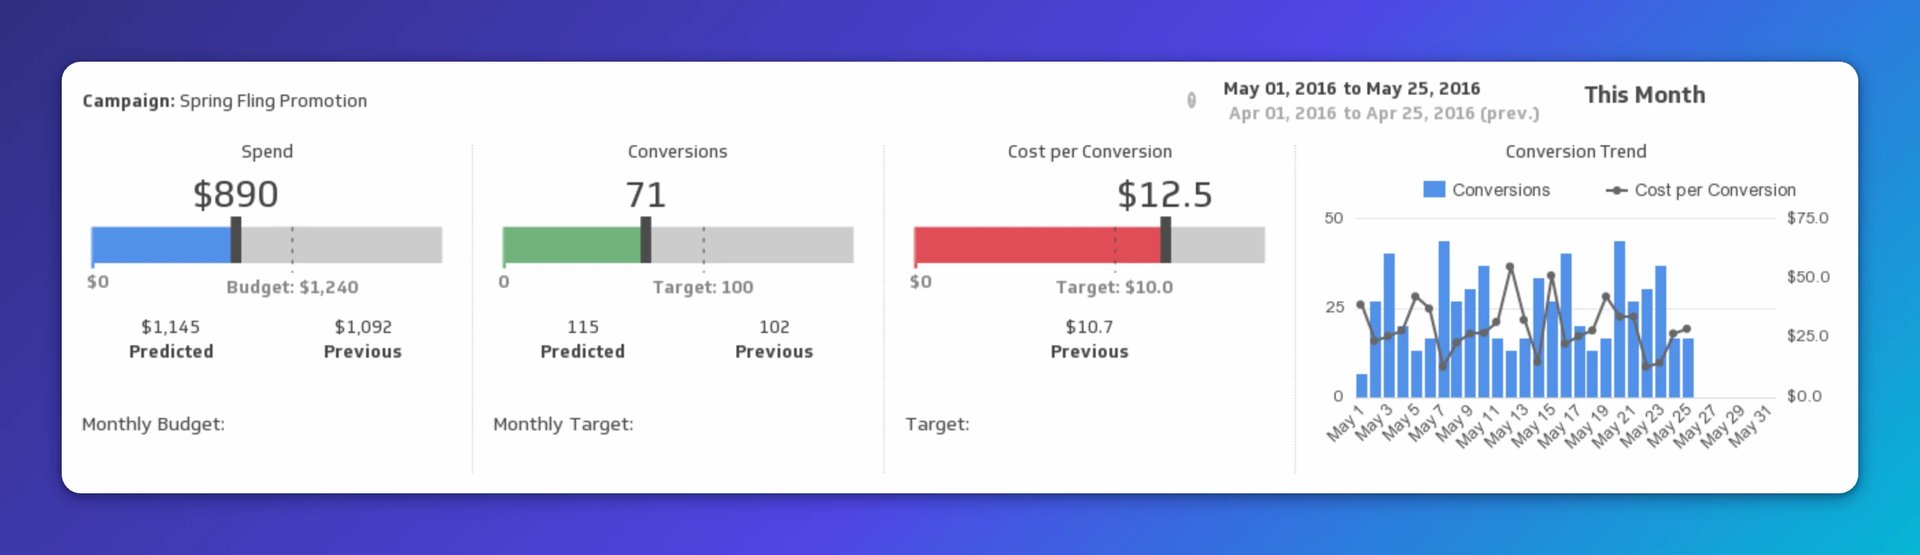
Facebook Ads: Cost per Conversion
What is Facebook Ads Campaign Performance?
Facebook Ads Campaign Performance measures how well a specific ad campaign is reaching and converting its intended audience over a selected date range. It tells you whether your spend is working.
Why Facebook Ads Campaign Performance matters
Running ads without tracking performance is the same as guessing. You need to know whether the money you're putting in is producing results, or quietly draining without return.
This metric gives you a clear, consistent answer. Instead of pasting numbers into a spreadsheet or asking someone to pull a report, you can see spend, conversions, and cost per conversion in one place, updated automatically. That means fewer surprises, faster decisions, and a small team that can operate with the same confidence as a much larger one.
Key terms for Facebook Ads Campaign Performance
To get useful answers from this metric, you need to understand what each component is actually telling you. Facebook defines these terms as follows:
Facebook Ads Spend: The total amount spent on your campaign to date. "Spent today" refers to the amount spent since 12am on the current day. If you've set a daily budget, this figure shows your progress toward that limit.
Conversions: Customer-completed actions, such as purchases or adding an item to a cart on your website. This is the outcome your campaign exists to produce.
Cost per conversion: What you're paying, on average, for each completed action. This is the number that tells you whether the campaign is worth running.
Conversion trend: How conversions are changing over time, so you can spot momentum shifts before they become problems.
Together, these figures answer the question that matters most: is this campaign producing results, and at what cost?
How to calculate cost per conversion
Cost per conversion is the most direct measure of campaign efficiency. The formula is:
Cost per Conversion = Total Ad Spend / Total Conversions
For example, if you spend $1,000 and generate 50 conversions, your cost per conversion is $20. Whether that's a good number depends on what a conversion is worth to your business. A $20 cost per conversion on a $200 product looks very different from the same number on a $30 product.
Tracking this figure over time, rather than checking it once, is what tells you whether your campaign is improving or declining.
How to set benchmarks for Facebook Ads Campaign Performance
A number on its own means little without context. To know whether your campaign is performing well, you need a baseline to compare against.
Start with your own historical data. What did cost per conversion look like in your last campaign? What conversion volume did a similar budget produce? Those figures are your starting point.
From there, you can set targets based on what a conversion is worth to your business, and use those targets to define what "good" looks like for your team. When your actuals consistently beat your benchmarks, you have evidence to scale. When they fall short, you have a clear signal to investigate before the budget runs out.
Create custom dashboards for you and your team.
Get started with KlipsHow to monitor Facebook Ads Campaign Performance in real time
Checking your numbers when you remember to is not the same as staying on top of them. The goal is to know what's happening without having to go looking.
Once you've set benchmarks and targets for Facebook Ads Campaign Performance, a dashboard keeps that information current and visible. Rather than pulling a report or pasting figures into a spreadsheet to make sense of them, you get a consistent view of spend, conversions, and cost per conversion alongside your budget, so you can act the moment something shifts.
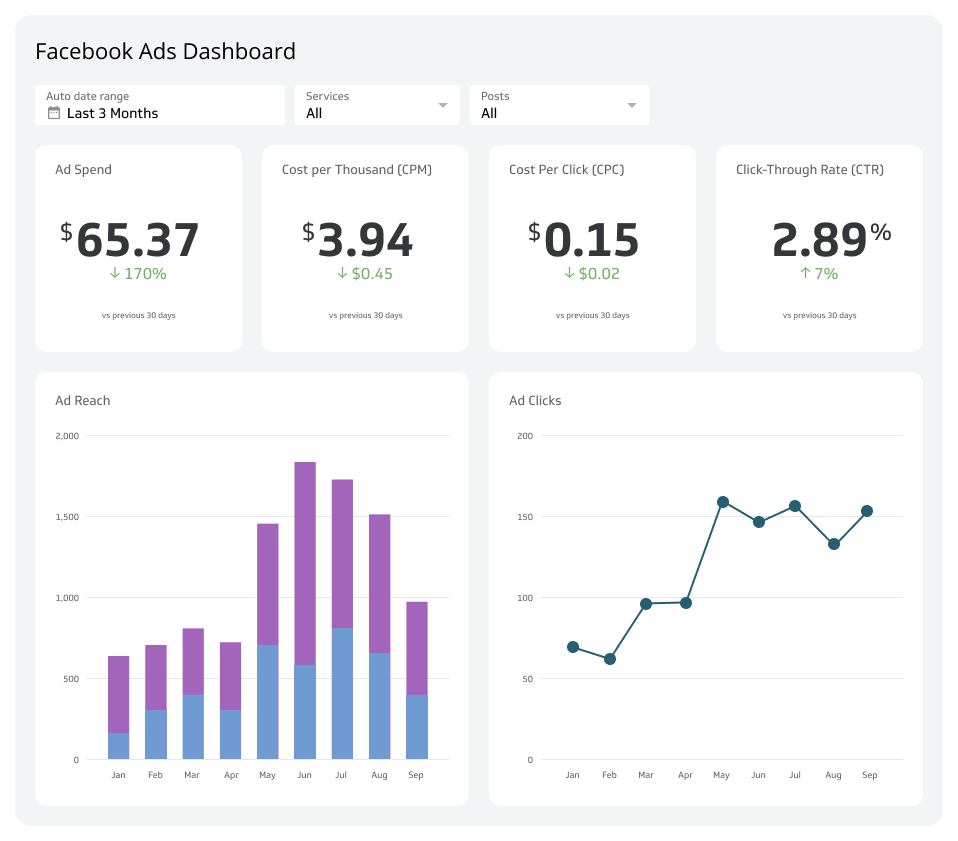
Track Facebook Ads Campaign Performance alongside your other social media KPIs on a Facebook Ads Dashboard to keep your full picture in one place.