Facebook Likes
Measure the total number of Facebook accounts that like your Page, track growth momentum, and connect audience size to real business outcomes.
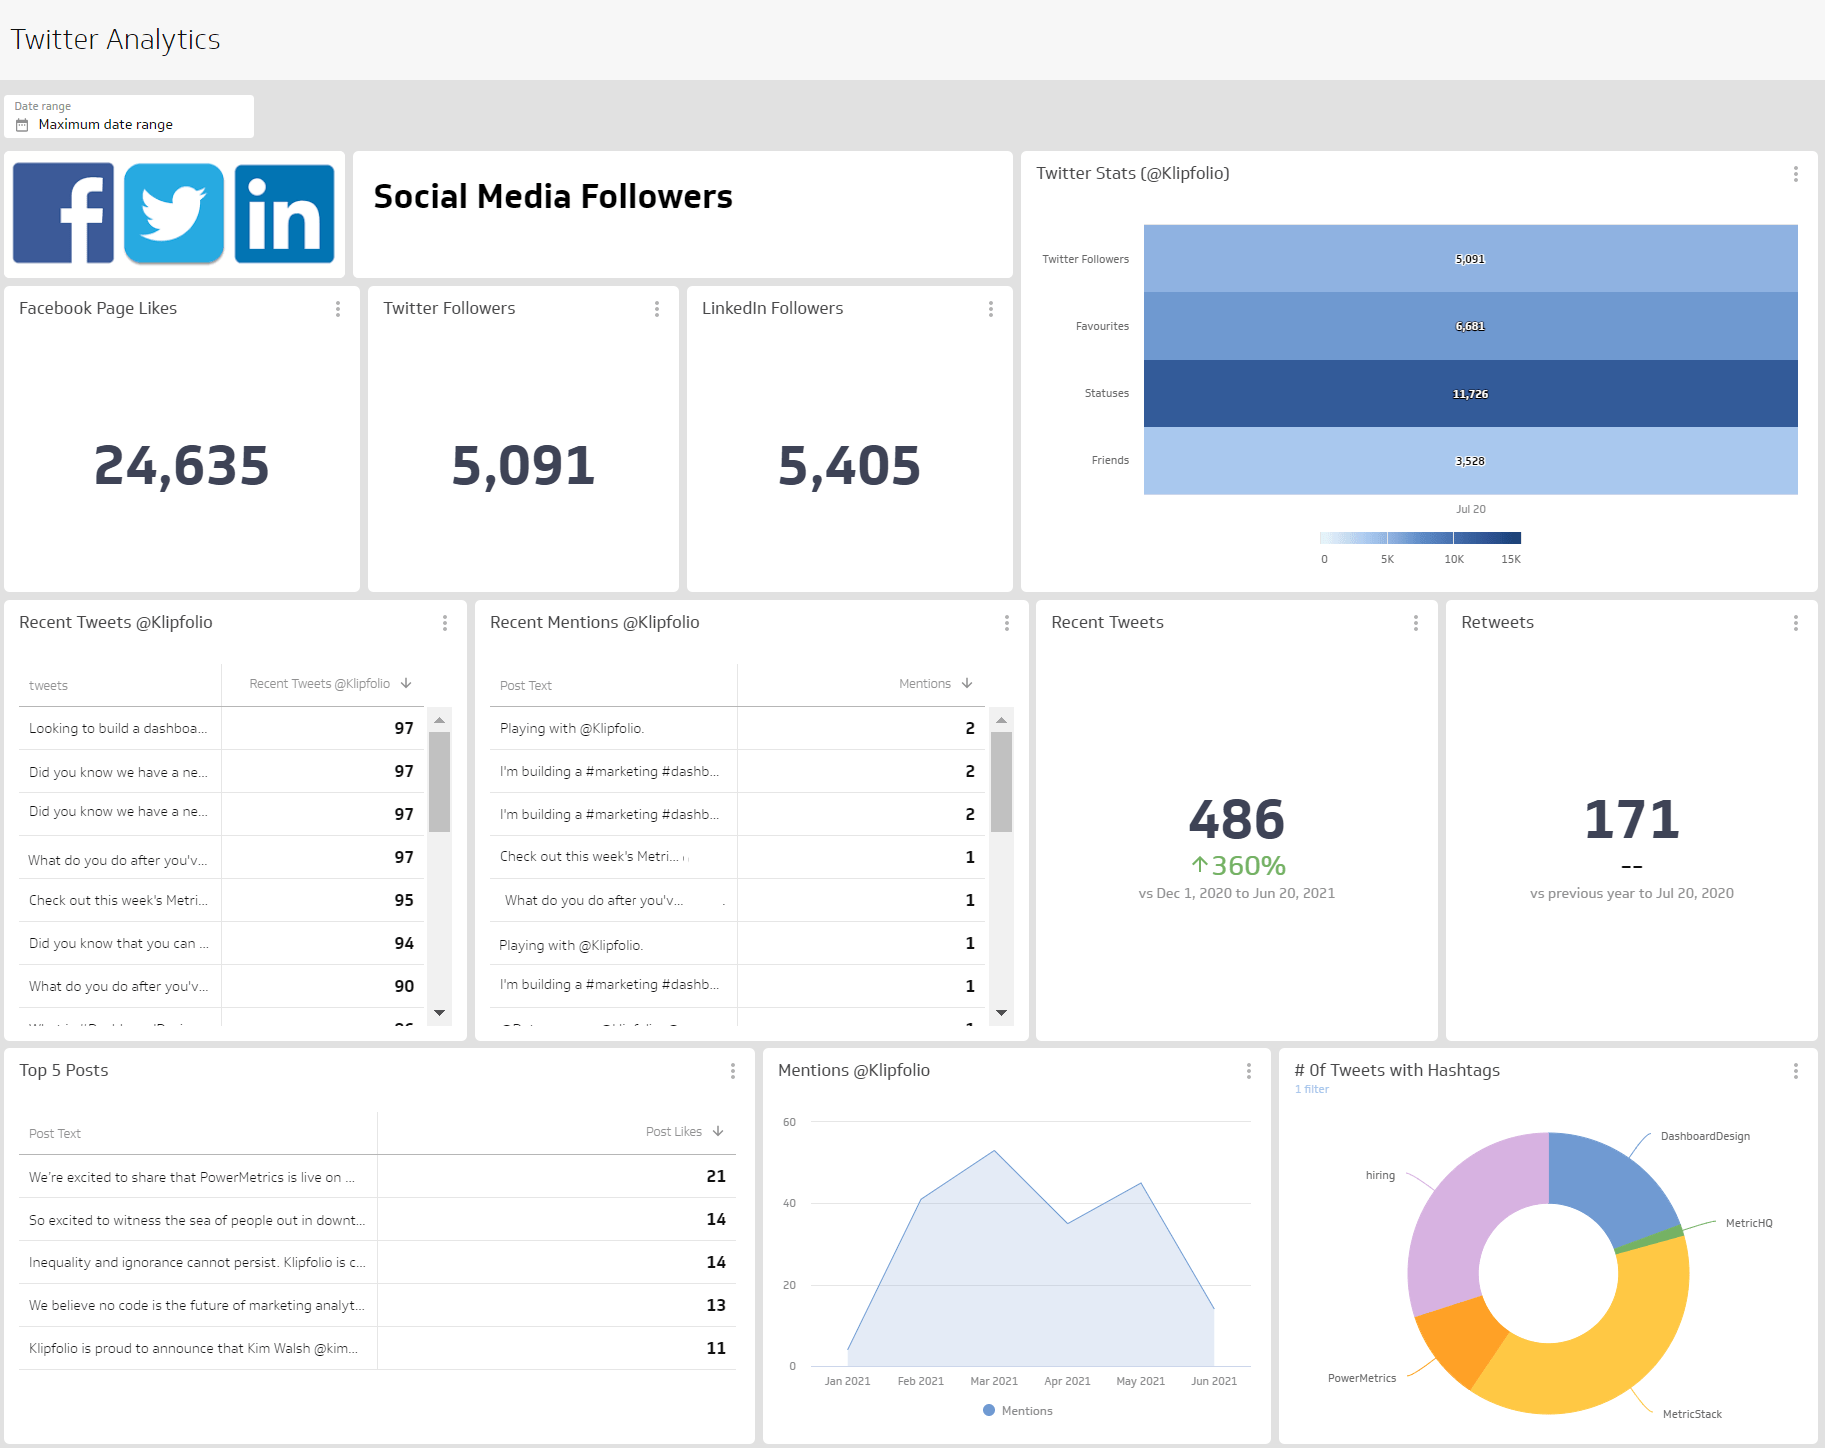
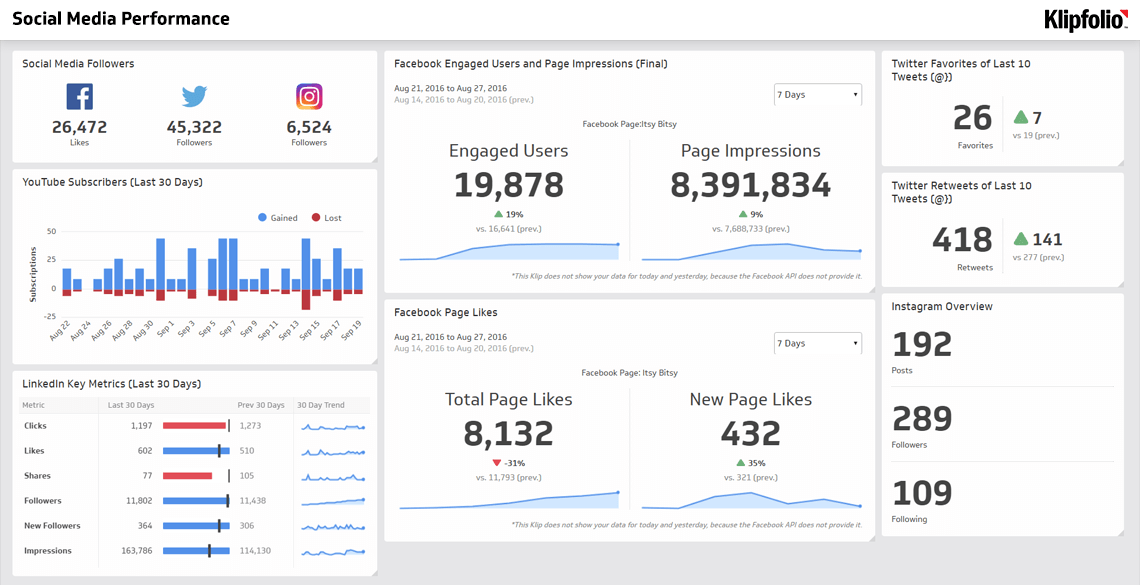
Facebook Page Likes
What are Facebook Likes?
Facebook Likes measure the total number of Facebook accounts that have liked your Page. The count is a running total that signals how many people have chosen to follow your updates and see more from your brand.
Likes are a basic visibility indicator. They do not guarantee reach on their own, but they expand the pool of people who can see your posts, engage, and eventually become customers.
Why Facebook Likes matter
Likes are a directional signal, not the whole story. Here is what they tell you when tracked alongside the right context:
- Social proof: A healthy like count builds credibility when new visitors land on your Page.
- Audience growth: More Page Likes grow your potential reach for organic and paid activity.
- Remarketing and lookalikes: A larger community helps you build stronger custom and lookalike audiences in Meta Ads.
- Content feedback: Spikes in new Likes often correlate with content or campaigns that resonate.
- Executive clarity: A simple, directional metric leaders can scan at a glance without waiting for someone to pull a report.
Track Likes alongside engagement rate, post reach, and click-throughs to keep quality in view, not just volume. Growth without engagement signals a mismatch between your audience and your content.
How to calculate Facebook Likes
Point-in-time total
Total Facebook Likes = Number of Facebook accounts that like your Page at the end of the period
This is the headline count most teams report. Pair it with trend lines for the last 13 months, quarter to date, and year to date.
Net new Likes
Net New Likes = New Likes during period - Unlikes during period
Report Net New Likes alongside the total. It shows growth momentum and lets you compare campaigns on equal footing.
Like Growth Rate
Like Growth Rate (%) = (Net New Likes during period / Starting Likes for the period) x 100
Like Growth Rate normalizes performance across Pages of different sizes, which is helpful when you benchmark markets or brands.
Example calculation
Your Page started the month with 8,000 Likes. During the month, 620 people liked the Page and 140 unliked it. You finished with 8,480 Likes.
- Net New Likes: 620 - 140 = 480
- Ending total: 8,000 + 480 = 8,480
- Like Growth Rate: 480 / 8,000 x 100 = 6%
If you plot weekly numbers, you might see that a product demo video drove 60% of the month's growth in three days. That insight tells you what to make more of next month, without having to dig through raw data or paste numbers into a spreadsheet to figure it out.
What is a good benchmark for Facebook Likes?
Benchmarks vary by industry, Page age, content cadence, and paid support. Use these guidelines to set practical targets:
- Early-stage Pages (under 10,000 Likes): Monthly growth of 2% to 8% is common when you publish consistently and run small paid boosts.
- Established Pages (10,000 to 100,000 Likes): Expect 1% to 3% monthly growth with regular posting and periodic campaigns.
- Large Pages (100,000+ Likes): Growth often slows to 0.5% to 2% monthly unless you invest in targeted acquisition.
These ranges are directional, not universal. Track your trailing 3-month median growth, compare similar markets, and adjust for seasonality. A 1.5% growth rate with rising engagement beats 4% growth driven entirely by untargeted paid acquisition.
How to improve Facebook Likes
- Clarify your audience: Build personas and map content to their needs, questions, and jobs to be done.
- Post with a consistent rhythm: A steady cadence beats bursts followed by silence. Prioritize quality and keep a predictable schedule.
- Use creative that earns attention: Lead with a strong hook in the first three seconds of video. Use clear imagery and concise copy in static posts.
- Invite action: Ask viewers to like the Page for future updates. Keep the ask short and specific.
- Promote best performers: Put small budgets behind organic winners to extend reach to similar audiences.
- Reduce friction: Keep your Page info, cover image, and About section current. Outdated details erode trust.
- Cross-pollinate: Share top Facebook content in email, on your website, and across other channels with a simple prompt to follow.
How to monitor Facebook Likes in Klips
You can centralize Page data, calculate your key Like metrics, and share live dashboards across your team using Klips, so the numbers are always current and no one has to chase them down.
- Ingest data: Connect exports from Meta Business Suite, your social reporting spreadsheet, or a data warehouse table that captures daily totals, new Likes, and Unlikes.
- Model the measures: Build fields for Total Likes, New Likes, Unlikes, Net New Likes, and Like Growth Rate. Keep one row per day to support trends and seasonality views.
- Visualize clearly: Use a single value for current Total Likes, a line chart for 13-month trend, and a bar or column chart for weekly Net New Likes. Add a goal line to show the monthly target.
- Segment for insight: Break out paid-supported weeks versus organic only. Segment by campaign or content theme to see which topics correlate with growth.
- Distribute with control: Schedule weekly PDFs to the social team, keep a wallboard view for the office, and share secure links with executives so everyone sees the same numbers without anyone having to ask.
Pair Likes with engagement-focused KPIs such as Facebook Engagement Rate and Post Engagement. That mix keeps you focused on building a community that interacts, not just a number that rises.
Create custom dashboards for you and your team.
Get started with KlipsReporting frequency
Weekly reporting keeps momentum without overreacting to day-to-day volatility. Maintain a monthly view for planning and a quarterly view for strategy.