Email Marketing Engagement Score
Measure how effective email marketing campaigns are at engaging your audience.
Email Marketing Engagement Score
What is Email Marketing Engagement Score?
Email Marketing Engagement Score measures how well your email campaigns drive real interaction, using Open Rate and Click Rate as the two primary signals.
Together, these two metrics tell you whether your campaigns are earning attention and converting that attention into action. On their own, each one tells half the story.
How it's calculated
Open Rate = (Emails Opened / (Emails Sent - Bounces)) × 100
Click Rate = (# of Clicks / # of Emails Sent) × 100
Open Rate reflects how well your subject line, sender name, and send time earned attention. Click Rate reflects whether your content and offer were relevant enough to act on.
Key terms
List subscribers: The number of people who have opted into an email list maintained by your marketing team.
Open Rate: The percentage of list subscribers who open a given email.
Click Rate: The percentage of list subscribers who click at least one link in a given email, including calls to action, social links, or links back to your website.
Email Marketing Engagement Score example
Suppose you sent 500 emails and 150 recipients opened the message. Of those, 80 clicked something inside it.
Open Rate = (150 / 500) × 100 = 30%
Click Rate = (80 / 500) × 100 = 16%
A 30% Open Rate tells you your subject line is working. A 16% Click Rate tells you the content is resonating. Together, they confirm the campaign is doing its job and give you a clear starting point for the next one.
Benchmarks by industry
Your numbers only mean something in context. Mailchimp maintains a continuously updated list of average Open Rate and Click Rate by industry. A selection is below.
| Industry | Open Rate | Click Rate |
|---|---|---|
| Business and Finance | 21.31% | 2.76% |
| Construction | 22.53% | 1.96% |
| E-commerce | 16.80% | 2.47% |
| Manufacturing | 22.70% | 2.04% |
| Marketing and Advertising | 18.22% | 2.04% |
| Non-Profit | 25.20% | 2.84% |
| Professional Services | 20.82% | 2.61% |
| Software and Web Apps | 21.43% | 2.38% |
If your industry is not listed, or you want benchmarks by company size, see Mailchimp's Email Marketing Benchmarks for the full breakdown.
What good looks like
Two signals tell you your email program is healthy:
A high or improving Open Rate: Your subject lines are earning attention, your sender reputation is solid, and your emails are landing in the inbox rather than the spam folder.
A high or improving Click Rate: Your content is relevant, your calls to action are clear, and subscribers are moving from reading to acting.
Both trending upward together is the goal. One improving while the other stagnates usually points to a specific problem worth investigating. A low Click Rate alongside a strong Open Rate, for example, tells you the subject line is working but the email body is not delivering on its promise.
Common challenges
Deliverability is the most common reason Email Marketing Engagement Score underperforms. If your numbers are low, the issue may not be the content itself. Your emails may be going to spam, or not reaching the inbox at all.
The score won't tell you exactly what's broken, but it will signal that something is worth investigating. Start with your subject lines and content, then check your sender reputation and list hygiene.
Best practices
Get past spam filters first. According to research from Mailchimp, spammy keywords, ALL CAPS subject lines, and excessive punctuation all hurt deliverability. Learn how spam filters work before your next send.
Write subject lines that describe the email. The Mailchimp research on subject lines is clear: don't sell what's inside, tell what's inside. Subscribers open emails when they know what they're getting.
A/B test systematically. Test subject lines, preview text, call-to-action copy, and send times. Over time, this fine-tunes your program to your specific list and lifts engagement across the board.
Track engagement alongside conversions. Open Rate and Click Rate measure attention. To know whether your campaigns are driving business outcomes, track them alongside goal conversion rates and social interactions. That combination shows marketing ROI, not just activity.
How to monitor Email Marketing Engagement Score
Checking engagement metrics once a week in your email platform means you're always looking at the past. A live dashboard keeps Open Rate, Click Rate, and related KPIs visible in one place, updated automatically, so you know what's happening without waiting for someone to pull a report.
When a campaign underperforms, you catch it while there's still time to act, not after it's over.
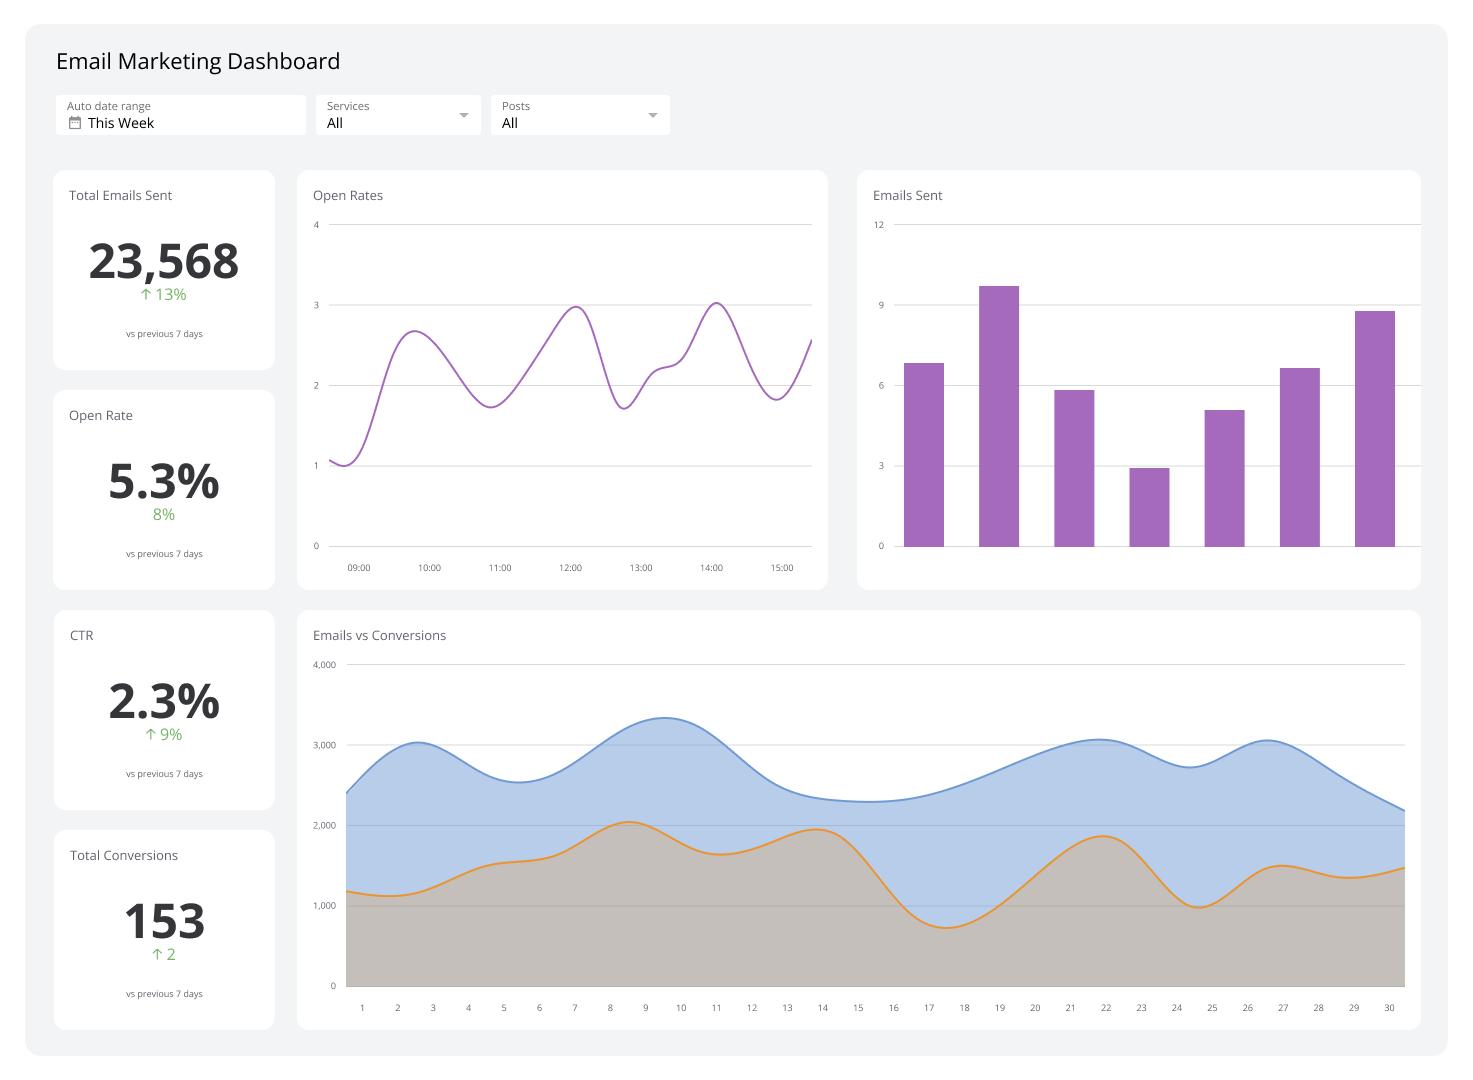
Track your Email Marketing Engagement Score alongside your other campaign metrics on an Email Marketing Dashboard.
Create custom dashboards for you and your team.
Get started with KlipsFurther reading
11 "Sneaky" Tricks to DOUBLE Your Email Conversions, Richard Lindner
Email Marketing Benchmarks, Mailchimp