Recruitment Dashboard
Track pipeline, time-to-hire, and Cost-Per-Hire in one view.
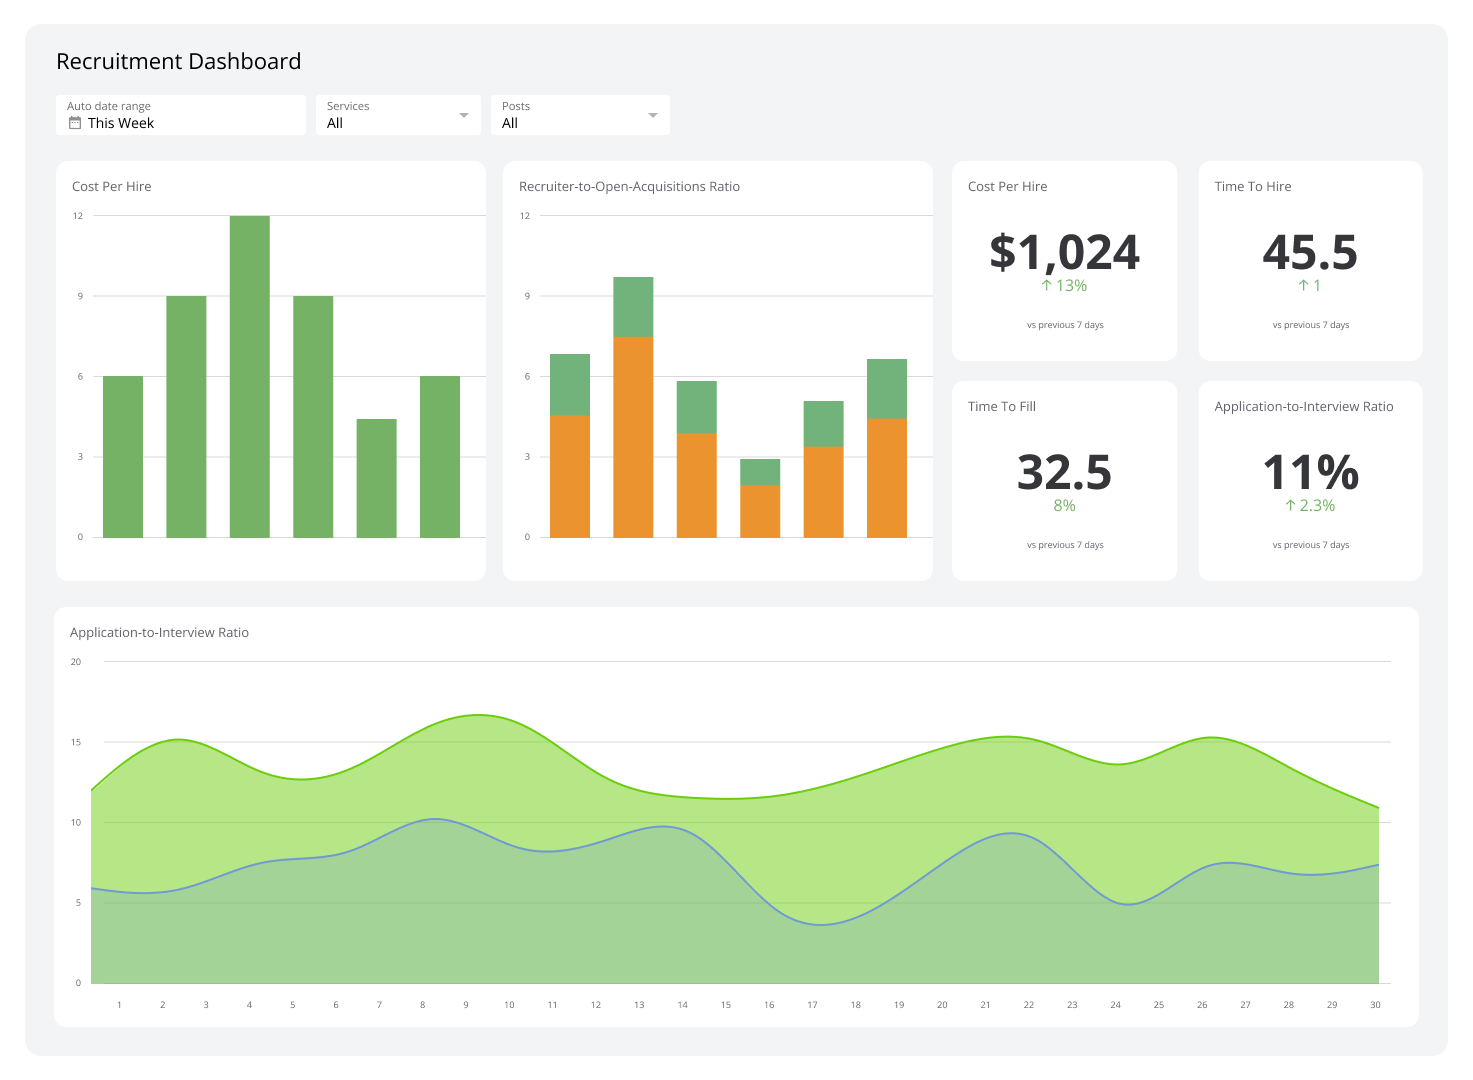
What is a Recruitment Dashboard?
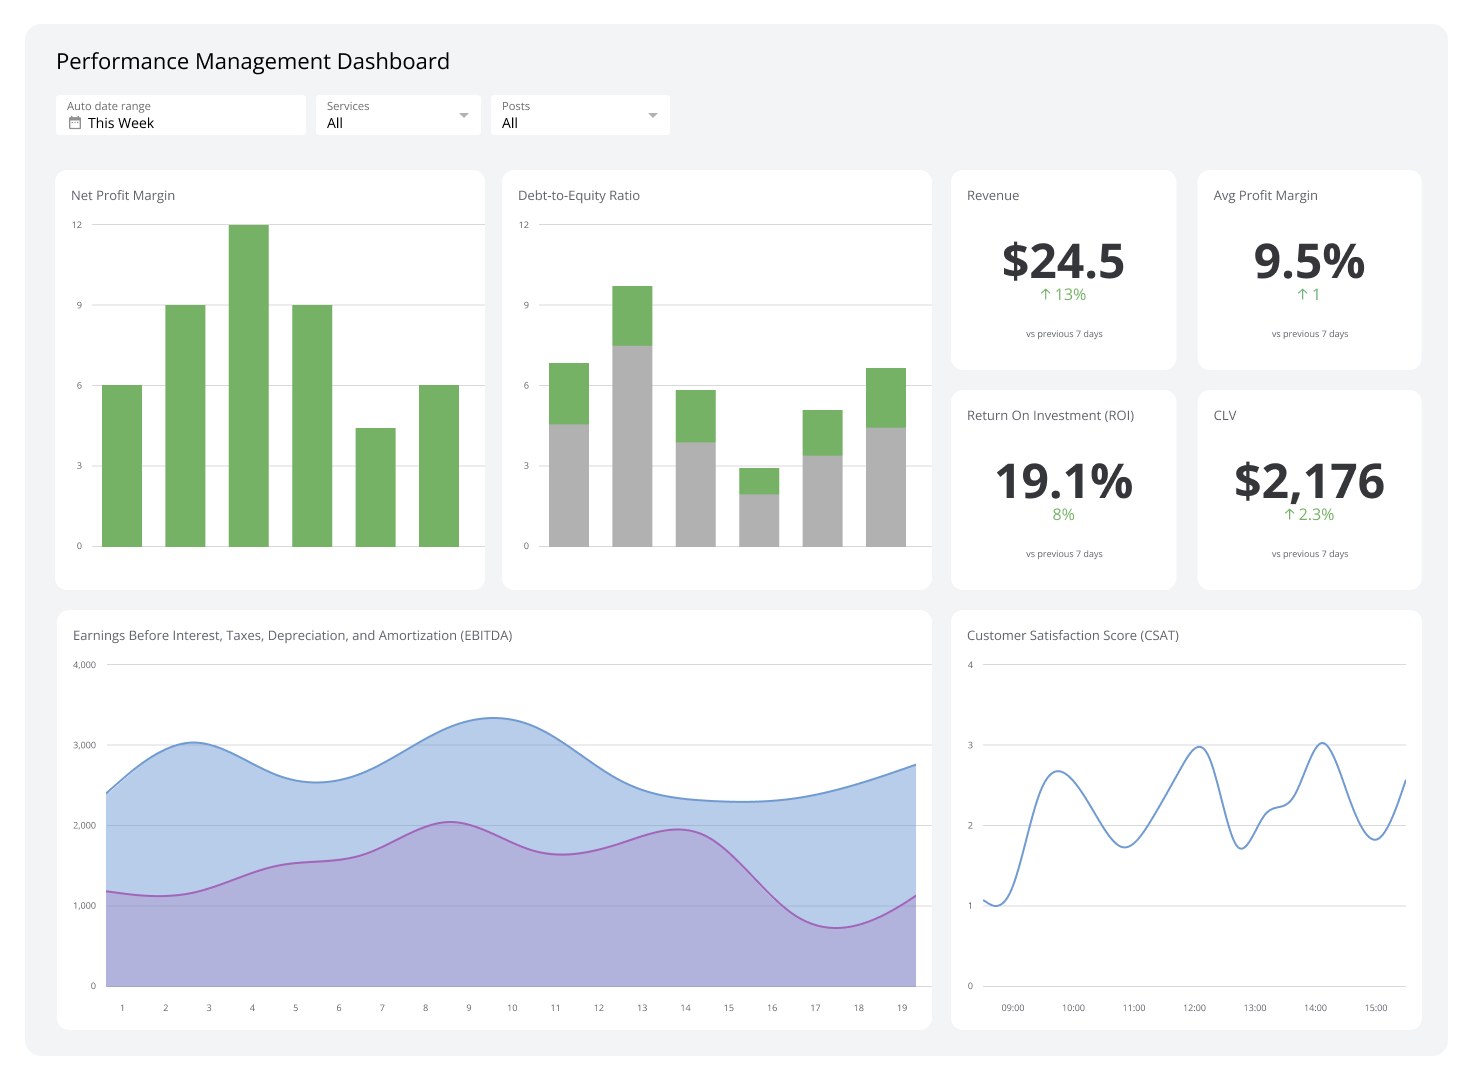
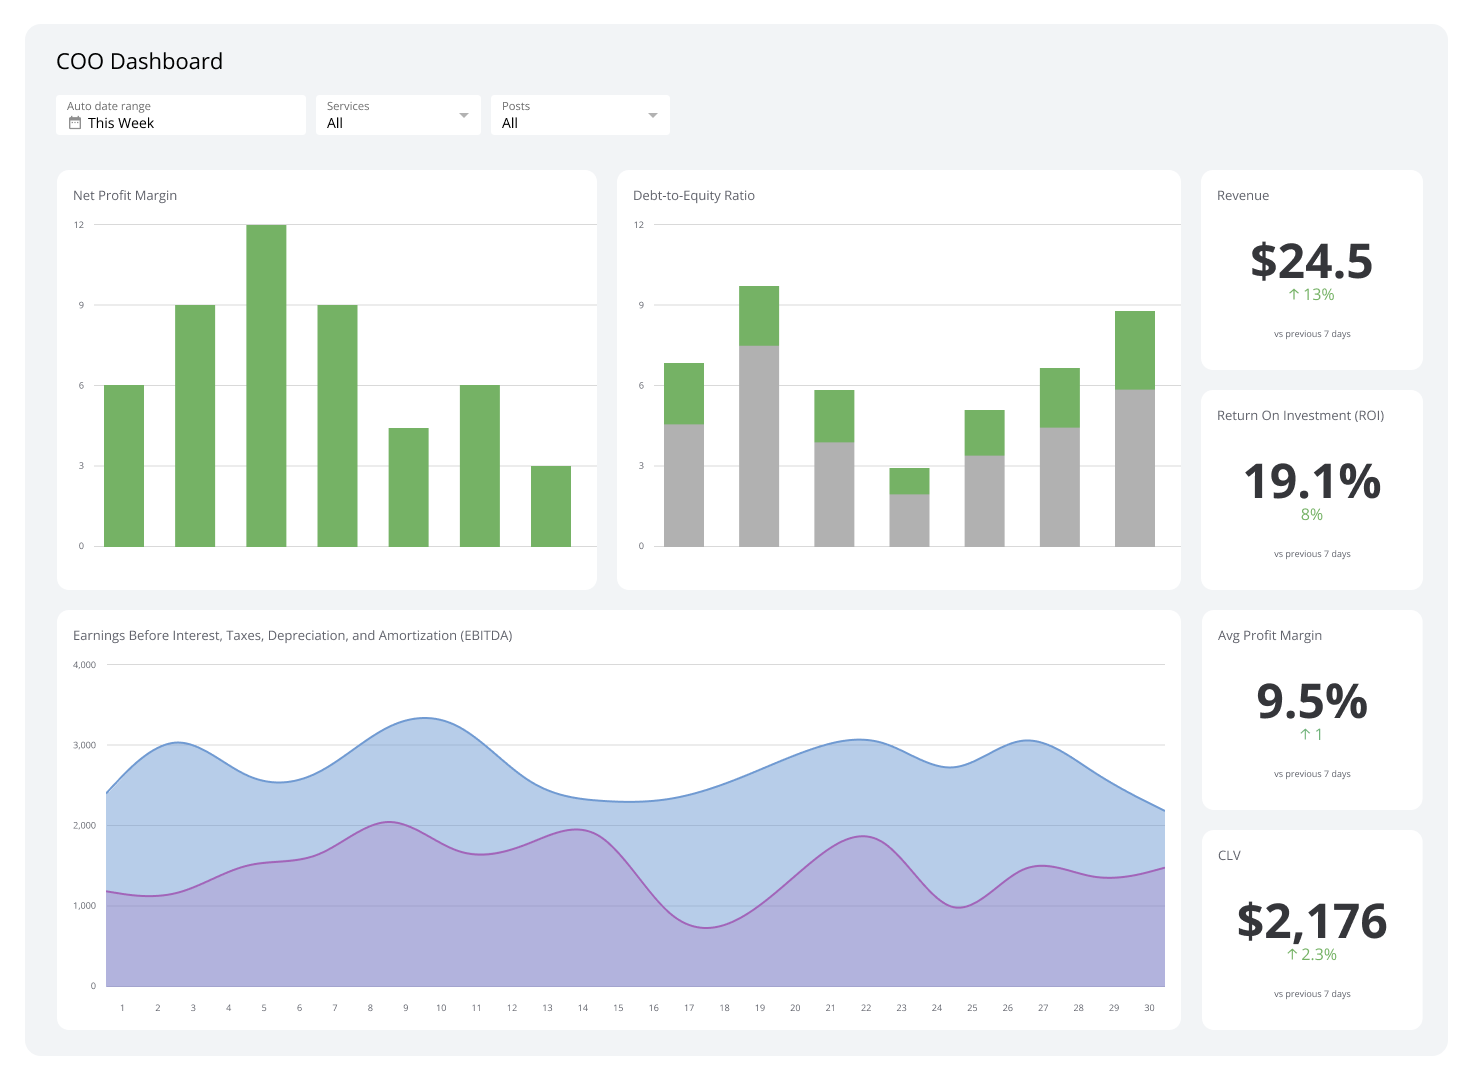
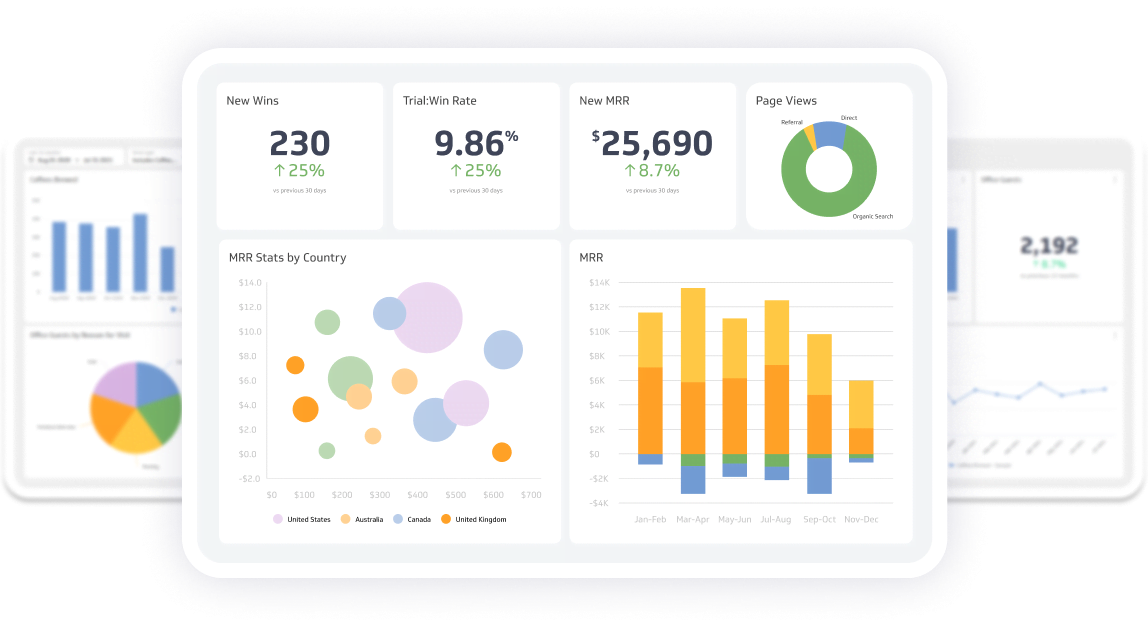
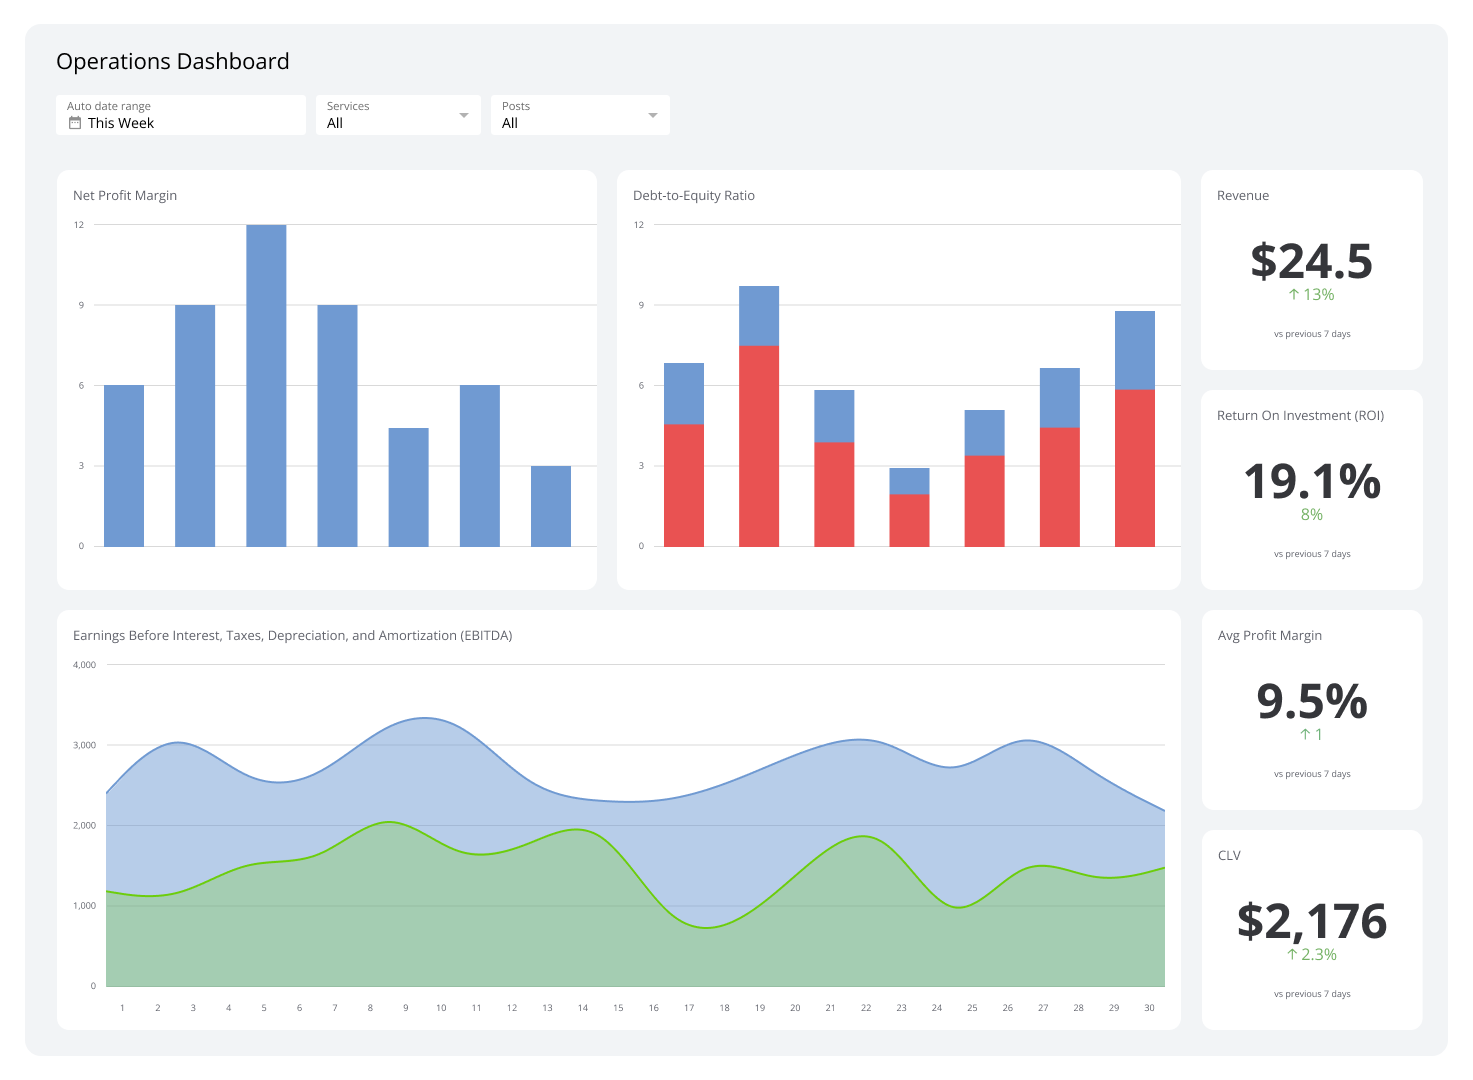
A recruitment dashboard pulls data from job postings, applications, interviews, and offers to give you a real-time view of your hiring pipeline.
Instead of chasing numbers across spreadsheets or waiting for someone to pull a report, you see where every candidate stands, where delays are building, and which roles are at risk. That clarity lets you act sooner, not after a position has been open for three months.
Clear metrics help you spot patterns: the stages where candidates drop off, which sources bring stronger applicants, and whether your team has the capacity to fill what's open. You stop guessing and start making calls with confidence.
Examples of Recruitment Dashboards
Recruitment Overview Dashboard
A Recruitment Overview Dashboard shows how efficient and effective your hiring process is. Rising time-to-fill, declining candidate quality, low application volume: these problems surface early, before they become expensive.
| Who's it for | HR managers, talent acquisition teams, hiring managers, recruiters, senior management, reporting analysts, business analysts, team leaders |
|---|---|
| How often it's needed | Real-time, daily, weekly, monthly |
| Covered KPIs | Number of job applications received, number of positions filled, application completion rate, time-to-hire, cost-per-hire, source of hire, candidate quality rating, job offer acceptance rate, candidate pipeline stages, interview-to-hire ratio, diversity metrics, job advertisement performance, candidate experience scores, referral program performance, recruiter activity metrics, hiring manager satisfaction scores, internal mobility rates, talent pool growth, background check completion time, new hire retention rates, employee onboarding time, recruitment campaign effectiveness, job offer turnaround time, candidate feedback comments, rejection reasons, recruitment efficiency index |
Sourcing Dashboard
A Sourcing Dashboard surfaces low yields, diversity gaps, and channel inefficiencies before they skew your pipeline. The data shows when to shift sourcing strategies and how each source affects candidate quality downstream.
| Who's it for | HR managers, talent acquisition teams, hiring managers, recruiters, sourcing specialists, team leaders, business analysts, reporting analysts |
|---|---|
| How often it's needed | Real-time, daily, weekly, monthly |
| Covered KPIs | Sourcing channel performance, number of applications per source, cost per source, candidate quality by source, time-to-fill by source, conversion rate from source, source effectiveness ratio, candidate engagement by source, referral source effectiveness, diversity of candidates by source, source of hire by role, candidate drop-off rate by source, social media recruiting metrics, job board performance, source lead-to-hire ratio, pipeline contribution by source, offer acceptance rate by source, sourcing campaign ROI, percentage of hires by source, hiring manager satisfaction by source, proactive sourcing interaction rate, candidate retention by source, application-to-interview ratio by source |
Offer Acceptance Rate Dashboard
An Offer Acceptance Rate Dashboard tracks how many job offers are made and accepted. Views by role, department, and hiring manager reveal where offer processes work and where they stall.
Patterns like technical roles posting lower acceptance rates than marketing often point to compensation or benefits concerns. Seeing that clearly means you can address it before losing more candidates at the finish line.
| Who's it for | HR managers, talent acquisition teams, hiring managers, recruiters, recruitment coordinators, department heads, business analysts, reporting analysts |
|---|---|
| How often it's needed | Real-time, daily, weekly, monthly |
| Covered KPIs | Job offer acceptance rate, offer decline reasons, time-to-acceptance, acceptance rates by position, acceptance rates by department, candidate satisfaction with offer process, compensation package effectiveness, competitive offer analysis, acceptance rate by recruiter, offer negotiations rate, impact of company brand on acceptance, candidate feedback on offers, cost per accepted offer, effectiveness of signing bonuses, acceptance rate by candidate source, geographic acceptance trends, offer rescind rate |
Recruitment Funnel Dashboard
A Recruitment Funnel Dashboard shows progression by stage, including offer and acceptance rates. It highlights conversion and drop-off points so you know exactly where candidates are being lost, not just that they are.
Bottlenecks like gaps between interview rounds or slow communication become visible here. With that view, you can trim delays and improve the hiring experience before candidates walk away.
| Who's it for | HR managers, talent acquisition teams, hiring managers, recruiters, sourcing specialists, team leaders, business analysts, reporting analysts |
|---|---|
| How often it's needed | Real-time, daily, weekly, monthly |
| Covered KPIs | Number of applicants, applications received per vacancy, screening rate, interview rate, offer rate, acceptance rate, hire rate, time-to-hire, time-to-fill, candidate drop-off rate, cost-per-hire, quality-of-hire, sourcing channel performance, candidate experience scores, referral rate, applicant conversion rate, job posting effectiveness, pipeline efficiency, interview-to-offer ratio, offer-to-acceptance ratio, demographic metrics, diversity metrics, application completion rate, rejection reasons, applicant source breakdown |
Recruitment Team Performance Dashboard
A Recruitment Team Performance Dashboard tracks productivity and outcomes across the team. You see applicants screened, interviews arranged, offers extended, time-to-hire, and individual recruiter performance in one view.
Job fill rates and activity breakdowns surface where the team is strong and where capacity or process needs attention.
| Who's it for | HR managers, talent acquisition teams, hiring managers, recruiters, sourcing specialists, team leaders, business analysts, reporting analysts |
|---|---|
| How often it's needed | Real-time, daily, weekly, monthly |
| Covered KPIs | Number of applicants screened, interviews arranged, offers extended, offers accepted, hires made, time-to-hire, time-to-fill, applicant-to-hire ratio, source-of-hire effectiveness, candidate experience scores, recruiter productivity, cost-per-hire, quality-of-hire, passive candidate conversion rate, recruitment funnel efficiency, candidate feedback comments, job match quality, interview-to-offer ratio, offer-to-acceptance ratio, pipeline velocity, recruitment marketing effectiveness, diversity hiring metrics, candidate rejection reasons, external vs. internal recruitment success, top recruiter performance, onboarding success rates, recruitment team performance index |
Individual Recruitment Performance Dashboard
An Individual Recruitment Performance Dashboard evaluates each recruiter's ability to source and close. Metrics like time-to-hire and candidate satisfaction show who is converting at each stage and where support is needed.
This view makes coaching conversations easier. You arrive with data, not impressions.
| Who's it for | Hiring managers, recruiters, sourcing specialists, team leaders, HR managers, talent acquisition teams, reporting analysts, business analysts |
|---|---|
| How often it's needed | Real-time, daily, weekly, monthly |
| Covered KPIs | Number of applicants screened, interviews arranged, offers extended, offers accepted, hires made, time-to-hire, time-to-fill, applicant-to-hire ratio, source-of-hire effectiveness, candidate experience scores, recruiter productivity, cost-per-hire, quality-of-hire, passive candidate conversion rate, recruitment funnel efficiency, candidate feedback comments, job match quality, interview-to-offer ratio, offer-to-acceptance ratio, pipeline velocity, recruitment marketing effectiveness, diversity hiring metrics, candidate rejection reasons, external vs. internal recruitment success, onboarding success rates |
Open Position and New Roles Dashboard
An Open Position and New Roles Dashboard shows the status and progress of every opening. You see open counts, application trends, and where each role sits in the process so you can spot hard-to-fill positions and timeline gaps before they become urgent.
| Who's it for | Recruiters, hiring managers, talent acquisition teams, HR managers, department heads, recruitment coordinators, business analysts, reporting analysts |
|---|---|
| How often it's needed | Real-time, daily, weekly, monthly |
| Covered KPIs | Number of open positions, time-to-fill open roles, candidate pipeline status, job requisition aging, applicant volume per role, offer acceptance rates, recruitment advertising effectiveness, internal vs. external hire ratios, diversity of candidate pool, interview scheduling efficiency, candidate feedback scores, sourcing channel effectiveness, time-to-post jobs, recruitment communication timelines, onboarding progress for new roles, alignment of hires with business objectives, role-specific vacancy trends, urgency of role fulfillment, impact of employer branding on candidate attraction, recruitment budget allocations |
Create custom dashboards for you and your team.
Get started with KlipsApplicant Tracking Dashboard
An Applicant Tracking Dashboard organizes your pipeline and tracks stage movement. Application counts, screening progress, interview steps, and outcomes are visible in one place, revealing where candidates drop off or where delays are building.
| Who's it for | HR managers, talent acquisition teams, hiring managers, recruiters, recruitment coordinators, department heads, business analysts, reporting analysts |
|---|---|
| How often it's needed | Real-time, daily, weekly, monthly |
| Covered KPIs | Number of applications received, application-to-interview ratio, interview-to-offer ratio, time-to-hire, candidate pipeline status, offer acceptance rate, applicant source effectiveness, candidate experience scores, job offer decline reasons, recruitment advertising ROI, internal vs. external hire statistics, application completion rate, requisition fulfillment time, recruitment workflow efficiency, candidate feedback ratings, diversity of applicant pool, hiring manager satisfaction rate, interview scheduling efficiency, background check completion time, onboarding initiation speed, candidate dropout rate, referral program effectiveness, role-specific applicant trends |
Onboarding Dashboard
An Onboarding Dashboard shows how new hires progress in their first months. Training completion and early satisfaction scores are visible so you can step in sooner if someone is struggling, not after they have already decided to leave.
| Who's it for | HR managers, recruitment coordinators, training coordinators, department heads, team leaders, onboarding specialists, reporting analysts, senior management |
|---|---|
| How often it's needed | Real-time, daily, weekly, monthly |
| Covered KPIs | Onboarding completion rate, time-to-productivity, training completion rates, new hire retention rate, onboarding satisfaction score, new hire engagement level, time-to-full-compliance, onboarding program effectiveness, feedback from new hires, mentor participation rate, time spent on orientation, document submission rates, onboarding cost per hire, new hire support requests, new hire performance metrics, probation period completion rate, early attrition rate, job readiness of new hires, adherence to onboarding schedule, new hire goal achievement rate |
Cost-Per-Hire Dashboard
A Cost-Per-Hire Dashboard gives you a clear view of spend across the hiring process. You can break down advertising, agency, travel, referral, and onboarding costs by stage and source, then see where the budget is going relative to the quality of hires it produces.
| Who's it for | HR managers, talent acquisition teams, hiring managers, recruiters, department heads, recruitment coordinators, finance teams, business analysts, reporting analysts |
|---|---|
| How often it's needed | Real-time, daily, weekly, monthly |
| Covered KPIs | Total recruitment cost, cost per applicant, cost per interview, cost per offer, internal recruitment costs, external recruitment costs, advertising costs, agency fees, onboarding costs, training costs, referral bonus expenses, job posting expenses, budget vs. actual spend, recruitment ROI, time-to-fill correlation with cost, sourcing channel cost-effectiveness, internal vs. external sourcing costs, candidate assessment costs, technology and platform subscription costs, cost per hire by department, cost per hire by role, cost per hire over time |
Candidate Diversity Dashboard
A Candidate Diversity Dashboard shows diversity metrics across your funnel, including race, gender, age, and academic background. Gaps that are invisible in aggregate data become clear at the stage level, where you can actually do something about them.
| Who's it for | HR managers, talent acquisition teams, hiring managers, recruiters, department heads, recruitment coordinators, business analysts, reporting analysts |
|---|---|
| How often it's needed | Real-time, daily, weekly, monthly, yearly |
| Covered KPIs | Representation of gender, ethnicity, age, disability status, and veteran status among candidates, diversity hiring rate, diversity sourcing channel effectiveness, diversity at different recruitment stages, bias detection in recruitment process, diversity benchmark comparisons, diversity hire ratio by department, diversity hire ratio by role, time-to-hire diversity impact, diverse candidate feedback, impact of diversity initiatives on recruitment, diversity campaign effectiveness, applicant drop-off rate by demographic |
Employee Referral Dashboard
An Employee Referral Dashboard measures how well your referral program brings in talent. It tracks referrals submitted, referrals hired, and who refers most frequently, then ties those hires to cost and quality outcomes.
You can see whether referrals reduce Cost-Per-Hire and lift quality, and which teams consistently source the strongest candidates.
| Who's it for | HR managers, talent acquisition teams, hiring managers, recruiters, department heads, recruitment coordinators, business analysts, reporting analysts |
|---|---|
| How often it's needed | Real-time, daily, weekly, monthly |
| Covered KPIs | Referral hire rate, time-to-fill for referred candidates, retention rate of referred hires, success rate of referred candidates, employee participation in referral program, cost per referral hire, referral incentive effectiveness, quality of hire from referrals, referral source analysis, referral program satisfaction, geographic referral trends, referral-to-hire conversion rate, diversity of referred candidates, employee feedback on referral process, new hire retention from referrals, impact of referral campaigns, referral bonus payout rates, referral effectiveness by department |
Gender Balance Dashboard
A Gender Balance Dashboard measures your company's gender ratio by department, leadership level, and role. Overrepresentation that is invisible in company-wide averages becomes clear when you break it down this way, and that clarity is what guides fairer hiring and development decisions.
| Who's it for | HR managers, talent acquisition teams, hiring managers, recruiters, department heads, recruitment coordinators, business analysts, reporting analysts |
|---|---|
| How often it's needed | Real-time, daily, weekly, monthly |
| Covered KPIs | Applicant gender ratio, gender ratio at each stage of recruitment, offer acceptance rate by gender, time-to-hire by gender, retention rate of hires by gender, gender diversity in sourced candidates, success rate of gender-focused recruitment campaigns, gender pay gap analysis, percentage of leadership roles held by each gender, gender ratio by department, gender ratio in referral hires, feedback on gender-focused initiatives, promotion rate by gender, turnover rate by gender, diversity and inclusion program effectiveness |
Hiring Velocity Dashboard
A Hiring Velocity Dashboard breaks down how quickly roles are filled. Metrics include time-to-hire, open roles filled per month, and average time spent at each stage.
Drawn-out interviews or slow decisions show up here before you lose candidates to faster-moving competitors. Seasonal patterns become visible too, so you can plan ahead for periods when talent is harder to win.
| Who's it for | HR managers, talent acquisition teams, hiring managers, recruiters, recruitment coordinators, department heads, business analysts, reporting analysts |
|---|---|
| How often it's needed | Real-time, daily, weekly, monthly |
| Covered KPIs | Time-to-hire, time-to-fill, average screening time, average interview time, offer acceptance rate, candidate pipeline velocity, applicant processing time, recruitment funnel metrics, source of hire efficiency, candidate drop-off rates, interview-to-offer ratio, application-to-interview ratio, recruitment campaign efficiency, candidate feedback scores, recruiter efficiency metrics, job vacancy duration, onboarding time by department, job offer issuance rate, candidate engagement during hiring, cost per hire, candidate experience ratings |
Salary Comparison Dashboard
A Salary Comparison Dashboard shows how your pay ranges stack up against market data. You can see which roles are underpaid relative to the market and where spend is high for the value delivered.
With that context, you can adjust pay decisions to improve offer acceptance and reduce the turnover that comes from being consistently out-competed on compensation.
| Who's it for | HR managers, finance teams, department heads, senior management, hiring managers, recruitment coordinators, business analysts, reporting analysts |
|---|---|
| How often it's needed | Real-time, daily, weekly, monthly, yearly |
| Covered KPIs | Average salary by role, salary range by position, salary vs. industry average, geographical salary comparison, gender pay gap analysis, pay equity metrics, salary distribution by department, compensation package effectiveness, bonus and incentive structure, cost of living adjustments, salary progression over time, employee satisfaction with compensation, retention rates based on salary competitiveness, impact of salary changes on recruitment, job offer acceptance rate, market salary trends, internal salary alignment, payroll budget utilization, salary negotiation success rate, salary-related turnover rate |
Job Offer Dashboard
A Job Offer Dashboard tracks offers accepted, declined, or pending. Trends like hard-to-fill roles or offers priced below market become clear, and you can see decision time by role so slow approvals don't cost you candidates.
| Who's it for | HR managers, talent acquisition teams, hiring managers, recruitment coordinators, department heads, senior management, finance teams, business analysts, reporting analysts |
|---|---|
| How often it's needed | Real-time, daily, weekly, monthly |
| Covered KPIs | Job offer acceptance rate, job offer decline rate, time-to-fill, time-to-hire, cost-per-hire, offer acceptance by role, offer decline reasons, offer approval process time, candidate feedback on offer process, recruitment funnel metrics, candidate experience score, onboarding success rate, impact of salary on offer acceptance, impact of benefits on offer acceptance, offer negotiation success rates, diversity of hires, candidate retention post-offer, acceptance rate by recruitment channel, conversion rate from interview to offer, speed of offer generation, competitive offer analysis, efficiency of offer approval workflows |
Interview Scheduling Dashboard
An Interview Scheduling Dashboard keeps interviews, rooms, and interviewer availability in one place so you can avoid conflicts and book faster.
Time to schedule by role surfaces bottlenecks like slow responses or too many interview rounds before they push candidates toward other offers.
| Who's it for | HR managers, hiring managers, recruitment coordinators, department heads, senior management, team leaders, business analysts, reporting analysts |
|---|---|
| How often it's needed | Real-time, daily, weekly, monthly |
| Covered KPIs | Number of scheduled interviews, interview cancellation rate, interview rescheduling rate, time from application to interview, interviewer availability metrics, candidate no-show rate, time spent on scheduling, candidate satisfaction with the scheduling process, interviewer feedback on scheduling efficiency, interview panel diversity, impact of scheduling on candidate experience, interview slot utilization rates, scheduling process completion time, interview-to-offer conversion rate, response time to scheduling requests, scheduling conflict resolution rate, candidate feedback on interview process |
Create custom dashboards for you and your team.
Get started with KlipsKnow what's happening in your pipeline
Recruitment moves fast. Candidates accept other offers, roles go unfilled longer than planned, and costs quietly climb while the data sits in disconnected systems.
A Recruitment Dashboard puts the numbers you need in one place, updated automatically, so you always know where things stand without having to ask. Klips connects to your HR tools and keeps your hiring metrics front and centre.