Ticket Analysis
Understand what types of tickets are being submitted to your help desk.
Tickets by type
What is Ticket Analysis?
Ticket Analysis is a breakdown of the types, sources, and patterns behind support tickets submitted to your help desk. It tells you not just how many tickets came in, but why, and what to do about it.
When you know where volume clusters, what's driving reopens, and which categories spike after a release, you can make decisions that reduce tickets at the source rather than just working through the queue.
What Ticket Analysis tracks
Ticket Analysis organizes your support data by the dimensions that matter most:
Ticket type: questions, bugs, billing issues, feature requests
Priority level: how urgently tickets need to be resolved
Assigned agent or team: who owns what, and where workload concentrates
Ticket source: email, chat, phone, or self-serve portal
Together, these dimensions reveal patterns that raw volume numbers hide.
What to look for
Once you have your data organized, focus on these signals:
Top categories and topics: Where volume clusters tells you where customers are struggling most.
Backlog drivers: Categories with long handle times or frequent reopens point to unresolved root causes.
Source patterns: Email vs. chat vs. phone behaviour often reflects how different customer segments prefer to reach you.
Release impact: Spikes after a launch or policy change connect product decisions to support load.
A high proportion of "question" tickets, for example, is a signal that documentation or in-product guidance has a gap. That's a content problem, not a support problem, and fixing it reduces ticket volume without adding headcount.
Success indicators
Ticket Analysis is working when you see:
Fewer repeat categories over time, as root causes get addressed
Shorter handle times on common ticket types, as routing and documentation improve
Declining volume on self-serviceable questions, as content gaps get filled
How to act on Ticket Analysis insights
The value of Ticket Analysis is in what it prompts you to do. Three high-impact actions:
Fill content gaps. Convert common questions into clear documentation, FAQs, and in-product help. If 20% of your tickets are the same question, the answer belongs in your knowledge base, not your queue.
Strengthen routing. Send complex topics to senior queues. Build specialty handling for recurring workflows that frontline agents consistently escalate.
Fix root causes upstream. Share category patterns with product and operations so they can remove the friction that's generating tickets in the first place. Support shouldn't absorb problems that belong to another team.
Track Ticket Analysis in Klips
Pulling this data manually from your help desk platform, reformatting it, and sharing it with stakeholders takes time and introduces errors. A Klips dashboard automates that work.
Connect your help desk. Bring in tickets from your platform with fields for category, priority, status, assignee, and source.
Normalize categories. Clean up naming conventions so reports roll up consistently and comparisons hold.
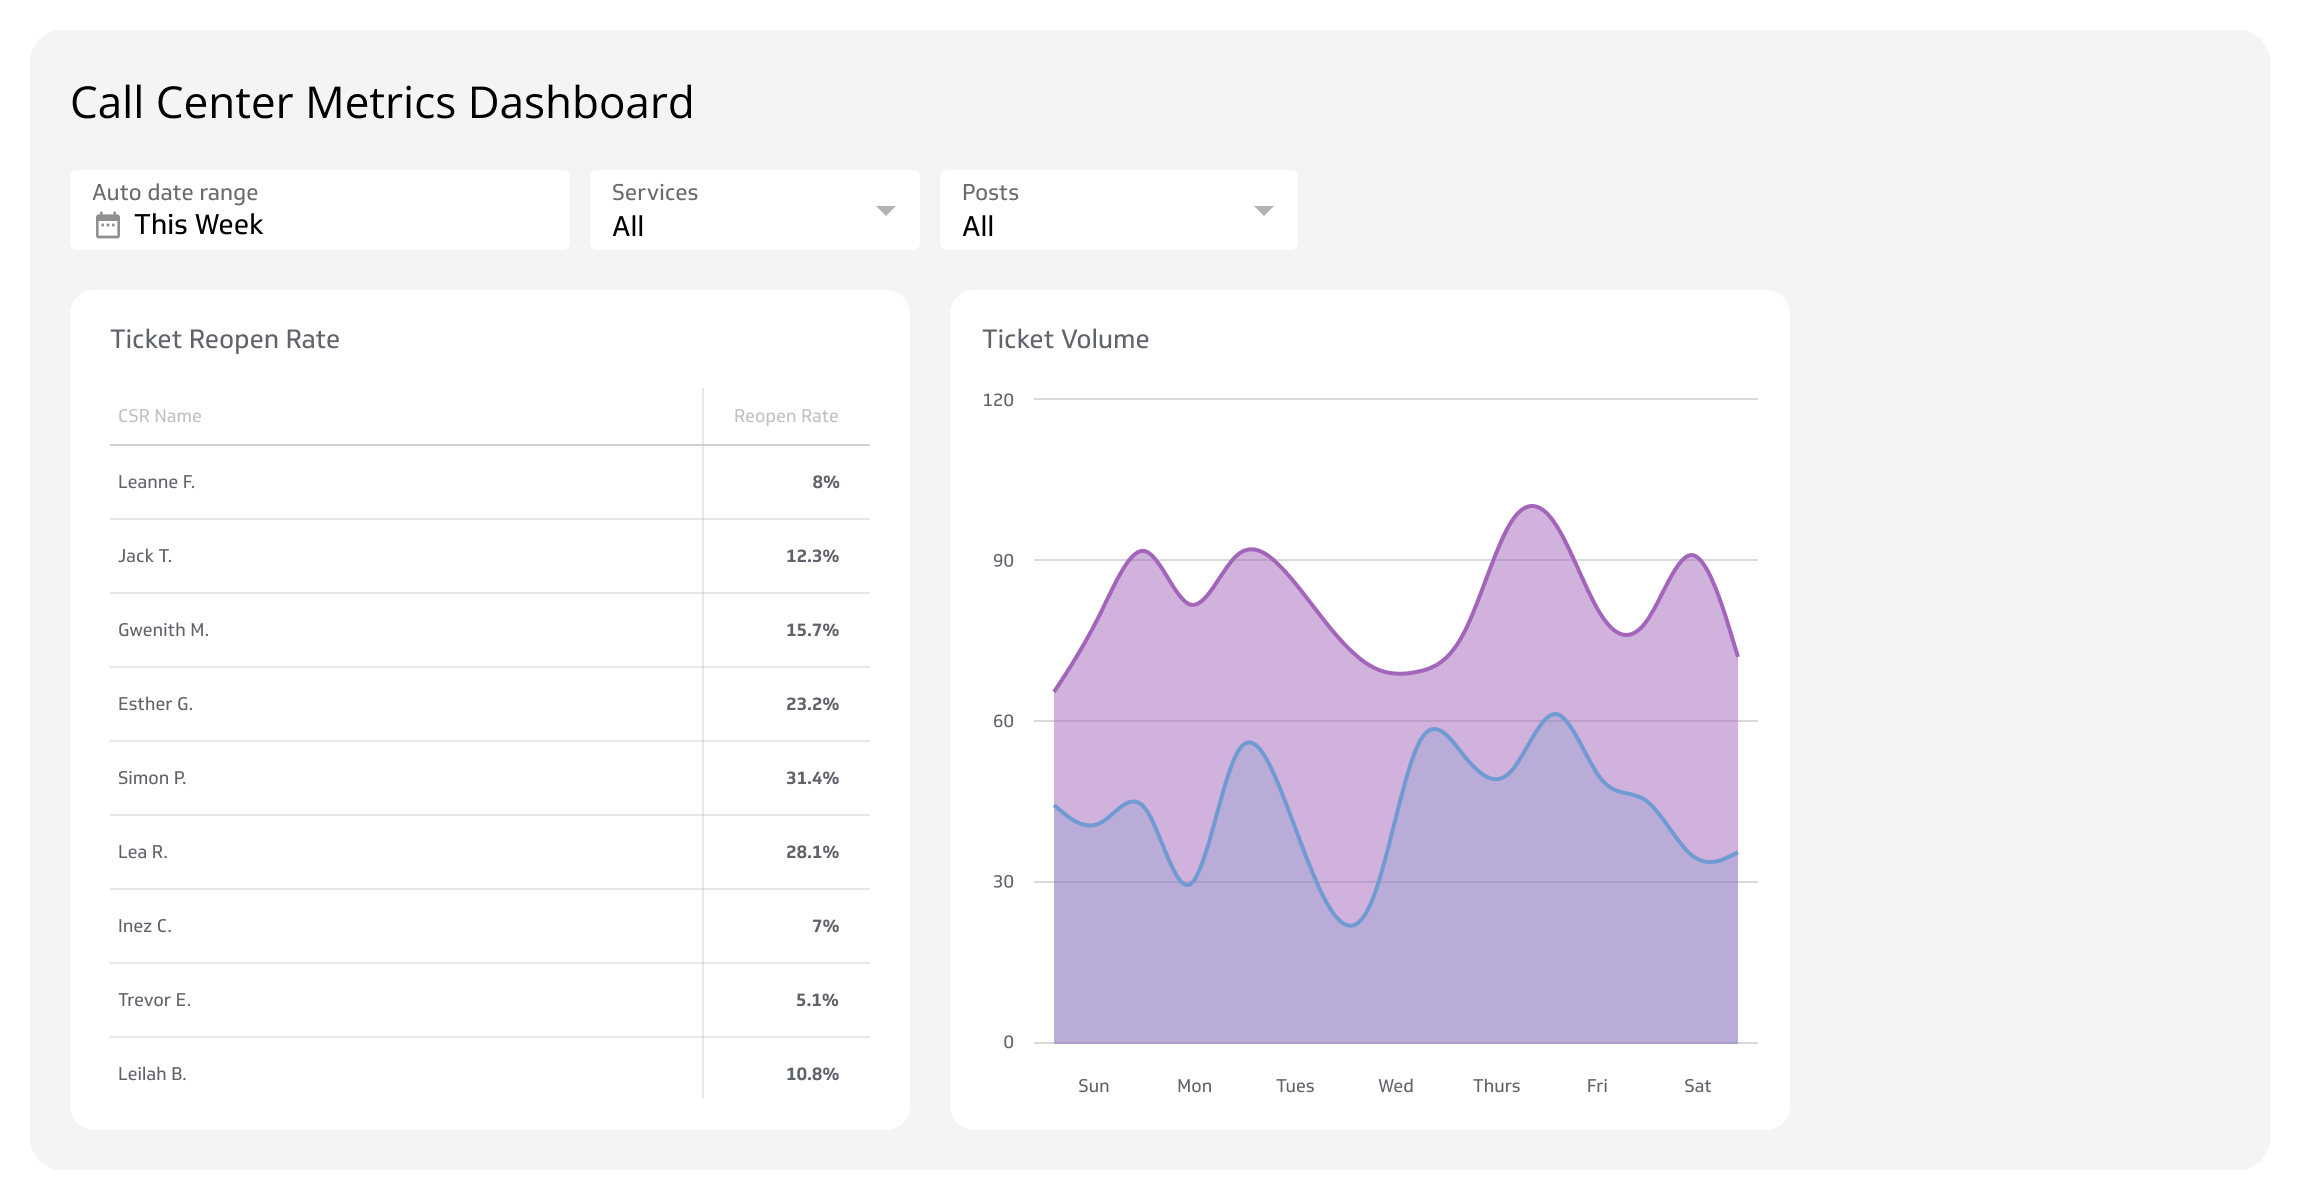
Visualize the right views. A stacked bar by category, a line for total volume over time, and a table of top article requests give you the full picture at a glance.
Drill by time period. Compare volume before and after a release, a campaign, or a policy change to isolate cause and effect.
Share automatically. Send a weekly summary to product, support, and operations without anyone having to pull it manually.
That's the difference between knowing your ticket patterns and having to go find them every time someone asks.
Create custom dashboards for you and your team.
Get started with KlipsCommon pitfalls
Even good data can mislead if the setup is wrong. Watch for these:
Too many categories. Long picklists produce messy, inconsistent data. Keep the taxonomy simple and train agents to use it the same way.
Missing root-cause fields. Category alone tells you what kind of ticket came in. A root-cause field tells you why, which is what drives action.
Ignoring seasonality. Holidays, billing cycles, and renewal periods can mask or amplify product issues. View year-over-year trends alongside recent data to separate signal from noise.