SaaS Marketing Dashboard
Your real-time command centre for marketing performance.
A SaaS Marketing Dashboard gives you instant visibility into whether your marketing is actually growing the business, not just generating activity.
For a SaaS company, the ability to respond to shifts in lead flow and campaign performance without waiting for a weekly report is what separates teams that move fast from those that are always catching up.
Your data is rarely in one place. Ad spend lives in one platform, web analytics in another, and trial sign-ups in your product database. A dashboard pulls those sources together into a single, always-on view so you spend less time assembling numbers and more time acting on them.
What is a SaaS Marketing Dashboard?
A SaaS Marketing Dashboard is a real-time reporting tool that centralizes your key marketing metrics, from lead generation to customer acquisition, into a single view your team can act on daily.
Instead of manually pulling numbers from multiple platforms, you get a live feed of performance data that keeps your team aligned and focused on what drives growth.
Key metrics for your SaaS Marketing Dashboard
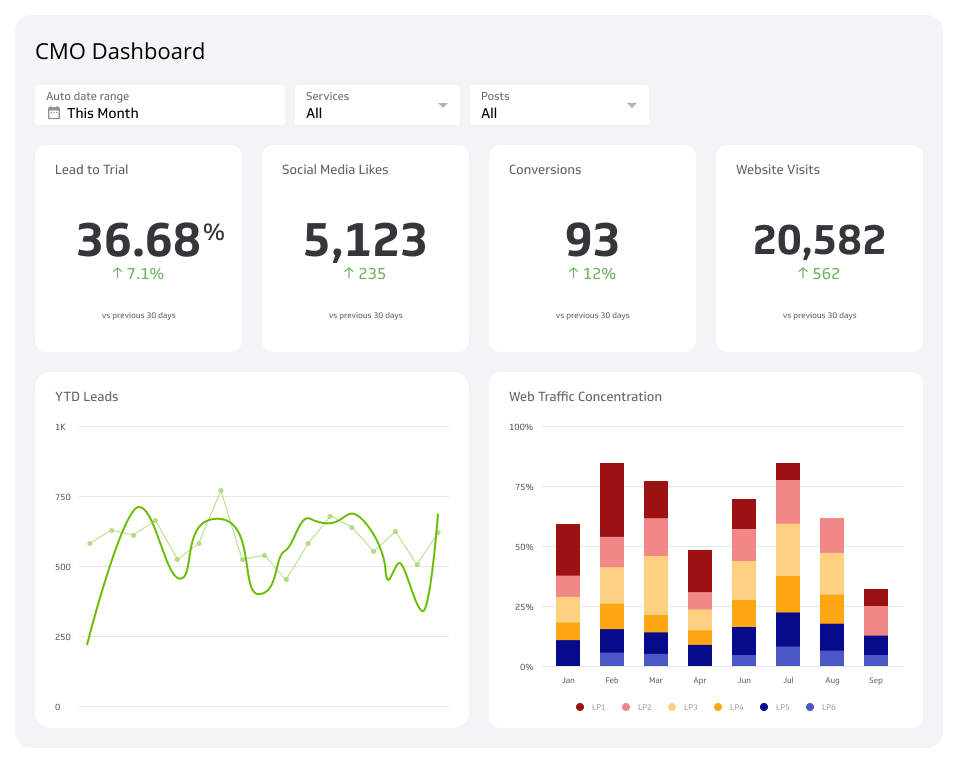
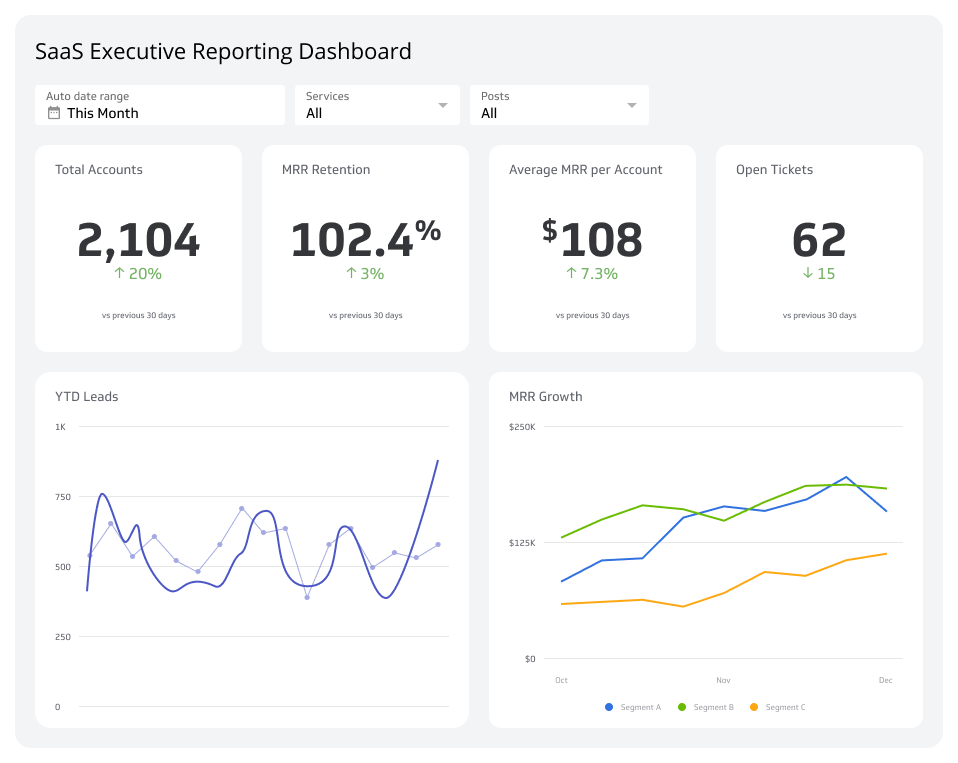
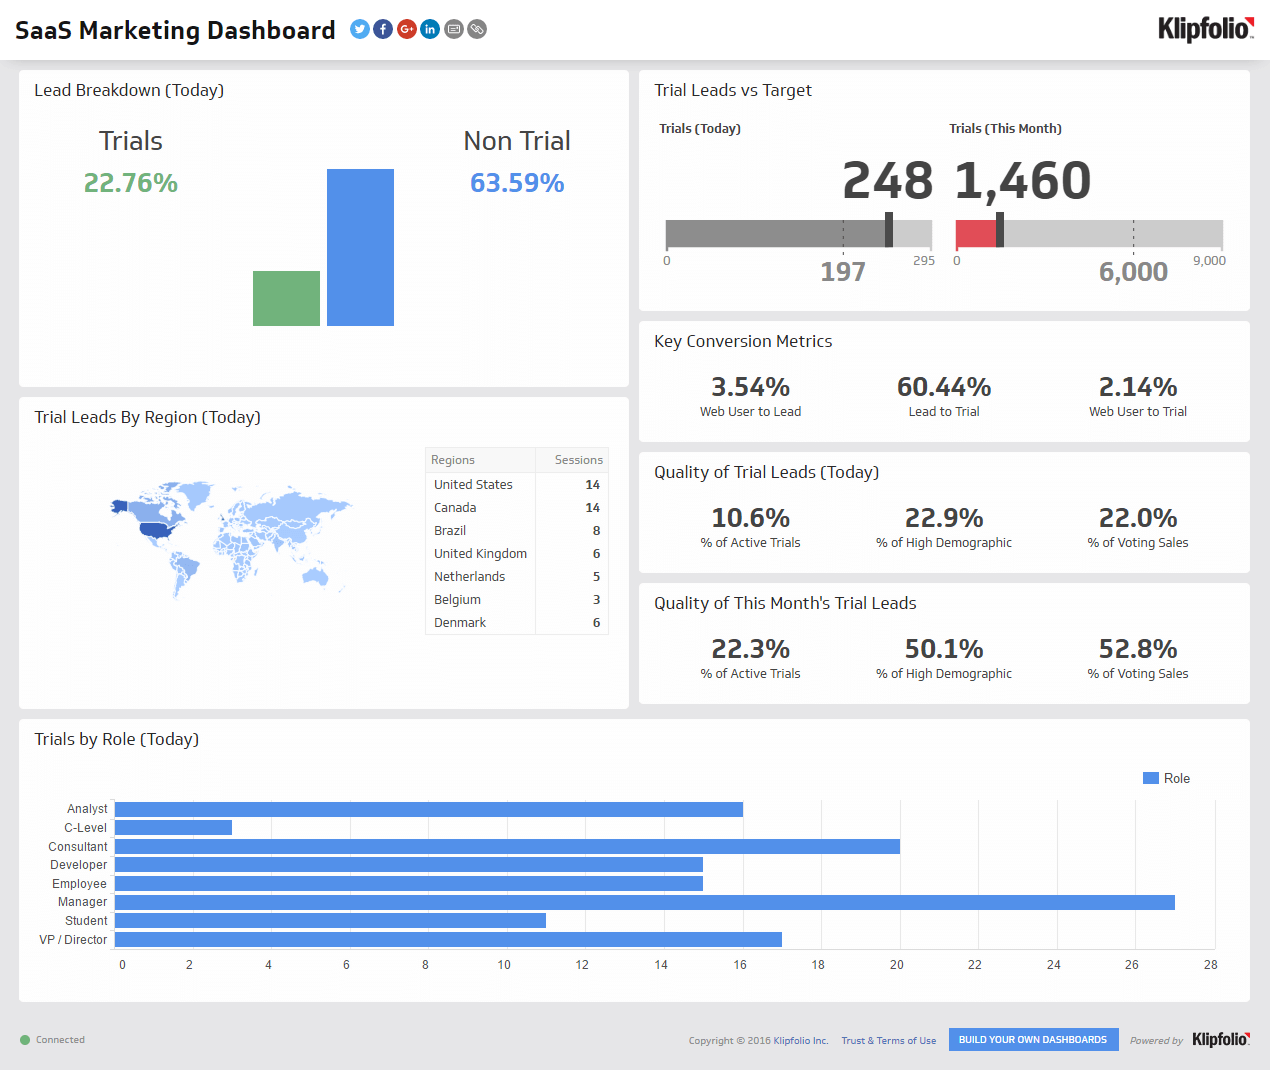
SaaS marketers often place extra importance on leads generated through a free trial program. These leads have invested time in learning the product and are typically of much higher quality than standard inbound leads. This SaaS dashboard examines the performance of trial leads against a monthly, moving target and provides a quick analysis of lead quality.
Here are the essential metrics to monitor:
Marketing Qualified Leads (MQLs): MQLs represent the top of your funnel. Tracking MQLs daily tells you whether your campaigns are generating enough initial interest to feed your sales pipeline.
Trial sign-ups: Trial sign-ups are a primary indicator of product interest. Monitoring volume and quality shows how effectively your marketing converts prospects into active evaluators.
Lead-to-Customer Conversion Rate: This metric measures the efficiency of your entire funnel. It tells you what percentage of leads become paying customers, helping you forecast revenue and assess whether the right people are entering the top of your funnel.
Customer Acquisition Cost (CAC): CAC tracks the health of your marketing spend. Knowing what it costs to acquire a new customer is essential for building a growth model you can sustain and scale with confidence.
When these metrics live in one place and refresh automatically, you stop assembling reports and start running your marketing engine on reliable, consistent numbers.
Why a dedicated SaaS Marketing Dashboard matters
Generic reporting tools give you data. A purpose-built SaaS Marketing Dashboard gives you answers.
When your metrics are scattered across ad platforms, CRM records, and analytics tools, you spend more time assembling reports than acting on them. A centralized dashboard eliminates that lag. You see what's working, what's stalling, and where to focus without waiting for a manual export or pasting numbers into a spreadsheet to figure out the story yourself.
For SaaS marketing teams specifically, this matters because the customer acquisition funnel is long and multi-touch. A lead might discover you through paid search, evaluate you through a free trial, and convert weeks later through a nurture sequence. Without a unified view, it's difficult to attribute results accurately or catch early warning signs before they affect revenue.
A well-built dashboard doesn't just show you what happened. It keeps you on top of what's happening now, so you're not the last person in the room to know something has shifted.
How to build your SaaS Marketing Dashboard
A strong SaaS Marketing Dashboard connects directly to the tools your team already uses. Common data sources include:
Ad platforms (Google Ads, LinkedIn, Meta) for spend, impressions, and click-through rates
Web analytics (GA4) for traffic, session quality, and conversion events
CRM (HubSpot, Salesforce) for lead volume, MQL status, and pipeline contribution
Product database for trial sign-up volume and activation rates
Once your sources are connected, organize your dashboard around the funnel stages that matter most: awareness, acquisition, activation, and revenue. Group related metrics together so your team can scan performance at a glance and drill into anything that needs attention.
Refresh rates matter too. For high-velocity paid campaigns, hourly or same-day data lets you course-correct quickly. For strategic planning, daily or weekly views are usually sufficient.
Create custom dashboards for you and your team.
Get started with KlipsGetting started with Klipfolio Klips
Ready to build a dashboard that gives you a complete view of your lead generation tracking and marketing funnel? Klipfolio Klips connects to 130+ data sources and lets you build fully customized dashboards with Excel-like formulas, rich visualizations, and flexible distribution options, including TV mode, scheduled email reports, and public links.
Your team gets real-time visibility into numbers they can trust. You get a growth engine that runs on accurate, centralized data, without anyone having to chase it down.