Order Frequency
Measure the average number of orders received during a specific time period, such as a day, week, or month.
Order Frequency
What is Order Frequency?
Order Frequency is the average number of orders received during a specific time period, such as a day, week, or month.
Sales managers use Order Frequency to anticipate workload, spot buying pattern changes, and assess whether sales efforts are producing consistent demand.
Why Order Frequency matters
Knowing how often customers place orders gives you more than a count. It tells you whether demand is building, holding steady, or slipping, and it gives you something concrete to act on before a trend becomes a problem.
A rising Order Frequency signals healthy customer engagement and effective sales activity. A falling one can point to churn risk, seasonal softness, or a gap in your follow-up process. Either way, you know where to look.
For teams managing fulfilment, inventory, or staffing, Order Frequency also helps you plan ahead. When you know how many orders are likely to arrive this week, you stop reacting and start preparing.
How to calculate Order Frequency
The calculation depends on what you are measuring: total orders across all customers, or how often individual customers buy.
Total orders per period:
Order Frequency = Total orders received / Number of time periods
Per-customer order frequency:
Order Frequency = Total orders / Number of unique customers
Example: If 320 orders came in over four weeks, your weekly Order Frequency is:
320 / 4 = 80 orders per week
If those 320 orders came from 64 customers, each customer ordered an average of:
320 / 64 = 5 times over the period
Both views are useful. The aggregate tells you about demand volume; the per-customer view tells you about buying behaviour and loyalty.
What a good Order Frequency looks like
There is no universal benchmark. Order Frequency varies significantly by industry, product type, and sales model. What matters most is your own trend over time.
A few reference points worth tracking:
Your baseline. Establish what normal looks like for your business before drawing conclusions from any single period.
Period-over-period change. A 15% drop in weekly order frequency is a signal worth investigating, even if the absolute number still looks healthy.
Segment differences. High-value customers may order less frequently than smaller accounts. Tracking Order Frequency by segment tells a more useful story than a single average.
As a starting point, many sales teams set weekly or monthly targets and track against them. An example target: 64 orders per week.
Order Frequency and related metrics
Order Frequency does not tell the whole story on its own. Pair it with related metrics to understand what is driving the number.
Average Order Value: If Order Frequency rises but Average Order Value falls, total revenue may stay flat. Tracking both tells you whether volume growth is actually translating into more revenue.
Customer Lifetime Value: Customers who order frequently tend to have higher lifetime value. A drop in Order Frequency among your best accounts is an early warning sign worth catching early.
Churn rate: Customers who stop ordering are churning, even if they have not formally cancelled. Order Frequency is one of the clearest behavioural signals of churn risk.
Sales Quota Attainment: If your team is hitting quota but Order Frequency is declining, you may be relying on fewer, larger orders, which can signal pipeline fragility.
How to track Order Frequency
Tracking Order Frequency manually in a spreadsheet works at low volume, but the signal gets harder to trust as order data grows and spans multiple sources.
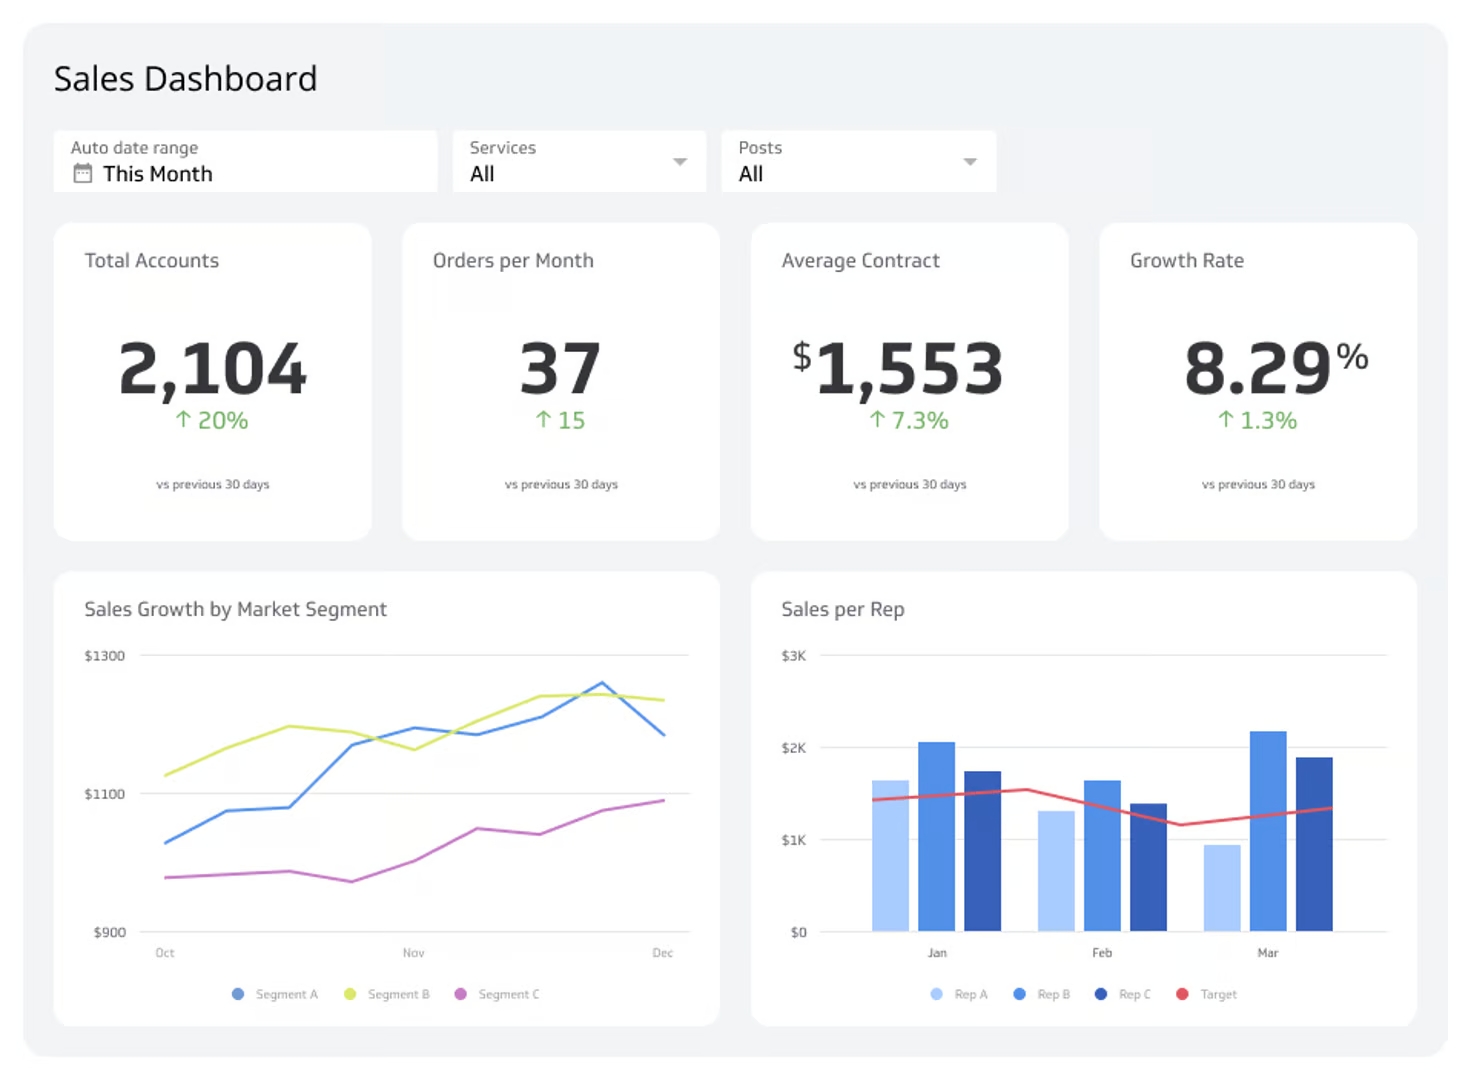
A dashboard connected to your order management system, CRM, or e-commerce platform keeps the number current without someone having to pull it. You see the trend in real time, across whatever time period matters to you, without waiting for a weekly report or asking someone to compile the data.
Klips connects to 130+ data sources and lets you build a sales dashboard that surfaces Order Frequency alongside the metrics your team needs to act on. The numbers update automatically, stay consistent across your team, and are visible to everyone who needs them.
Create custom dashboards for you and your team.
Get started with KlipsReporting details
| Field | Detail |
|---|---|
| Reporting frequency | Monthly (weekly tracking recommended) |
| Example target | 64 orders per week |
| Audience | Sales Manager, Sales Team, VP/Director |
| Variations | Orders per day, orders per week, orders per month; per-customer order frequency |