Agent Utilization
Measure the percentage of time agents spend actively working on calls and call-related tasks.
Agent Utilization
What is Agent Utilization?
Agent Utilization is the percentage of time your agents spend actively working on calls and call-related tasks during their shift. It's a core call center metric for understanding workforce efficiency and whether your team is staffed at the right level to meet demand.
Overview
Call volume fluctuates throughout the day. Agents cycle through busy stretches and slower periods. Agent Utilization helps you track those patterns so you can keep agents productive without pushing them toward burnout.
The insight this metric delivers isn't just operational. It tells you whether the people accountable for customer experience have the bandwidth to do their jobs well, or whether they're being stretched too thin to deliver consistent results.
Why Agent Utilization matters
High utilization shows that agents are spending paid time productively. But maximizing utilization at all costs is the wrong goal. Agents need time for after-call work (documentation, follow-ups), breaks, and moments to reset. Industry best practice sits between 75% and 85%, high enough to be efficient, low enough to protect quality and agent wellbeing.
Without visibility into this number, you're either overstaffing and absorbing unnecessary payroll costs, or understaffing and watching quality decline without knowing why. Either way, you're making staffing decisions based on instinct instead of evidence.
Tracking Agent Utilization helps you:
- Optimize staffing: Identify whether you're over- or under-resourced during specific periods.
- Improve scheduling: Align agent availability with call volume patterns.
- Monitor agent health: Catch burnout risk before it shows up as turnover.
- Control costs: Reduce idle time and unnecessary overtime.
How to calculate Agent Utilization
Agent Utilization = (Total productive time / Total logged-in time) × 100
Where:
- Total productive time: Time spent on calls plus time on after-call work (documentation, follow-ups, and similar tasks).
- Total logged-in time: The full shift, including breaks, training, and idle time.
Example: An agent works an 8-hour shift (480 minutes) and spends 390 minutes on calls and call-related work. Their utilization is (390 / 480) × 100 = 81.25%.
Reporting frequency
Track Agent Utilization monthly, with weekly or daily spot-checks to catch trends before they become problems. A number that looks fine at month-end can mask a brutal mid-month stretch that's already affecting your team.
KPI target
75% to 85% utilization. The right target varies by industry and call center type, but sustained utilization above 85% is a warning sign worth acting on.
Who tracks this metric
Call center managers and operations leaders use Agent Utilization to make staffing and scheduling decisions. Team leads monitor it daily to maintain balanced workloads and flag emerging pressure on their teams.
Related metrics
- Average Handle Time (AHT): How long agents spend per call, including after-call work.
- Service Level: The percentage of calls answered within a target time threshold (for example, within 20 seconds).
- Occupancy Rate: Similar to Agent Utilization, but often includes only active call time, excluding breaks and training.
- Agent Attrition Rate: Turnover, which tends to climb when utilization stays unsustainably high.
How to monitor Agent Utilization with Klipfolio
Tracking Agent Utilization in a spreadsheet or pulling numbers manually from your call center platform means you're always looking at yesterday's data. By the time you spot a problem, it's already affected your team.
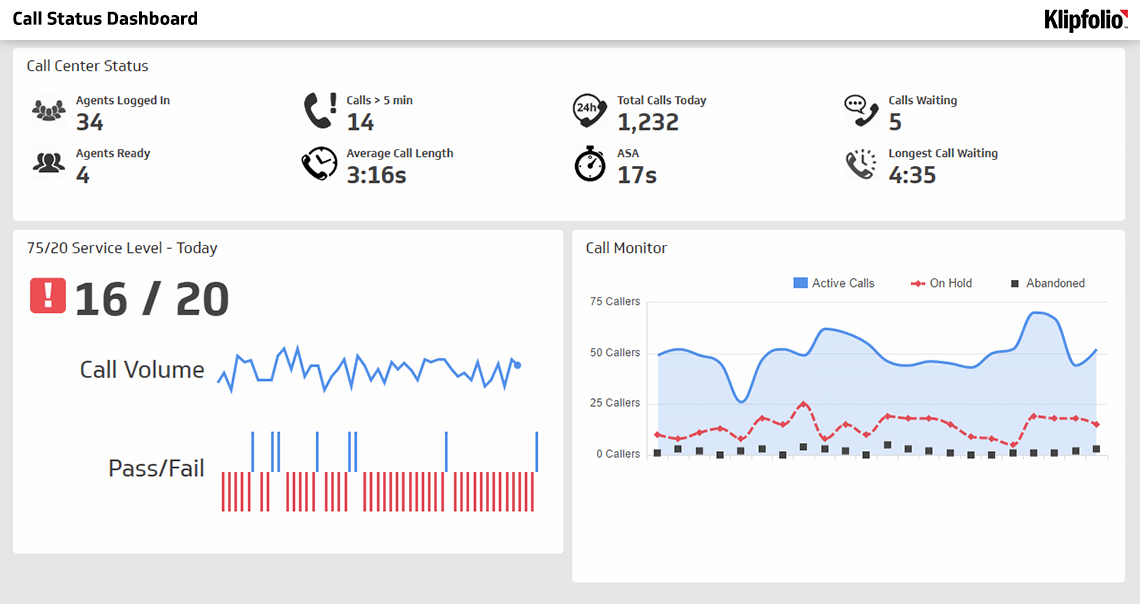
Klips dashboards connect directly to call center platforms like Zendesk, Five9, and NICE, pulling live data so you can see utilization by agent, team, or time period without waiting for someone to compile a report. Set alerts for when utilization dips below or climbs above your target range, and you'll know when to adjust staffing before the shift ends, not after the week closes.
A well-designed dashboard shows:
- Current utilization by agent: See who's overloaded and who has capacity, right now.
- Team utilization trends: Track the past 30 days to spot patterns, not just spikes.
- Utilization by shift or time of day: Identify when pressure peaks so you can staff accordingly.
- Comparison to your target range: Know at a glance whether you're operating in a healthy zone.
That visibility means managers spend less time chasing numbers and more time acting on them.
Create custom dashboards for you and your team.
Get started with KlipsKey takeaway
Agent Utilization is a balancing act. Too low, and you're carrying payroll costs without the output to justify them. Too high, and agents burn out, quality drops, and turnover climbs. Pair this metric with Service Level and Average Handle Time, and you'll have a clear, reliable picture of how your call center is actually performing.