Sales KPI Dashboard
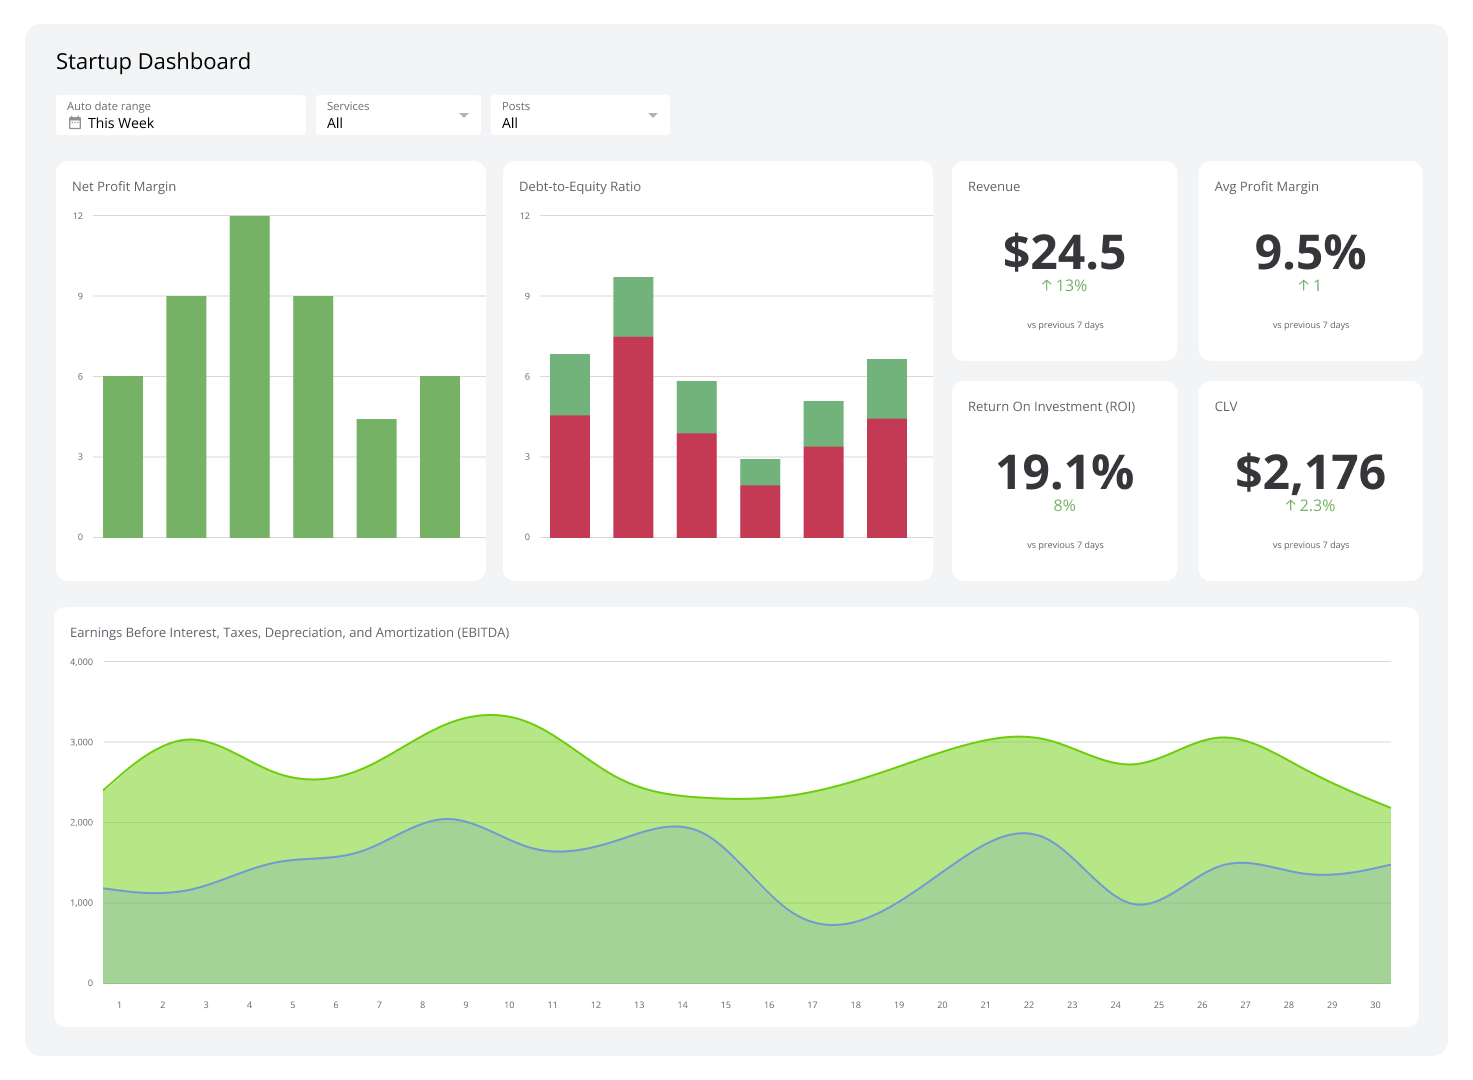
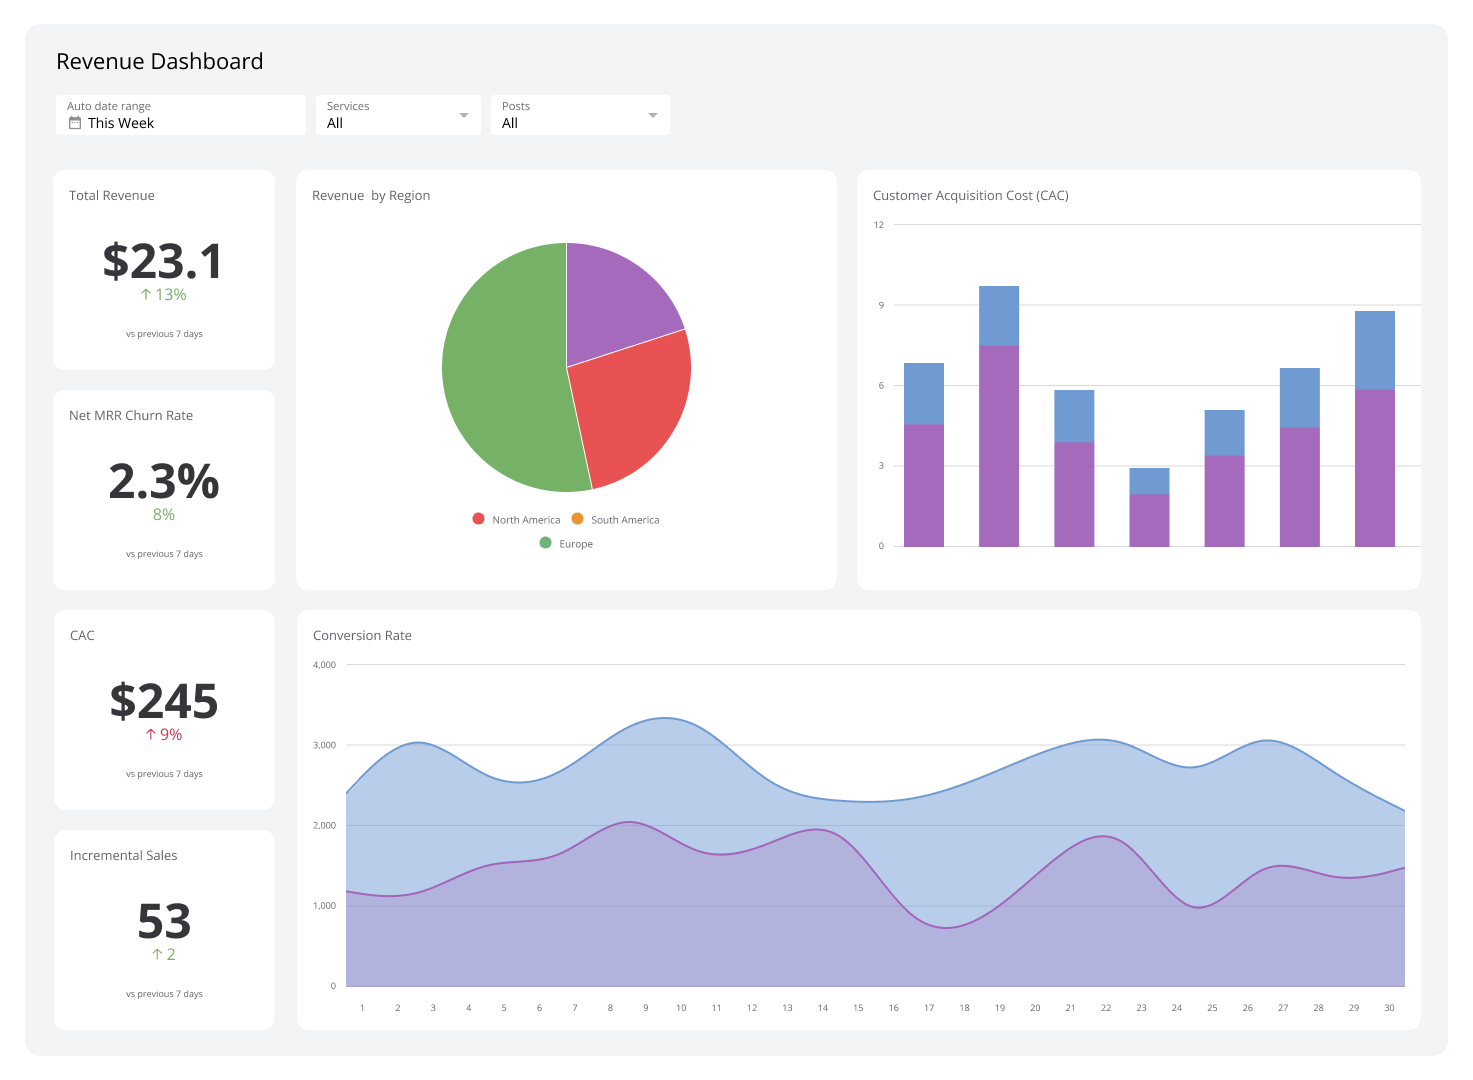
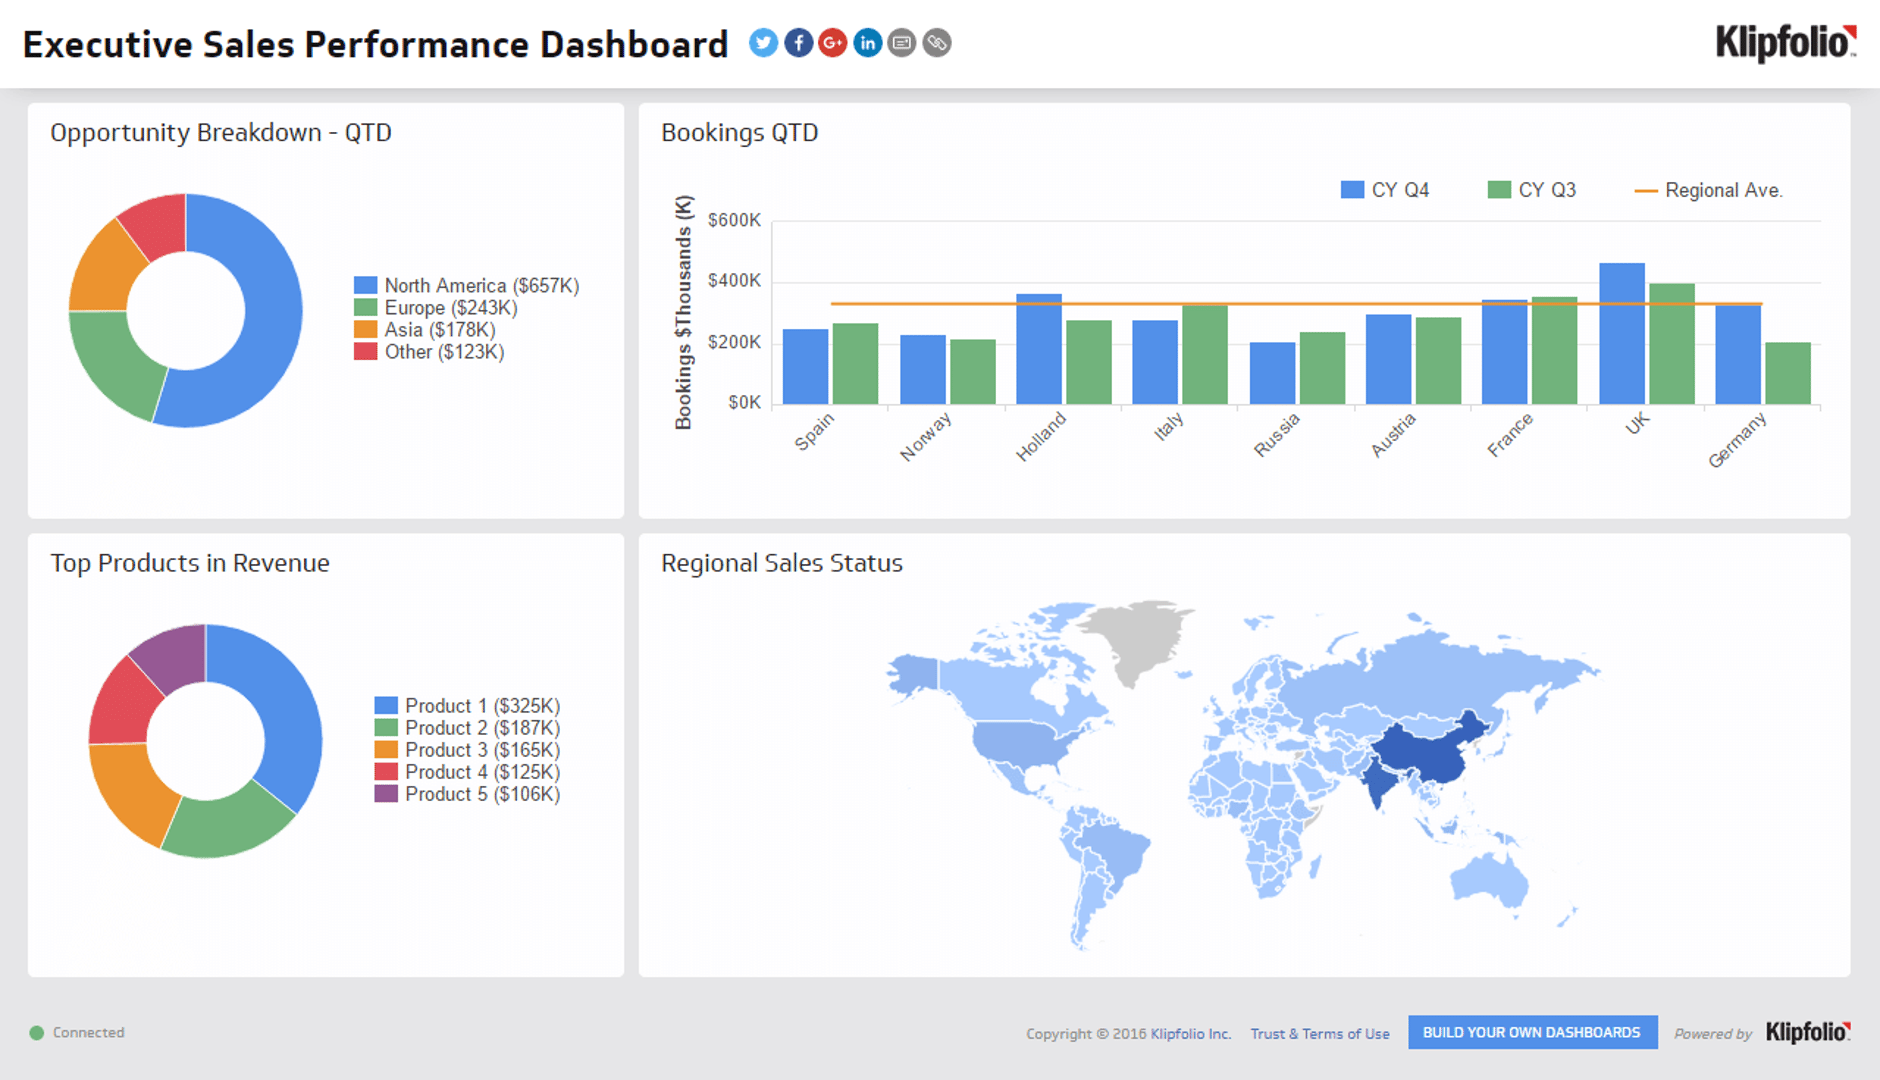
A sales KPI dashboard brings your revenue metrics together in one place so you can see what's working, what isn't, and what to do next.
What is a Sales KPI Dashboard?
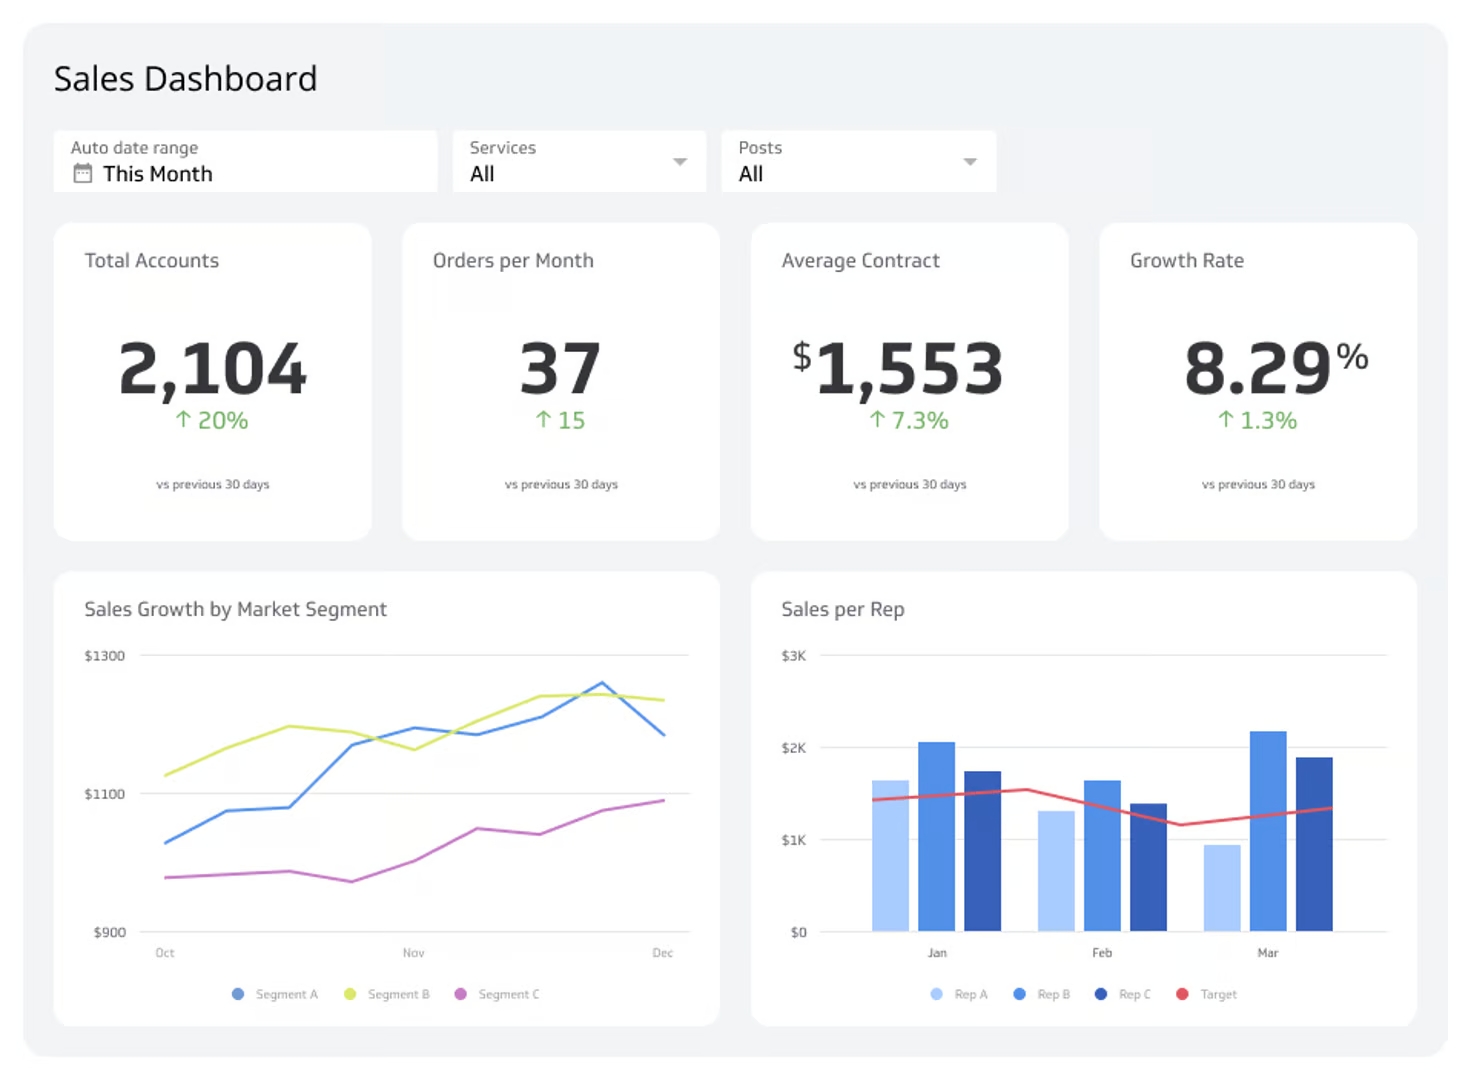
A sales KPI dashboard is a visual display of the metrics that show how well your company generates revenue. It brings your sales numbers together in one place so you can see what's working, what isn't, and what to do next.
In Klips, you connect apps, spreadsheets, databases, and APIs, then centralize that data into clear charts, tables, and visuals that anyone on your team can read. Live or scheduled refreshes mean the numbers you're looking at are always current, without anyone having to pull a report.
Examples of Sales KPI Dashboards
Sales Growth Dashboard
Sales growth tracks how your revenue is increasing over time and surfaces the factors behind it. Its critical components include total revenue, average deal size, and sales cycle length.
Knowing where growth is coming from helps you make smarter decisions: which products to prioritize, where to focus your team's energy, and how to avoid leaving revenue on the table.
| Who's it for | Sales managers, company executives, finance departments, investors |
|---|---|
| How often it's needed | Daily, weekly, monthly, quarterly, yearly |
| Related metrics | Sales conversion rate, sales growth, average profit margin, revenue per employee, customer retention rate, market penetration, sales cycle length, revenue per customer |
State of Sales Dashboard
The State of Sales Dashboard gives leadership a complete picture of current sales performance. It draws on revenue trends, team productivity, and market penetration to answer the question every exec needs answered: are we on track?
Reviewing this KPI regularly helps you stay ahead of unexpected market shifts, whether that's a demand drop, a price movement, or a change in competitive position, and adjust strategy before small problems become large ones.
| Who's it for | Company leadership, board members, sales directors, senior management |
|---|---|
| How often it's needed | Monthly, quarterly, yearly |
| Related metrics | Revenue growth rate, sales pipeline velocity, customer acquisition cost (CAC), customer lifetime value (CLV), win rate, average deal size, sales team productivity metrics, market share |
Sales Rep Performance Dashboard
A Sales Rep Performance Dashboard shows how each member of your team is performing across customer interactions, deal volume, and conversion rates. It tells you who's excelling, who needs support, and why.
That clarity makes it easier to build better training, coach to specific gaps, and create the conditions where your whole team performs more like your best reps.
| Who's it for | Sales managers, team leaders, individual sales reps |
|---|---|
| How often it's needed | Weekly, monthly, quarterly |
| Related metrics | Sales quota attainment, number of closed deals, average deal size, sales cycle duration, lead response time, customer satisfaction scores, product mix, upsell/cross-sell rates |
Forecasting Dashboard
A Forecasting Dashboard gives you a forward-looking view of your sales pipeline. By examining projected revenue, market trends, and anticipated developments, it helps you anticipate what's coming rather than react to it.
That visibility is what separates a confident pricing or hiring decision from a guess. When demand is outpacing supply, you'll know it early enough to act.
| Who's it for | Company leadership, financial planners, sales directors, operations managers |
|---|---|
| How often it's needed | Monthly, quarterly, yearly |
| Related metrics | Historical sales data, sales growth by market segment, sales pipeline value, economic indicators, industry trends, seasonal patterns, new product launch timelines, customer churn rate |
Sales Leaderboard Dashboard
A Sales Leaderboard Dashboard identifies your top performers and the specific practices that make them effective. It's not just a ranking, it's a map of what good looks like.
When you connect individual performance to financial outcomes like revenue growth and profit margins, you can see which behaviours actually move the number, and spread them across the team.
| Who's it for | Sales representatives, sales managers, company leadership, sales operations teams |
|---|---|
| How often it's needed | Daily, weekly, monthly |
| Related metrics | Individual sales performance, team rankings, conversion rates, deals closed, revenue generated per representative, quota attainment, average deal size, sales cycle length |
Sales Cycle Length Dashboard
Sales cycle length is the time it takes to close a deal from first contact. Tracking it shows you where prospects stall, where your process is efficient, and where small changes could shorten the path to revenue.
For example, a consistently long decision stage might signal a pricing or messaging issue, not a rep performance issue. The dashboard tells you which it is.
| Who's it for | Marketing teams, economic analysts, sales managers, company executives, customer success teams |
|---|---|
| How often it's needed | Weekly, monthly, quarterly |
| Related metrics | Conversion rate, lead-to-opportunity ratio, average deal size, win rate, time to revenue, CAC, sales velocity, lead response time |
Percent Closing Ratio Dashboard
The percent closing ratio measures how often sales quotes convert into closed deals. It's one of the clearest signals of whether your closing process is working.
When the ratio is low, the dashboard helps you find out why: weak proposals, poor follow-up, or leads that weren't qualified well enough to begin with. Fix the right thing, and the number moves.
| Who's it for | Sales managers, sales representatives, company executives, pricing teams |
|---|---|
| How often it's needed | Weekly, monthly, quarterly |
| Related metrics | Win rate, average deal size, sales cycle length, proposal acceptance rate, discount frequency, sales forecast accuracy, Customer Acquisition Cost, sales velocity |
Sales Conversion Dashboard
The Sales Conversion Dashboard shows how leads move through your funnel and where they drop off. If conversion falls sharply at a particular stage, you have a specific problem to solve, not a vague "sales is underperforming" conversation.
Understanding what drives conversion, whether that's brand recognition, rep behaviour, or messaging, helps you make targeted improvements instead of broad ones.
| Who's it for | Sales managers, marketing teams, company executives, sales representatives |
|---|---|
| How often it's needed | Daily, weekly, monthly, quarterly, yearly |
| Related metrics | Lead quality, average deal size, sales cycle length, CAC, win rate, sales velocity, return on marketing investment, lead response time |
Sales Opportunity Dashboard
A Sales Opportunity Dashboard estimates your team's ability to generate future revenue. Like forecasting, it pulls from pipeline velocity, win rate, conversion rates, and sales cycle length to give you a probabilistic view of what's likely to close.
That view helps you allocate resources to the right deals, set realistic targets, and avoid the surprise of a pipeline that looked full but wasn't.
| Who's it for | Sales managers, sales representatives, company executives, revenue operations teams |
|---|---|
| How often it's needed | Daily, weekly, monthly, quarterly |
| Related metrics | Pipeline velocity, win rate, average deal size, sales cycle length, lead-to-opportunity conversion rate, opportunity-to-close ratio, forecast accuracy, sales quota attainment |
Pipeline Generation Dashboard
Pipeline generation covers the full process of cultivating and managing sales prospects, from initial contact to closed deal. Tracking it tells you whether your market outreach is working and whether the leads coming in are worth pursuing.
It also highlights lead quality early, before weak prospects consume your team's time.
| Who's it for | Sales managers, marketing teams, business development representatives, sales operations |
|---|---|
| How often it's needed | Daily, weekly, monthly, quarterly |
| Related metrics | Lead-to-opportunity ratio, pipeline velocity, sales qualified leads (SQLs), marketing qualified leads (MQLs), opportunity win rate, average deal size, time in pipeline, pipeline coverage ratio |
Sales Lead Dashboard
A Sales Lead Dashboard tracks potential customers by origin, interaction intensity, and demographic profile. That breakdown tells you which acquisition channels are producing quality leads, not just volume.
With that clarity, you can adjust targeting and messaging to attract buyers who are more likely to convert, rather than spending budget on audiences that don't.
| Who's it for | Sales representatives, marketing teams, business development managers, sales operations managers |
|---|---|
| How often it's needed | Daily, weekly, monthly |
| Related metrics | Lead-to-opportunity conversion rate, cost per lead (CPL), lead response time, product qualified leads, MQLs, SQLs, average lead score, lead velocity, lead scoring accuracy |
Win/Loss Rate Dashboard
A Win/Loss Rate Dashboard shows the ratio of deals won to deals lost, and more importantly, the patterns behind each outcome. Some tactics close deals consistently; others don't. This dashboard tells you which is which.
That knowledge makes coaching conversations sharper and strategy decisions easier to defend.
| Who's it for | Sales managers, sales representatives, product managers, company executives |
|---|---|
| How often it's needed | Weekly, monthly, quarterly, yearly |
| Related metrics | Closing ratio, average deal size, sales cycle length, competitive win rate, proposal win rate, forecast accuracy, sales team performance, Customer Acquisition Cost |
Sales Quota Attainment Dashboard
Sales quota attainment measures how consistently your team hits its targets. A high score signals a working strategy; a low score points to something specific: ineffective tactics, inadequate training, poor customer engagement, or resource gaps.
Either way, you're not guessing. You have a number and a direction.
| Who's it for | Finance teams, sales managers, company executives, sales representatives |
|---|---|
| How often it's needed | Weekly, monthly, quarterly |
| Related metrics | Sales pipeline coverage, win rate, average deal size, sales cycle length, quota attainment, revenue per sales rep, Customer Lifetime Value, sales forecast accuracy |
Sales Per Rep Dashboard
Sales per rep shows how much revenue each member of your team brings in. When the number is low, the dashboard helps you find where in the pipeline the gap is, so you can address the actual problem rather than applying a blanket fix.
Targeted coaching, better training, or adjusted compensation all become easier decisions when you know exactly where performance is breaking down.
| Who's it for | Sales managers, company executives, HR departments, finance teams |
|---|---|
| How often it's needed | Weekly, monthly, quarterly |
| Related metrics | Quota attainment, win rate, average deal size, sales cycle length, CAC, sales velocity, pipeline value per rep, revenue per employee |
Average Purchase Value Dashboard
Average purchase value tells you how much a typical customer spends per transaction. It reflects spending behaviour and shows whether your pricing and sales approach are capturing the revenue available in each interaction.
Tracking this metric over time reveals opportunities to grow revenue per customer through better bundling, upselling, or pricing adjustments.
| Who's it for | Sales managers, marketing teams, product managers, finance executives |
|---|---|
| How often it's needed | Weekly, monthly, quarterly |
| Related metrics | CLV, conversion rate, average order quantity, repeat purchase volume, shopping carts abandoned rate, profit margin, sales per customer, upsell/cross-sell rate |
Create custom dashboards for you and your team.
Get started with KlipsSales by Contact Method Dashboard
Different channels produce different results. A sales by contact method dashboard shows which ones are driving revenue and which are consuming effort without return.
That visibility lets you focus investment on the channels that convert, and improve or cut the ones that don't.
| Who's it for | Sales managers, marketing teams, digital strategists, customer experience managers |
|---|---|
| How often it's needed | Weekly, monthly, quarterly |
| Related metrics | Conversion rate by channel, Customer Acquisition Cost by channel, engagement rate, response time, lead quality by source, return on marketing investment, channel preference, CLV |
Product Performance Dashboard
The product performance dashboard shows how each product in your portfolio is contributing to revenue. Tracking it regularly keeps you aware of what's gaining traction and what's falling behind.
With that picture in hand, you can make confident decisions about where to invest marketing budget, which products to develop further, and which to deprioritize.
| Who's it for | Product managers, sales teams, marketing managers, company executives |
|---|---|
| How often it's needed | Weekly, monthly, quarterly |
| Related metrics | Sales volume, market share, customer satisfaction, profit margin, rate of return, inventory turnover, product adoption rate, CLV |
Average New Deal Size Dashboard
The Average New Deal Size Dashboard shows how effectively your team secures high-value contracts. It reflects both negotiation skill and pricing strategy, giving you a clear signal of whether your reps are closing at the right level.
The insight also helps you identify upsell opportunities with existing clients during each interaction, rather than waiting for a formal renewal conversation.
| Who's it for | Sales managers, team leaders, individual sales reps |
|---|---|
| How often it's needed | Weekly, monthly, quarterly |
| Related metrics | Sales quota attainment, number of closed deals, sales rep performance, sales cycle length, win rate, CLV, product mix, average contract value |
Lead-to-Sale Percentage Dashboard
Lead-to-sale percentage measures how effectively your team converts interested prospects into paying customers. A low number tells you something in the process is breaking down; the dashboard helps you find where.
Slow response times, undertrained reps, and low quota attainment all show up here before they show up in revenue.
| Who's it for | Individual sales reps, sales managers, marketing managers, team leaders |
|---|---|
| How often it's needed | Weekly, monthly, quarterly |
| Related metrics | Customer satisfaction scores, number of closed deals, average deal size, sales cycle length, lead response time, product mix, sales quota attainment, upsell/cross-sell rates |
Average Cost Per Lead Dashboard
Average Cost Per Lead tells you how much it costs to bring a new prospect into your pipeline. Tracking it helps you identify which channels are delivering leads efficiently and which are draining budget without results.
Better lead targeting, smarter channel allocation, and regular campaign adjustments based on your sales KPI data all drive this number down and your ROI up.
| Who's it for | Sales managers, team leaders, individual sales reps, marketing managers |
|---|---|
| How often it's needed | Weekly, monthly, quarterly |
| Related metrics | Lead response time, CLV, sales cycle length, upsell/cross-sell rates, win rate, average deal size, CAC, sales quota attainment, net promoter score (NPS) |
Customer Retention Rate Dashboard
Customer retention rate measures how well your company keeps customers after the initial sale. It's also a reliable signal of brand reputation and customer satisfaction.
Improving retention is often more cost-effective than acquiring new customers. Better support, personalized experiences, and loyalty incentives all contribute to a stronger number here.
| Who's it for | Sales managers, team leaders, individual sales reps |
|---|---|
| How often it's needed | Weekly, monthly, quarterly |
| Related metrics | Sales pipeline velocity, CAC, average deal size, lead conversion rate, sales quota attainment, churn rate, demo-to-close ratio, product mix, CLV, sales forecast accuracy |
Customer Churn Rate Dashboard
Customer churn rate shows how many customers you're losing and at what pace. Beyond the headline number, it helps you identify which reps or segments are struggling to retain accounts, and whether the issue is rep-level or systemic.
Catching a churn trend early gives you time to respond before it compounds.
| Who's it for | Sales managers, team leaders, individual sales reps, customer success managers, account managers, executives, marketing teams, product development teams |
|---|---|
| How often it's needed | Weekly, monthly, quarterly |
| Related metrics | Customer retention rate, sales forecast accuracy, average deal size, lead response time, sales team turnover rate, product mix, opportunity-to-win ratio, sales quota attainment, market penetration |
Average Conversion Time Dashboard
Average conversion time measures how long it takes to move a prospect from first contact to closed deal. It's a direct indicator of how strong your relationships are and how effective your acquisition process is.
When conversion time is long, the dashboard helps you find the bottleneck: a slow stage, too many touchpoints, or a gap in follow-up cadence.
| Who's it for | Sales managers, individual sales reps, team leaders, executive leadership, sales operations analysts, sales trainers and coaches, marketing teams, customer success managers |
|---|---|
| How often it's needed | Weekly, monthly, quarterly, yearly |
| Related metrics | Sales cycle length, lead response time, number of touchpoints, win rate, pipeline velocity, lead qualification rate, time spent on each sales stage, follow-up frequency |
Customer Lifetime Value Dashboard
Customer lifetime value (CLV) is a predictive metric that estimates the total revenue a single customer will generate over their relationship with your business. It draws on purchase history, loyalty patterns, and the likelihood of continued engagement.
CLV is one of the most useful numbers for prioritizing accounts, setting acquisition budgets, and deciding where retention investment will pay off most.
| Who's it for | Team leaders, sales managers, marketing teams, executive leadership, customer success managers, individual sales reps |
|---|---|
| How often it's needed | Weekly, monthly, quarterly, yearly |
| Related metrics | CAC, retention rate, churn rate, average order value (AOV), purchase frequency, customer satisfaction scores, NPS, revenue per customer, upsell/cross-sell rates |
Monthly Recurring Revenue Dashboard
Monthly recurring revenue (MRR) is the predictable monthly income your company generates from subscriptions. It's one of the clearest indicators of business health for subscription-based companies.
Tracking MRR consistently helps you spot growth trends, identify churn risk early, and make pricing decisions grounded in real data rather than assumptions.
| Who's it for | Finance teams, sales managers, product managers, executives, investors |
|---|---|
| How often it's needed | Daily, weekly, monthly |
| Related metrics | Annual recurring revenue (ARR), customer churn rate, CLV, average revenue per user (ARPU), net revenue retention (NRR), CAC, expansion MRR, contraction MRR |
Average Order Value Dashboard
Average order value (AOV) measures how much a typical customer spends per transaction. It tells you whether your pricing, bundling, and upsell strategies are working.
When you know your AOV, your sales and marketing teams can take targeted action: better upsell prompts, improved product bundles, or adjusted pricing to grow revenue per customer without adding new ones.
| Who's it for | Individual sales reps, sales managers, marketing managers, e-commerce managers, product managers |
|---|---|
| How often it's needed | Weekly, monthly, quarterly |
| Related metrics | Revenue per customer, CLV, conversion rate, cart abandonment rate, product mix, upsell/cross-sell rates, profit margin per order, repeat purchase rate |
Customer Acquisition Cost Dashboard
Customer acquisition cost (CAC) measures the total investment required to win a new customer. Tracking it by channel shows you which acquisition strategies are cost-effective and which are eroding margin.
That breakdown is what lets you scale what's working and cut what isn't, rather than spreading budget evenly and hoping for the best.
| Who's it for | Individual sales reps, sales managers, marketing managers, team leaders |
|---|---|
| How often it's needed | Weekly, monthly, quarterly |
| Related metrics | CLV, return on ad spend, conversion rate, lead-to-customer ratio, marketing ROI, cost per lead, customer retention rate, payback period |
Return on Ad Spend Dashboard
Return on ad spend (ROAS) tells you how much revenue each advertising dollar generates. It's the clearest measure of whether your campaigns are paying off.
When ROAS drops, the dashboard surfaces it early, giving you time to adjust targeting, creative, or spend allocation before the impact compounds.
| Who's it for | Marketing managers, digital marketers, advertising specialists, sales managers, team leaders |
|---|---|
| How often it's needed | Weekly, monthly, quarterly |
| Related metrics | Conversion rate, click-through rate (CTR), Customer Lifetime Value, ad impressions, cost per click, marketing ROI, CAC |
Upsell/Cross-Sell Rates Dashboard
Upsell/cross-sell rates show how often your team successfully encourages customers to buy more or upgrade. Strong rates indicate your reps are having the right conversations at the right moments; weak rates point to specific pitches or stages that need work.
| Who's it for | Individual sales reps, sales managers, marketing managers, team leaders |
|---|---|
| How often it's needed | Weekly, monthly, quarterly |
| Related metrics | AOV, CLV, sales revenue, product attachment rate, customer satisfaction scores, repeat purchase rate, profit margin, revenue per customer |
Profit Margin Dashboard
Profit margins show how much of your revenue becomes earnings after costs. Tracking them by product or service line tells you which offerings are actually profitable, not just popular.
That's the information you need to make better pricing, production, and investment decisions.
| Who's it for | Business owners, financial managers, sales managers, product managers, team leaders |
|---|---|
| How often it's needed | Weekly, monthly, quarterly |
| Related metrics | Gross profit margin, net profit margin, cost of goods sold (COGS), operating expenses, revenue growth, break-even point, CLV, return on investment (ROI) |
Repeat Purchase Volume Dashboard
Repeat Purchase Volume measures how well your company converts one-time buyers into returning customers. It reflects the strength of your retention programmes and loyalty initiatives.
When the number is low, the dashboard shows you where in the customer journey engagement is falling off, so you can target the right segment with the right intervention.
| Who's it for | Customer service representatives, marketing managers, sales managers, product managers, team leaders |
|---|---|
| How often it's needed | Weekly, monthly, quarterly, yearly |
| Related metrics | Customer retention rate, Customer Lifetime Value, churn rate, NPS, AOV, frequency of purchase, customer satisfaction scores, brand loyalty index |
Product Mix Dashboard
Product Mix tracks how your portfolio performs as a whole, not just individual products in isolation. Regular review shows you which combinations are driving revenue and where gaps or weaknesses are holding your lineup back.
That picture helps you make stronger decisions about what to promote, what to develop, and what to retire.
| Who's it for | Product managers, sales managers, marketing managers, business analysts, team leaders |
|---|---|
| How often it's needed | Weekly, monthly, quarterly |
| Related metrics | Revenue by product line, product profitability, market share by product, new product adoption rate, product cannibalization rate, product lifecycle stage, customer segment preferences, inventory turnover ratio |
Track your sales KPIs with Klips
A sales KPI dashboard gives you a reliable, consistent view of the numbers that drive revenue, without waiting for someone to pull a report or paste figures into a spreadsheet.
Klips connects your sales data sources, centralizes the metrics that matter to your team, and keeps everything current on a schedule you set. Share results your way: TV mode, public links, embeds, scheduled emails, or PDFs.
Start a free Klips trial and get your sales numbers in one place.