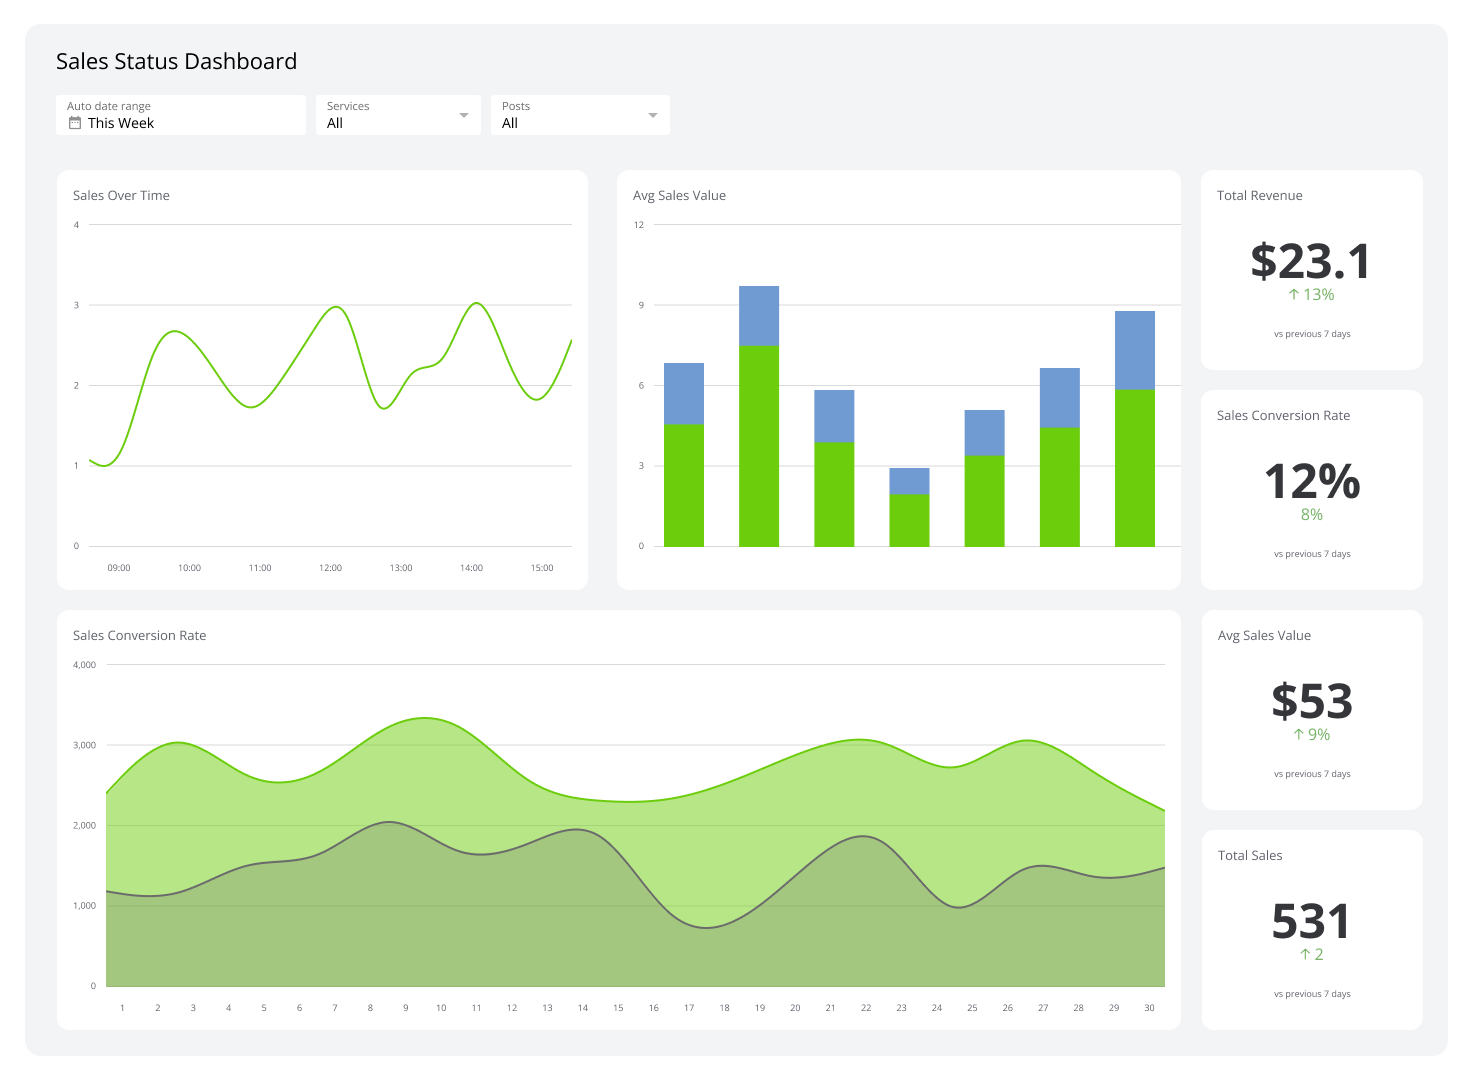
Sales Status Dashboard
Your sales team's performance, visualized in real-time.
What is a Sales Status Dashboard?
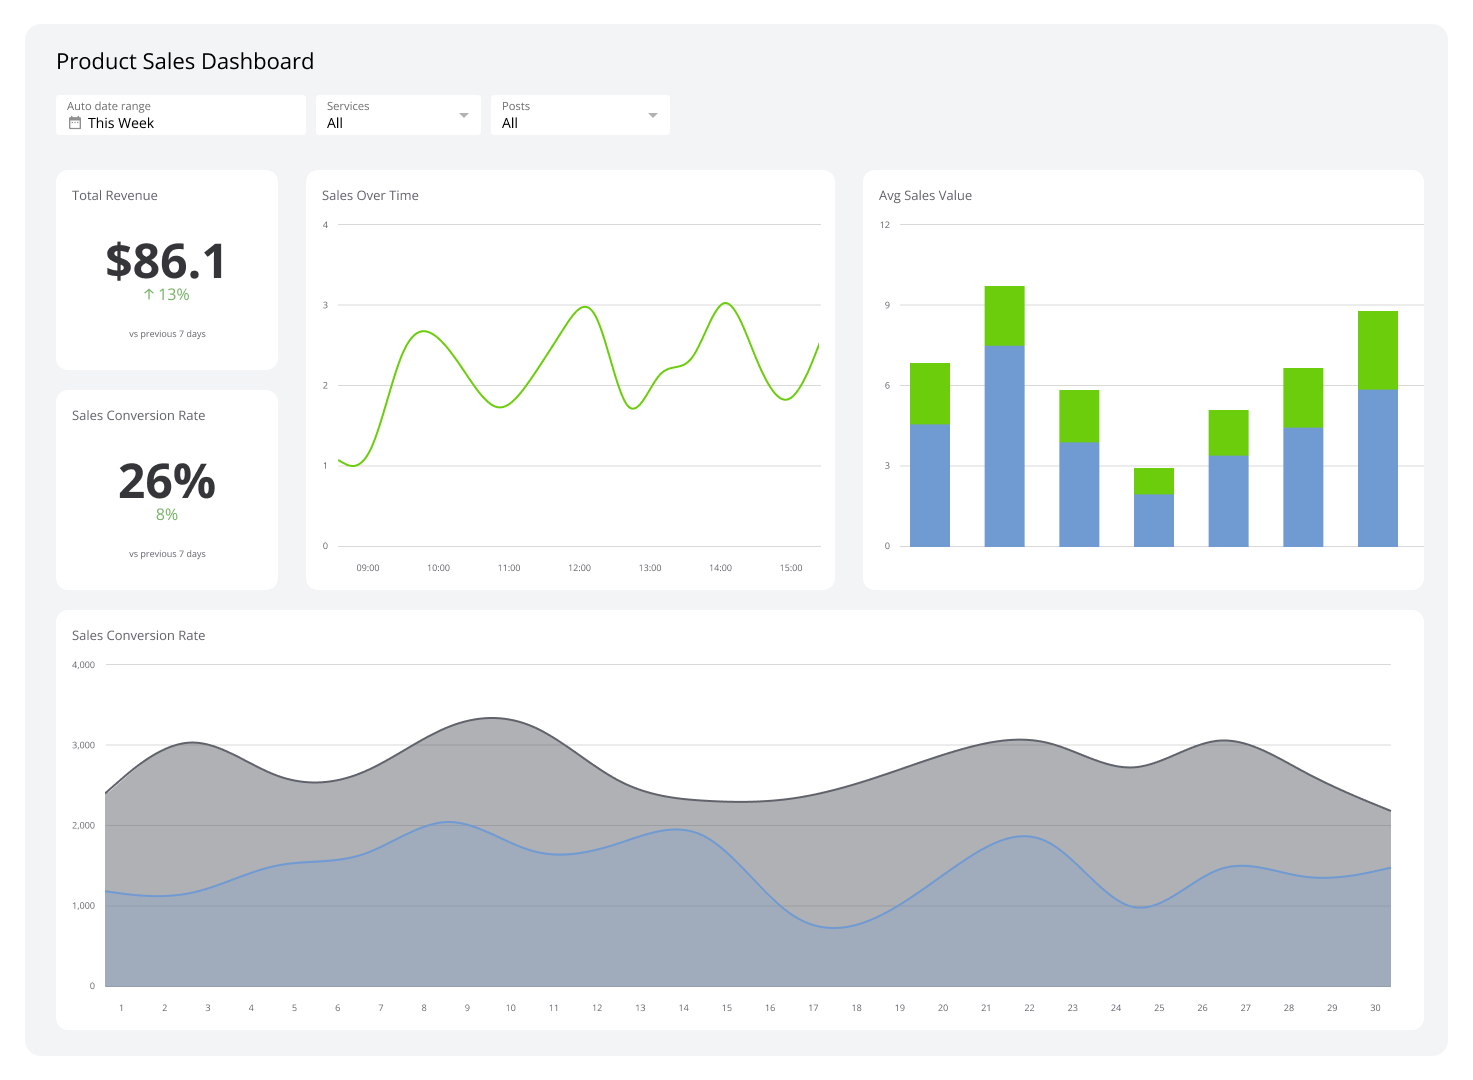
How is your sales team performing right now? A sales status dashboard answers that question at a glance. It provides a clear, real-time view of regional sales, tracks progress towards targets, and monitors overall revenue growth.
This sales dashboard example is designed for action. Sales professionals need to know the status of opportunities, leads, and prospects instantly. The dashboard uses visual cues like colour and icons to provide an immediate signal when something in the sales process needs attention, helping your team stay focused and effective.
Key metrics for your sales status dashboard
To get a complete view of your sales performance, from lead generation to closed deals, your dashboard should feature these essential metrics:
Sales Revenue Growth: Track revenue growth to understand whether you are expanding market share and hitting your top-line targets. This is the clearest indicator of whether your sales motion is working.
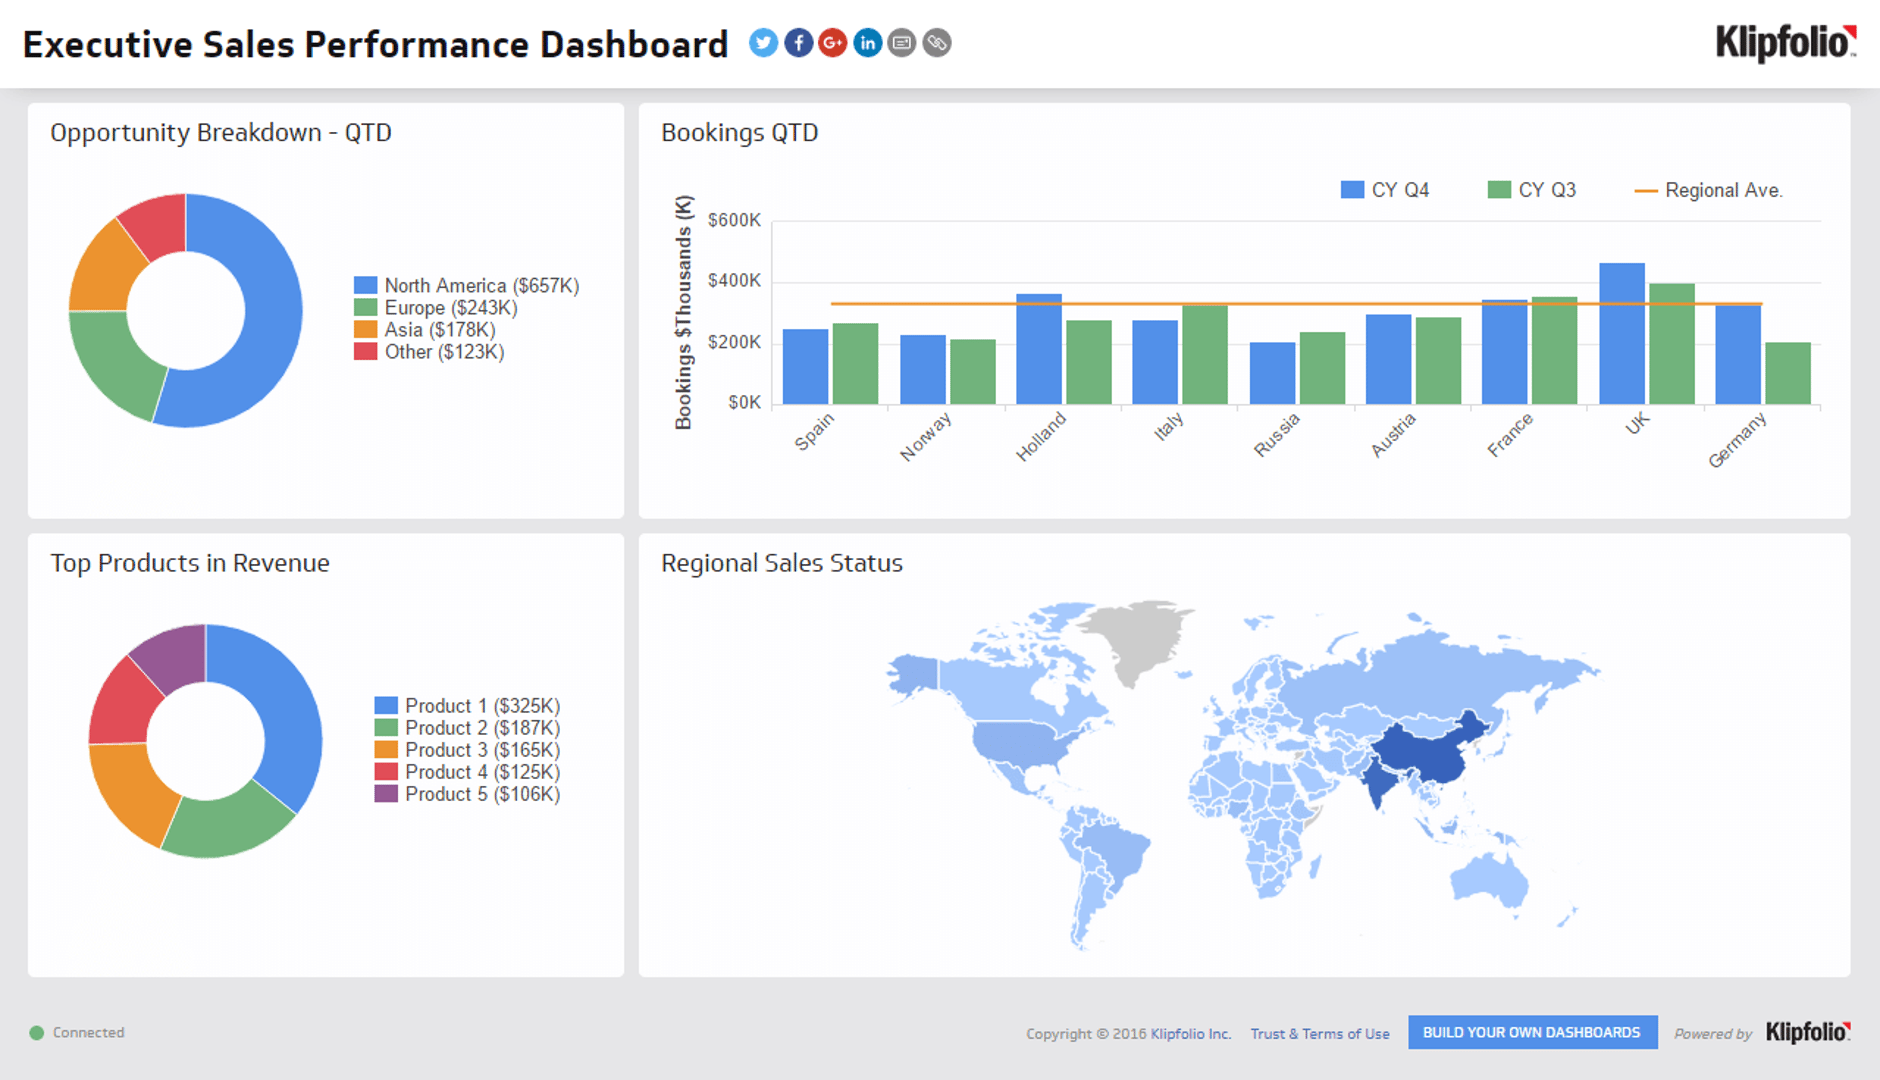
Sales Opportunities: A healthy pipeline is the foundation of future sales. Monitoring open opportunities helps you forecast revenue and manage your sales cycle before gaps appear.
Sales Bookings: Track the total value of signed contracts over a specific period. This metric gives you a concrete picture of the revenue your team has successfully secured.
Quote to Close: Measure how efficiently your team converts interest into revenue. A high quote-to-close ratio signals that your reps are qualifying well and closing consistently.
Build your sales status dashboard with Klips
Stop chasing numbers across CRM reports and spreadsheets. Use Klipfolio Klips to build a custom sales status dashboard that connects to all your data sources and gives everyone on your team the real-time visibility they need to hit their targets.
At a glance
Focus Area
Sales performance monitoring, pipeline visibility, and revenue tracking.
Metrics List
Sales Revenue Growth, Sales Opportunities, Sales Bookings, Quote to Close.
Reference Rate
Real-time to daily refresh recommended for active sales teams.
Related Dashboards
View all dashboards