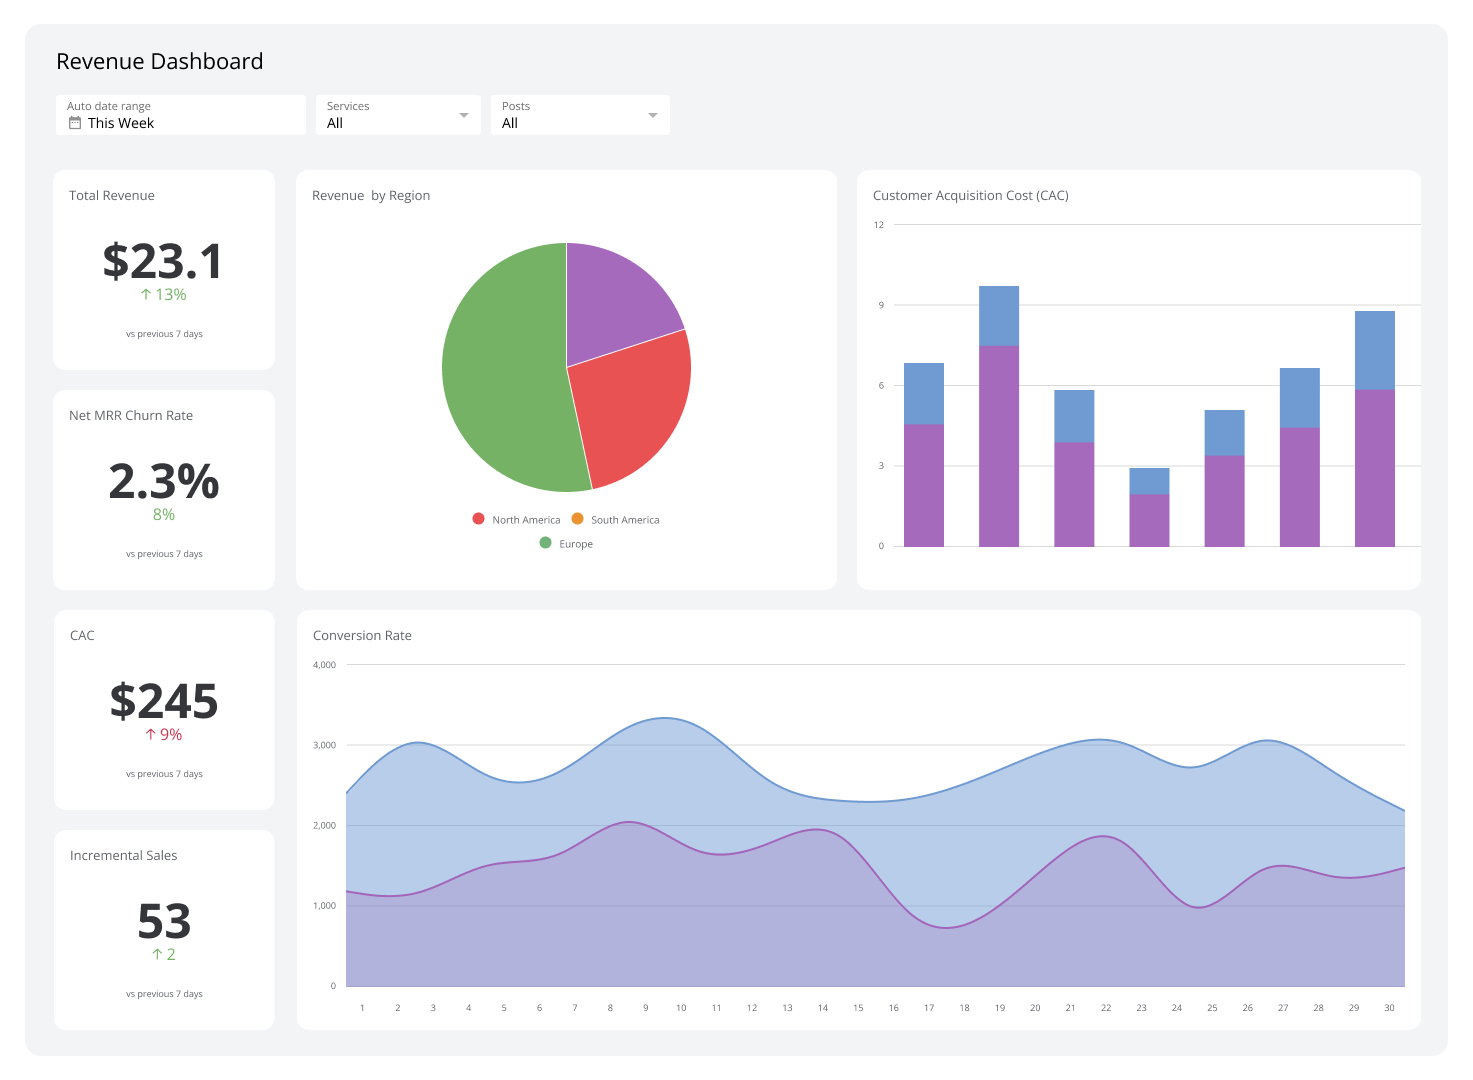
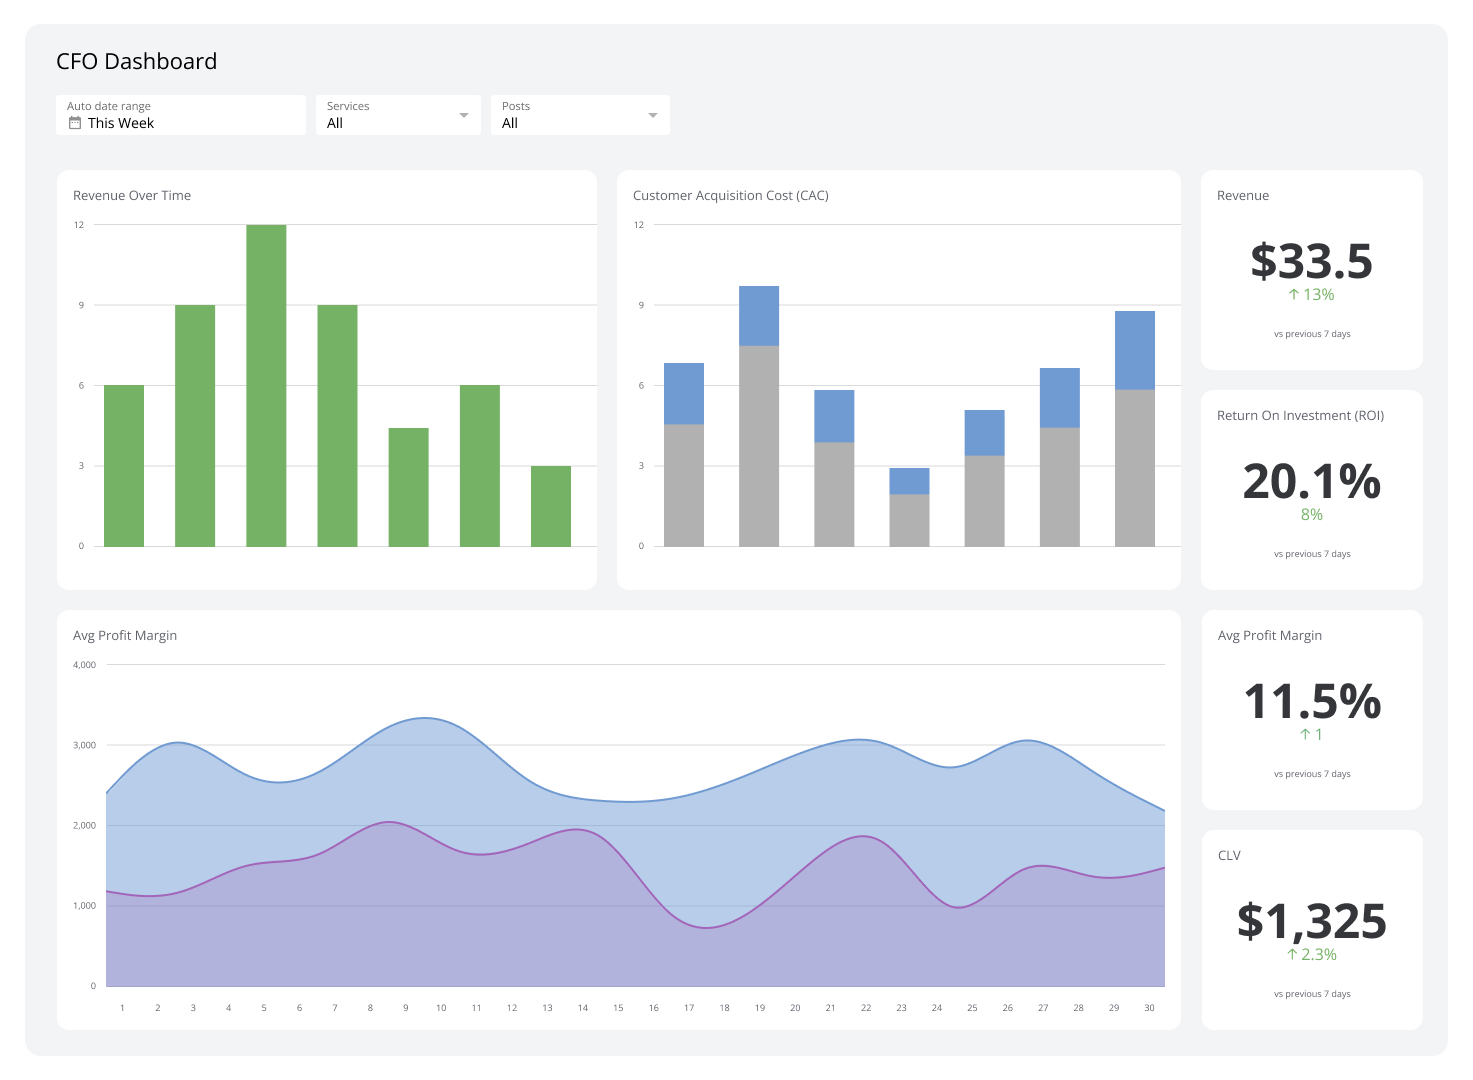
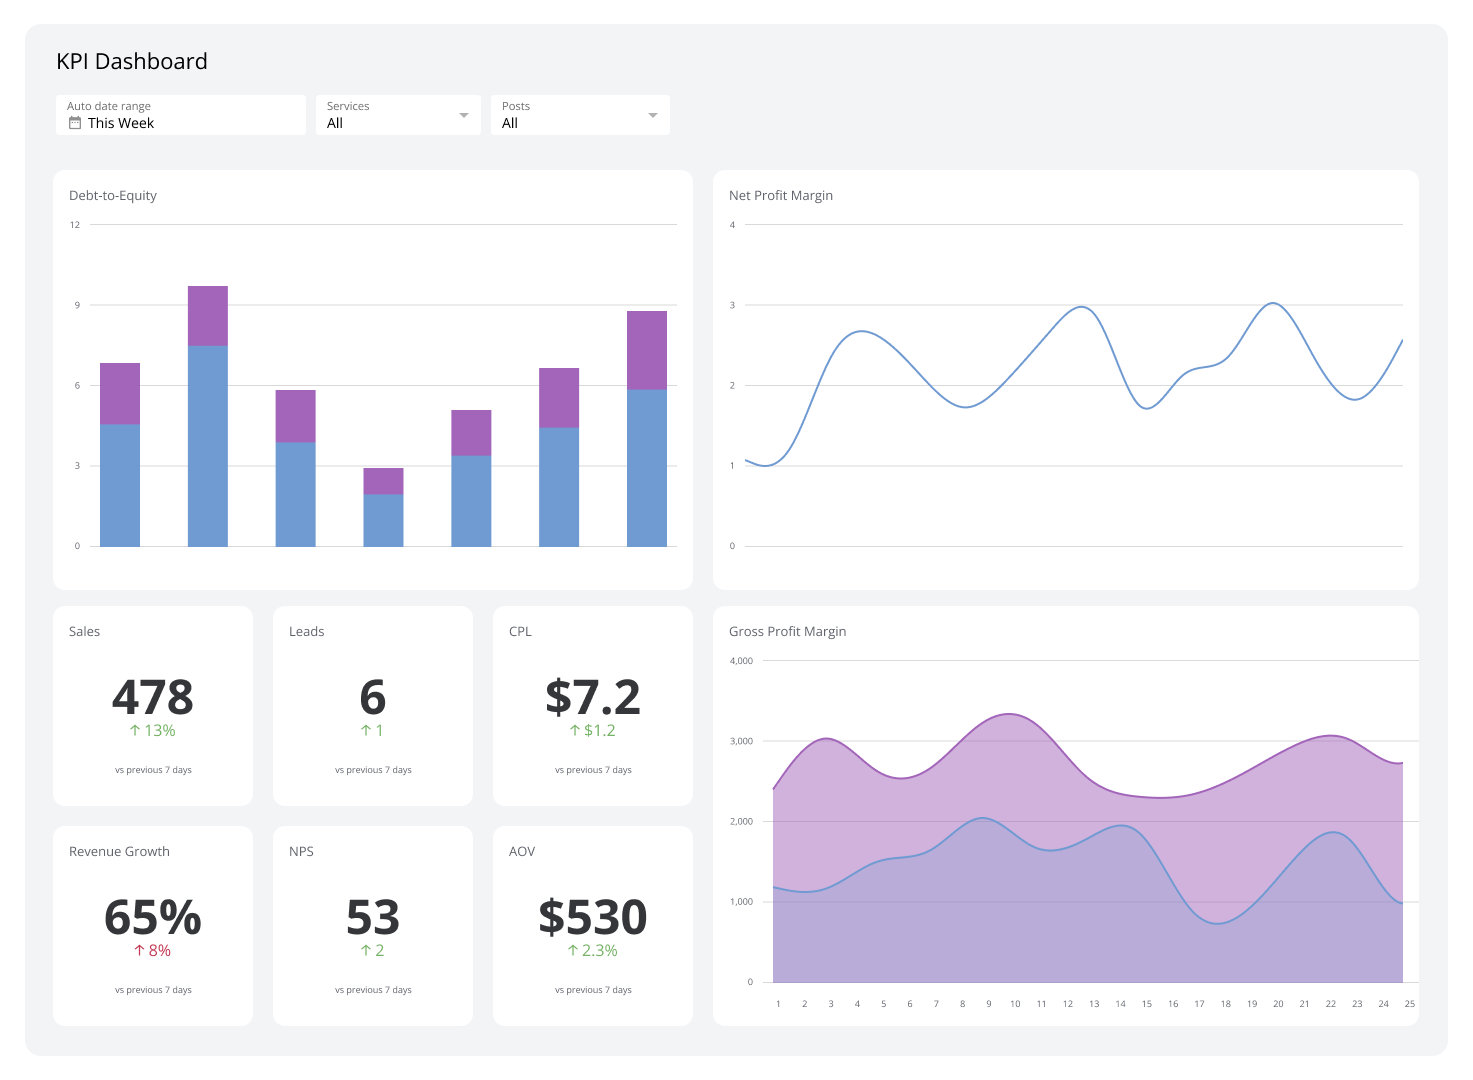
Sales Manager Dashboard
Track pipeline, productivity, and forecast accuracy in one place.

A sales manager dashboard puts your key numbers in one place: pipeline, productivity, and forecast accuracy, without waiting for someone to pull a report or pasting figures into a spreadsheet to figure out where things stand.
What is a Sales Manager Dashboard?
A sales manager dashboard brings together the metrics that matter for leading a sales team. These dashboards surface real-time performance and progress to revenue goals so you can make clear decisions and adjust strategy without digging.
Examples of Sales Manager Dashboards
The examples below cover the most common views sales managers rely on, from monthly KPI roll-ups to rep-level coaching snapshots. Each one is built to give you the answer before you have to ask.
Monthly KPI Dashboard
KPI dashboards help managers track revenue and judge whether goals are within reach. Comparing current performance against history gives you the context to spot trends, address challenges early, and make a confident call on where to push.
| Who's it for | Sales managers |
|---|---|
| How often it's needed | Monthly and quarterly |
| Covered KPIs | Revenue progress, sales targets, closed deals, Pipeline Value, historical revenue, target status, trend lines, current metrics, goal attainability |
Team Overview Dashboard
A Team Overview Dashboard shows progress to targets at a glance. Use it to spot issues early and shift focus to high-value accounts and activities before a missed week becomes a missed quarter.
| Who's it for | Sales managers, C-level executives |
|---|---|
| How often it's needed | Weekly, monthly, quarterly |
| Covered KPIs | Sales targets, team revenue, conversion rate, average order value (AOV), pipeline progress, closing ratio, sales cycle length, CAC, CLV, win rate |
Tracking Orders vs. Invoices Dashboard
Track monthly invoices, orders completed, and the total order book to anticipate revenue and manage resources. Knowing what is outstanding keeps you from being surprised at month end.
| Who's it for | Sales managers, e-commerce managers, C-level, sales ops |
|---|---|
| How often it's needed | Monthly |
| Covered KPIs | Order status, cash flow projection, backlog trend, perfect order rate, order-to-invoice time, revenue forecast, pipeline progress, order book value, monthly orders, monthly invoices |
Live Monitoring Dashboard
For high-volume inbound teams, a Live Monitoring Dashboard shows live activity metrics, lead status, and team output in real time. You know where things stand without asking.
| Who's it for | Sales managers, team leads, operations, analysts, reps |
|---|---|
| How often it's needed | Daily, weekly, monthly |
| Covered KPIs | Active leads, lead conversion, team productivity, speed to lead, lead quality, performance vs. target, Pipeline Value, source effectiveness, engagement |
State of Sales Dashboard
A daily or weekly snapshot of team-wide performance and pipeline health. The right numbers, already assembled, so you can make quick decisions without pulling a report first.
| Who's it for | Sales managers, C-level |
|---|---|
| How often it's needed | Daily or weekly |
| Covered KPIs | Team revenue, Pipeline Value, quota attainment, forecast accuracy, new leads, satisfaction, turnover, calls booked, average deal size |
Forecasting Dashboard
A weekly roll-up of risk and coverage that supports coaching and earlier course-correction. Instead of waiting for a deal to slip, you see it coming.
| Who's it for | Sales managers, executives, analysts, team leads |
|---|---|
| How often it's needed | Weekly |
| Covered KPIs | Win Rate, average deal size, cycle duration, total Pipeline Value |
Sales Rep Dashboard
Spot coaching opportunities and risks at the rep level to keep performance on track. When you know which rep needs support and why, the conversation is faster and more useful.
| Who's it for | Sales managers, team leads, reps, e-commerce managers, C-level |
|---|---|
| How often it's needed | Daily or weekly |
| Covered KPIs | Conversion Rate, revenue, quota, activity, opportunities, retention, neglected accounts, leads, average deal size, cycle duration |
Create custom dashboards for you and your team.
Get started with KlipsWin/Loss Dashboard
Track Win Rate and reasons so you can double down on what works and fix what does not. Over time, this view tells you more about your market position than any single deal review.
| Who's it for | Sales managers, executives, team leads, reps, analysts |
|---|---|
| How often it's needed | Weekly, monthly, quarterly, yearly |
| Covered KPIs | Win rate, attrition, win/loss ratio, average deal size, cycle length, stage conversion, gross revenue retention, revenue won vs. lost, reasons, segment performance, growth by segment, top products |
Sales Lead Dashboard
See which sources create quality leads and where conversion is strongest so you can invest time wisely. Reliable lead data means you stop guessing and start allocating.
| Who's it for | Reps, lead gen teams, managers, marketing |
|---|---|
| How often it's needed | Weekly |
| Covered KPIs | New outbound and inbound leads, Win Rate by lead type, source effectiveness, conversion by source, lead quality, time to convert, CPL, ROI, nurture effectiveness |
Pipeline Generation Dashboard
Watch pipeline coverage and growth so you can meet targets and ramp prospecting at the right time. A gap in coverage is much easier to close at week four than at week twelve.
| Who's it for | Managers, marketing, reps, e-commerce |
|---|---|
| How often it's needed | Weekly |
| Covered KPIs | Pipeline Value, growth rate, Conversion Rate, velocity, target vs. actual |
Sales Conversion Rate Dashboard
Break down performance by stage to find friction and lift overall conversion. When you know exactly where deals stall, you can fix the right thing instead of everything.
| Who's it for | Managers, reps, sales ops |
|---|---|
| How often it's needed | Daily, weekly, monthly |
| Covered KPIs | Overall conversion, stage conversion, cycle length, lead-to-opportunity ratio, opportunity-to-win ratio, Win Rate by rep, revenue per conversion, CAC, ROI from sales work |
Sales Leaderboard Dashboard
Use a leaderboard to reveal top performers and who needs support, and to keep goals visible to the whole team. Consistent visibility into standings keeps effort honest and coaching targeted.
| Who's it for | Managers, team leads, reps, C-level |
|---|---|
| How often it's needed | Daily, weekly, monthly |
| Covered KPIs | Revenue, closing ratio, Conversion Rate, average deal size, cycle length, CAC, CLV, quota |
Deal Performance Dashboard
See expected closures, active deals, and recent additions to improve forecast accuracy. When the numbers update automatically, you spend less time chasing status and more time acting on it.
| Who's it for | Managers, executives, analysts, C-level |
|---|---|
| How often it's needed | Daily, weekly, monthly, quarterly |
| Covered KPIs | Closure rate, Pipeline Value, new deals, pipeline change, cycle length, win/loss, average deal size, revenue forecast, team metrics, stage conversion |
Sales Performance by Region Dashboard
Compare territories and product mix to find where to focus next. A clear regional view makes it easier to reallocate resources before a gap becomes a problem.
| Who's it for | Regional managers, product managers, sales directors, marketing, C-level |
|---|---|
| How often it's needed | Weekly, monthly, quarterly, yearly |
| Covered KPIs | Revenue by region, sales by region, MRR, YoY by region, penetration, quota, CAC and CLV by region, regional conversion, product mix |
Sales Activities Dashboard
See daily activity volume and ratios by rep to keep output consistent. When you know what each person did this week, you can coach on behaviour, not just results.
| Who's it for | Team leads, managers, operations, reps, trainers, C-level |
|---|---|
| How often it's needed | Daily, weekly, monthly, quarterly |
| Covered KPIs | Call volume, emails sent, meetings, new leads, follow-ups, proposals, deals closed, time on activities, stage conversion, activity-to-outcome ratios |
Performance Overview Sales Dashboard
A clean snapshot of team health and who needs support. Make decisions fast and keep reporting simple, without asking someone to pull a number for you.
| Who's it for | Executives, directors, managers, analysts, sales ops |
|---|---|
| How often it's needed | Daily, weekly, monthly, quarterly |
| Covered KPIs | Revenue, growth, Conversion Rate, average deal size, cycle length, Win Rate, CAC, sales by region or product, Pipeline Value, forecast accuracy, quota attainment, retention |
Time-Tracking Dashboard
See where hours go, find bottlenecks, and rebalance work to raise throughput. When time data is visible and consistent, small teams operate with the discipline of much larger ones.
| Who's it for | Managers, team leads, operations, HR, PMs, C-level |
|---|---|
| How often it's needed | Daily, weekly, monthly, quarterly |
| Covered KPIs | Time per project or task, billable vs. non-billable, utilisation, task completion, average time per task type, overtime, net profit, time distribution, productivity trend, core vs. admin time |
Create custom dashboards for you and your team.
Get started with KlipsBuild your Sales Manager Dashboard in Klips
Pipeline, productivity, and forecast accuracy belong in one place your whole team can see, not scattered across spreadsheets or buried in a CRM. Klips connects your data sources, keeps numbers consistent, and puts the right view in front of the right person automatically.
Start a free Klips trial and have your Sales Manager Dashboard running today.