Leads Generated by Agents Metric
Measure the number of qualified prospects each sales agent brings into your pipeline.
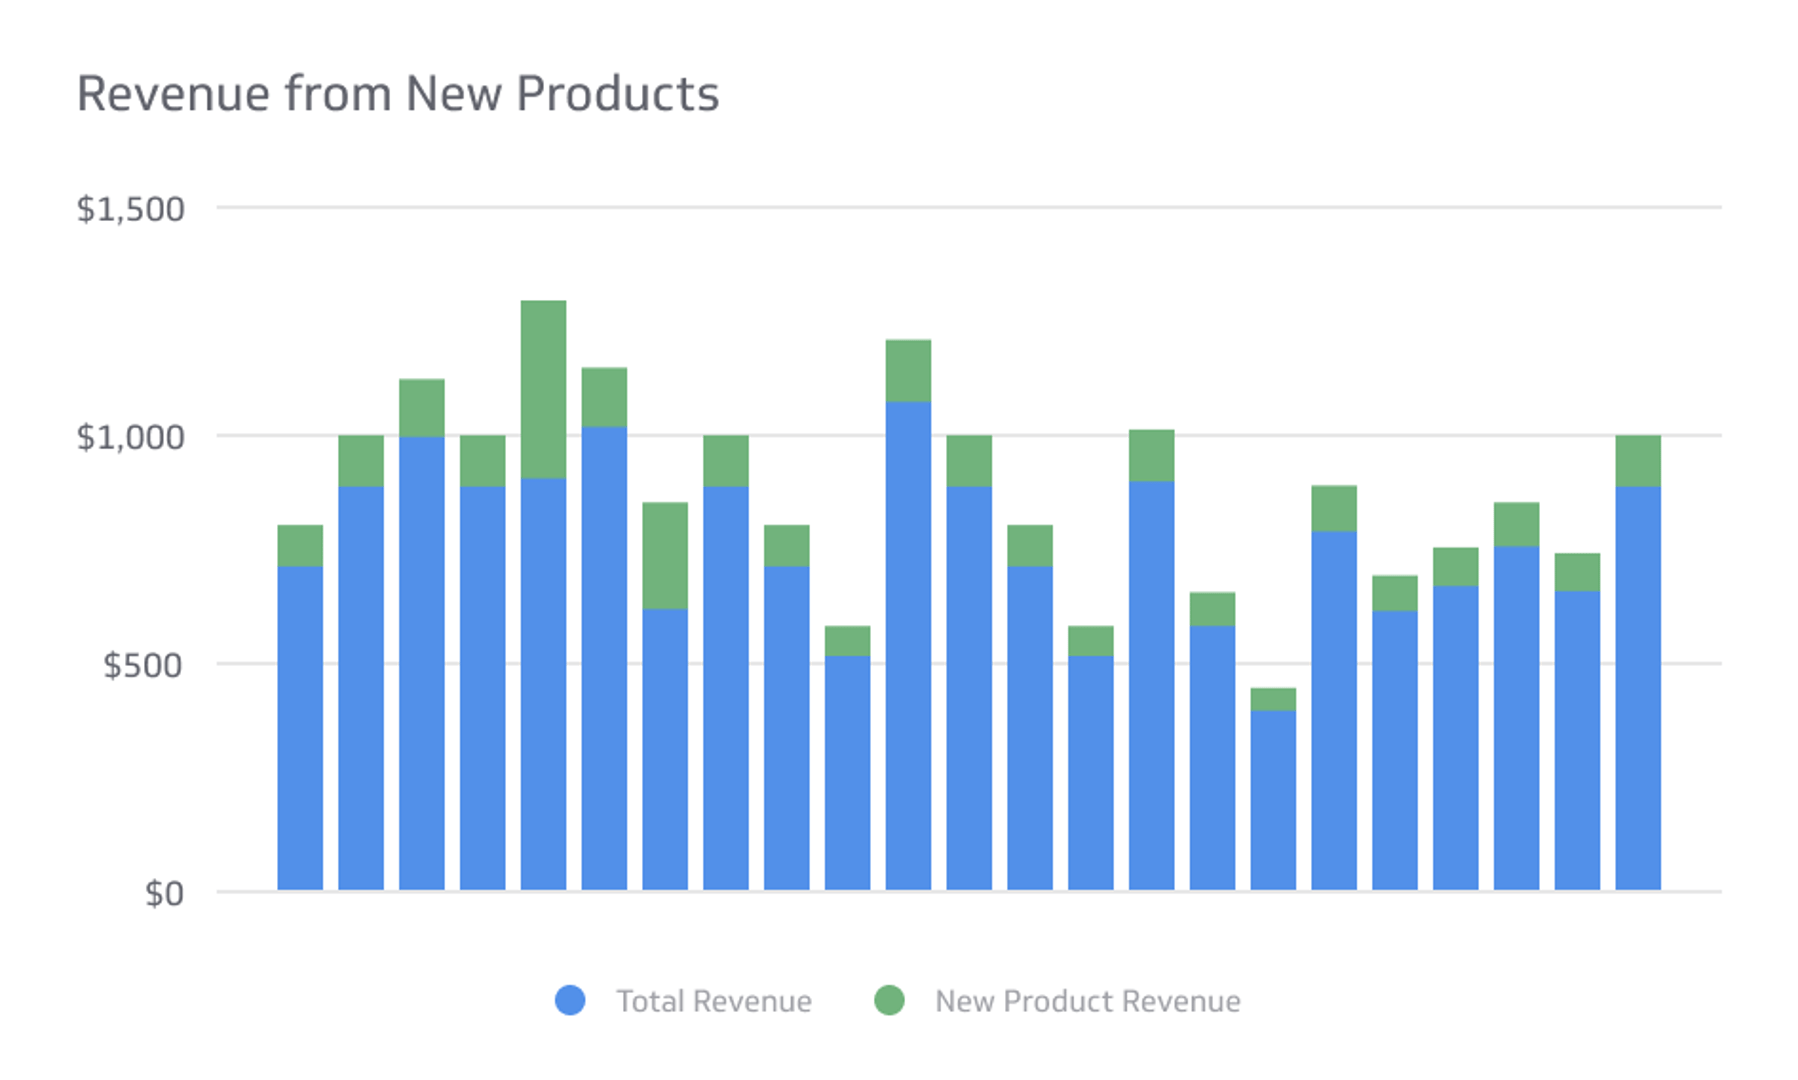
Track all your Sales KPIs in one place
Sign up for free and start making decisions for your business with confidence.
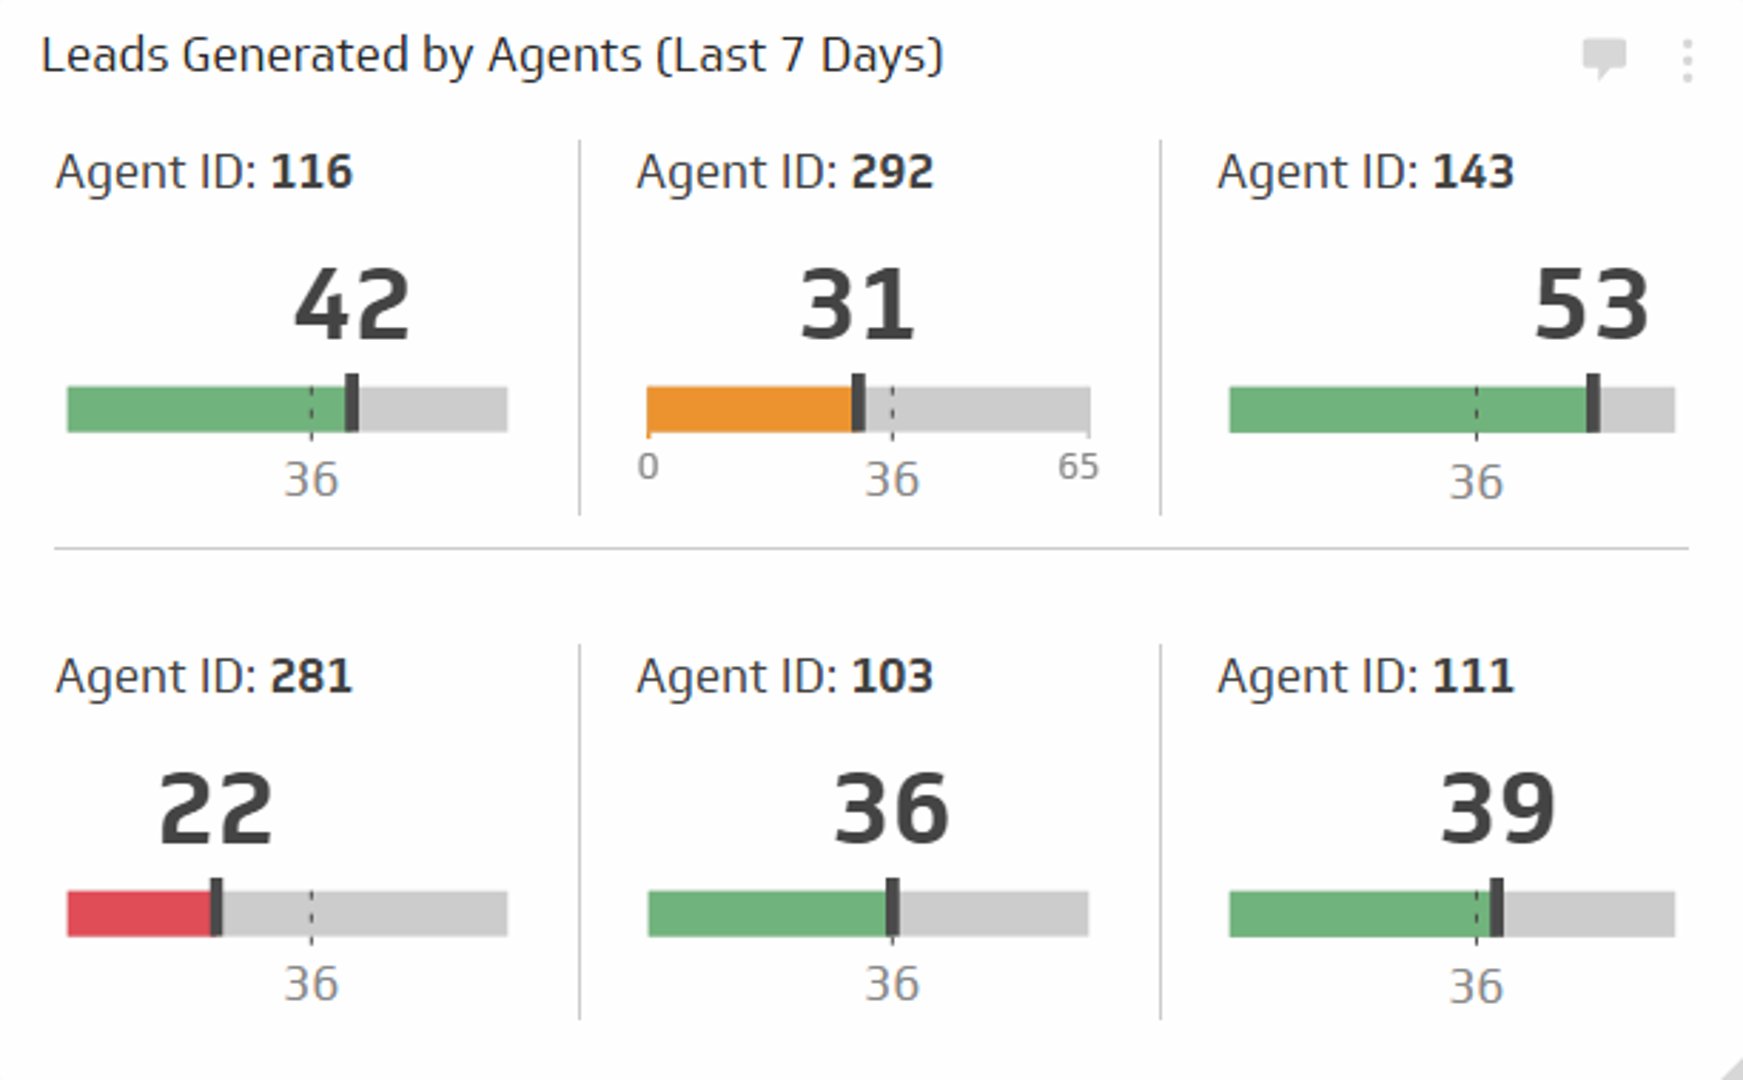
A sales lead is a prospect with whom you have contact information and a genuine interest in your product or service. Tracking Leads Generated by Agents helps you understand who's driving pipeline growth and where your prospecting efforts are most effective.
What is Leads Generated by Agents?
Leads Generated by Agents measures the number of qualified prospects each sales agent brings into your pipeline during a specific period. This metric reveals individual agent productivity and identifies your top lead generators. Unlike total leads, which may come from marketing campaigns or inbound channels, this KPI focuses specifically on outbound prospecting and direct agent activity.
Understanding this metric helps you:
- Identify top performers. See which agents consistently source the most leads.
- Benchmark productivity. Compare agent output fairly and set realistic targets.
- Allocate resources wisely. Invest training and support where it's needed most.
- Forecast pipeline growth. Predict future revenue based on current lead generation rates.
How to calculate Leads Generated by Agents
The formula is straightforward:
Leads Generated by Agents = Total New Leads Sourced by Agent in Period
Example: If Agent Sarah generates 45 leads in January, her Leads Generated by Agents for January is 45.
For a team view:
Team Leads Generated = Sum of All Leads from All Agents in Period
Example: If your five-person team generates 40, 35, 50, 38, and 42 leads respectively, your team total is 205 leads for the month.
Key metrics to pair with Leads Generated by Agents
Leads alone don't tell the full story. Combine this metric with others for deeper insight:
- Lead Conversion Rate. What percentage of an agent's leads actually convert to opportunities or closed deals? A high lead volume with a low conversion rate may signal quality issues.
- Cost Per Lead. How much does it cost to generate each lead? Compare this across agents to optimize spend.
- Lead Response Time. How quickly does the agent follow up? Faster follow-up often correlates with higher conversion.
- Sales Cycle Length. How long does it take an agent's leads to move through the pipeline? Shorter cycles indicate higher-quality prospects.
- Sales Quota Attainment. Does the agent's lead generation translate to hitting their revenue target?
Reporting frequency and benchmarks
Reporting frequency: Monthly or weekly (for real-time pipeline visibility).
Example targets:
- 40 leads per agent per month (for outbound prospecting roles).
- 25–30 leads per agent per month (for inside sales with blended inbound/outbound).
- 15–20 leads per agent per month (for enterprise sales with longer cycles).
Benchmarks vary by industry, deal size, and sales model. Adjust targets based on your historical performance and growth goals.
Why Leads Generated by Agents matters
Drives accountability. When agents see their lead generation tracked and displayed, they're motivated to stay consistent and improve. Transparency fosters healthy competition and focuses effort on pipeline growth.
Reveals training gaps. If one agent generates significantly fewer leads than peers, it may signal a need for coaching, skill development, or process adjustment.
Supports forecasting. Predictable lead generation allows you to forecast pipeline value and revenue with greater confidence, making it easier to plan quarterly and annual targets.
Identifies process improvements. Comparing agent output can highlight which prospecting techniques, channels, or messaging work best—insights you can scale across the team.
Building a Sales Team Leaderboard
A bit of friendly competition goes a long way. A sales leaderboard dashboard displays real-time lead generation metrics for each agent, creating transparency and motivation across your team. This approach has proven effective for many growing sales organizations.
Key reasons to build a sales leaderboard
- Track individual sales performance in real-time. See who's generating leads and how consistently.
- Track team sales performance in real-time. Monitor aggregate pipeline growth and team health.
- Directly compare performance across multiple sales metrics or KPIs, such as Lead Conversion Rate, average deal size, or sales cycle length.
- Use friendly competition to fuel motivation in the sales team. Public visibility of top performers encourages others to raise their game.
- Create a transparent, data-driven work environment. Everyone understands expectations and can see progress toward goals.
- Make quick decisions based on data instead of waiting for end-of-quarter reports. Weekly or daily updates enable faster coaching and strategy adjustments.
Best practices for tracking Leads Generated by Agents
Define what counts as a lead. Ensure all agents use the same criteria. A lead should meet minimum qualification standards (e.g., correct company size, industry, or decision-making authority) to avoid inflated numbers.
Use consistent data sources. Pull lead data from your CRM (Salesforce, HubSpot, Pipedrive) to eliminate manual entry errors and ensure accuracy.
Track by channel. Break down leads by source (cold calling, email, LinkedIn, referrals) to identify which prospecting methods work best for each agent.
Review trends, not just totals. Look for patterns over time. Is lead generation seasonal? Are certain agents ramping up while others decline? Use these insights to coach and support.
Celebrate wins and provide support. Recognize top performers publicly, and offer additional training or resources to those struggling. A leaderboard should motivate, not demoralize.
Common challenges and solutions
Quality versus quantity. Agents may prioritize volume over lead quality to rank higher on the leaderboard. Pair Leads Generated by Agents with conversion rate and deal size metrics to discourage this behavior.
External factors. Market conditions, territory size, and customer type can affect lead generation. Adjust targets fairly based on these variables rather than using a one-size-fits-all benchmark.
Data accuracy. CRM data can be messy if agents don't log consistently. Establish clear logging protocols and audit data regularly to maintain integrity.
Burnout from pressure. Constant public comparison can create stress. Balance leaderboards with supportive coaching and recognition of effort, not just results.
Measuring success with dashboards
A well-designed dashboard makes Leads Generated by Agents easy to track and act on. Include:
- Individual agent lead counts for the current month and year-to-date.
- Trend lines showing lead generation over the past 3–6 months.
- Conversion funnels from lead to opportunity to closed deal.
- Comparative views of team performance and top performers.
- Drill-down capability to see which leads came from which channels or campaigns.
Tools like Klipfolio allow you to connect your CRM directly, automate data refresh, and display real-time metrics to your entire team—eliminating manual spreadsheet updates and keeping everyone aligned.
Conclusion
Leads Generated by Agents is a foundational metric for any sales organization focused on pipeline growth. By tracking individual agent output, you gain visibility into prospecting effectiveness, identify coaching opportunities, and create accountability. Pair this metric with conversion rate, deal size, and sales cycle length for a complete picture of sales health. Use a real-time dashboard to keep your team motivated and data-driven, turning lead generation into a competitive advantage.