

Turn sales into an exciting adventure with leaderboards
Sales leaderboards turn daily activity into visible, competitive progress by combining gamification mechanics with real-time data. This article explains what sales gamification is, why leaderboards work, which metrics to track, and how to build a live sales leaderboard in Klips by connecting your CRM, setting targets, and distributing results via TV mode, shared links, or scheduled PDFs.
Sales teams run on motivation. Leaderboards give that motivation a scoreboard, turning daily activity into something your team can see, compete on, and rally around. When you combine gamification with real-time data, the result is a sales culture that rewards effort, builds transparency, and keeps everyone moving toward the same targets.
What is sales gamification?
Gamification is the practice of applying game mechanics to a non-game environment to motivate people to perform specific tasks. In a sales context, that means using elements like points, badges, levels, and leaderboards to make daily activity more engaging and visible.
According to the Wall Street Journal, Liveops, a cloud call centre company, reduced call time by 15% and increased sales by 8% after introducing a gamified approach to its sales team. The mechanics work because they tap into the same psychological drivers that make games compelling: progress, recognition, and competition.
The 10 classic game mechanics are points, levels, missions, badges, leaderboards, unlocks, events feeds, notifications, quizzes, and progress tracking. You do not need all of them. A well-designed leaderboard alone can deliver most of the motivational lift.
What is a sales leaderboard?
A sales leaderboard is a dashboard that ranks individual sales rep performance side by side, measured against shared targets and tracked in real time. It shows who is ahead, who is behind, and by how much, on a daily, weekly, or monthly basis.
Employees at the top get a visible sense of accomplishment. Everyone else gets a concrete reason to close the gap. That dynamic, when handled well, turns routine activity into genuine competition.
"Gamification is 75% psychology and 25% technology." (Gabe Zichermann)
One important guardrail: never use a leaderboard to stigmatize low performers. Praise in public and coach in private. A leaderboard that makes people feel exposed will backfire. One that celebrates progress and effort will energize the whole team.
Why build a sales leaderboard?
Sales leaderboards deliver benefits well beyond a simple ranking. Here is what teams consistently gain:
- Individual and team visibility: Track performance in real time without waiting for end-of-quarter reports.
- Direct comparison across metrics: See how reps stack up on multiple KPIs at once, not just revenue.
- Friendly competition: Give your team a reason to push harder without adding pressure from management.
- Transparent culture: Displaying data publicly signals trust and removes ambiguity about how performance is measured.
- Faster coaching decisions: Spot who needs support and who deserves recognition before problems compound.
According to research by Deloitte, 88% of employees believe a distinct corporate culture is important to a business's success. A well-run leaderboard reinforces that culture every day it is on display.
Leaderboards also extend beyond sales. Marketing and Customer Support teams can use the same approach to track their own activity metrics and goals.
What metrics to track on a sales leaderboard
MRR from new business is the headline number, but anchoring your leaderboard to a single metric creates an unfair advantage for reps with larger territories or longer sales cycles. Tracking a broader set of behaviours gives more team members a genuine shot at recognition.
Sync your leaderboard to your CRM and track KPIs such as:
- New customers: the number of new accounts closed in the period
- New business accounts: newly acquired business relationships
- Expansion MRR: revenue generated from existing customers
- Onboarding calls: post-sale calls completed to ensure customer success
- Average time to close: how efficiently reps move deals through the pipeline
When reps see a leaderboard as fair and tied to behaviours they can control, it motivates. When they see it as arbitrary or stacked against them, it demotivates. Choose your metrics deliberately and align scoring with the behaviours you want to encourage.
How to build a sales leaderboard in Klips
Klips connects to the data sources your team already uses and turns that data into a live, visual leaderboard you can display anywhere. Here is how to build one.
Create custom dashboards for you and your team.
Get started with KlipsStep 1: Connect your sales data
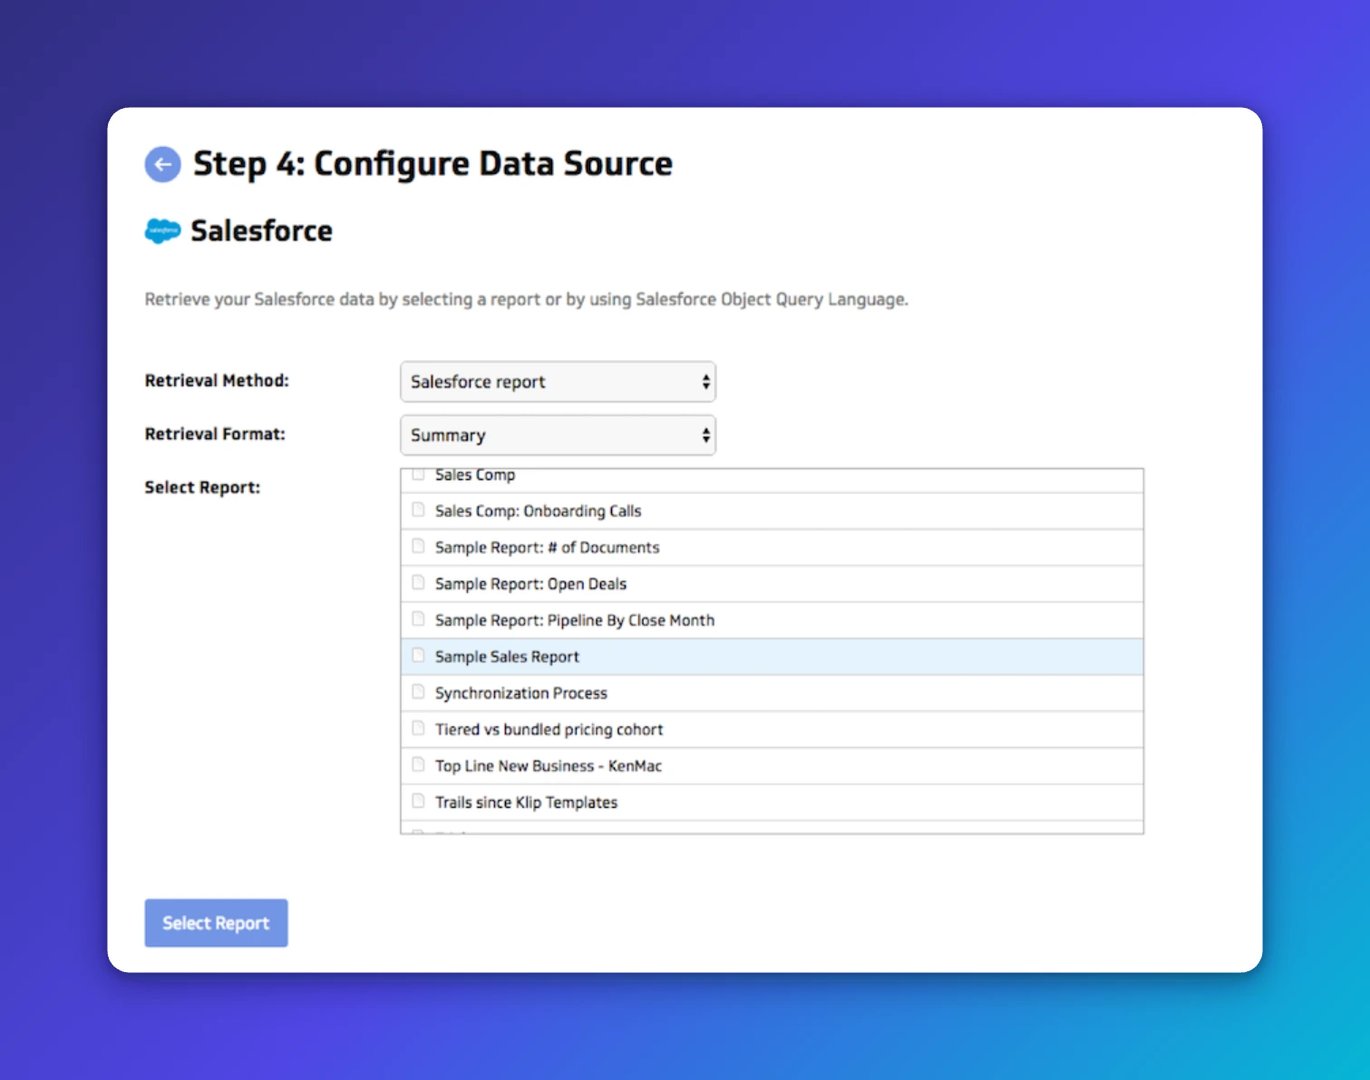
The first step is connecting your data source to Klips. If you are drawing on Salesforce data, start by creating a sales report in Salesforce, then connect your Salesforce account in Klips. Klips supports CRMs like Salesforce, HubSpot, and Pipedrive, as well as call centre tools, support apps, and spreadsheets stored locally or in the cloud.
Once connected, you can search for and pull in the specific report you want to visualize.
Step 2: Set up your targets
Create an Excel or Google Sheets spreadsheet to track your daily, monthly, and quarterly sales targets for each KPI. This becomes the benchmark your leaderboard measures against.
Step 3: Build your Klips
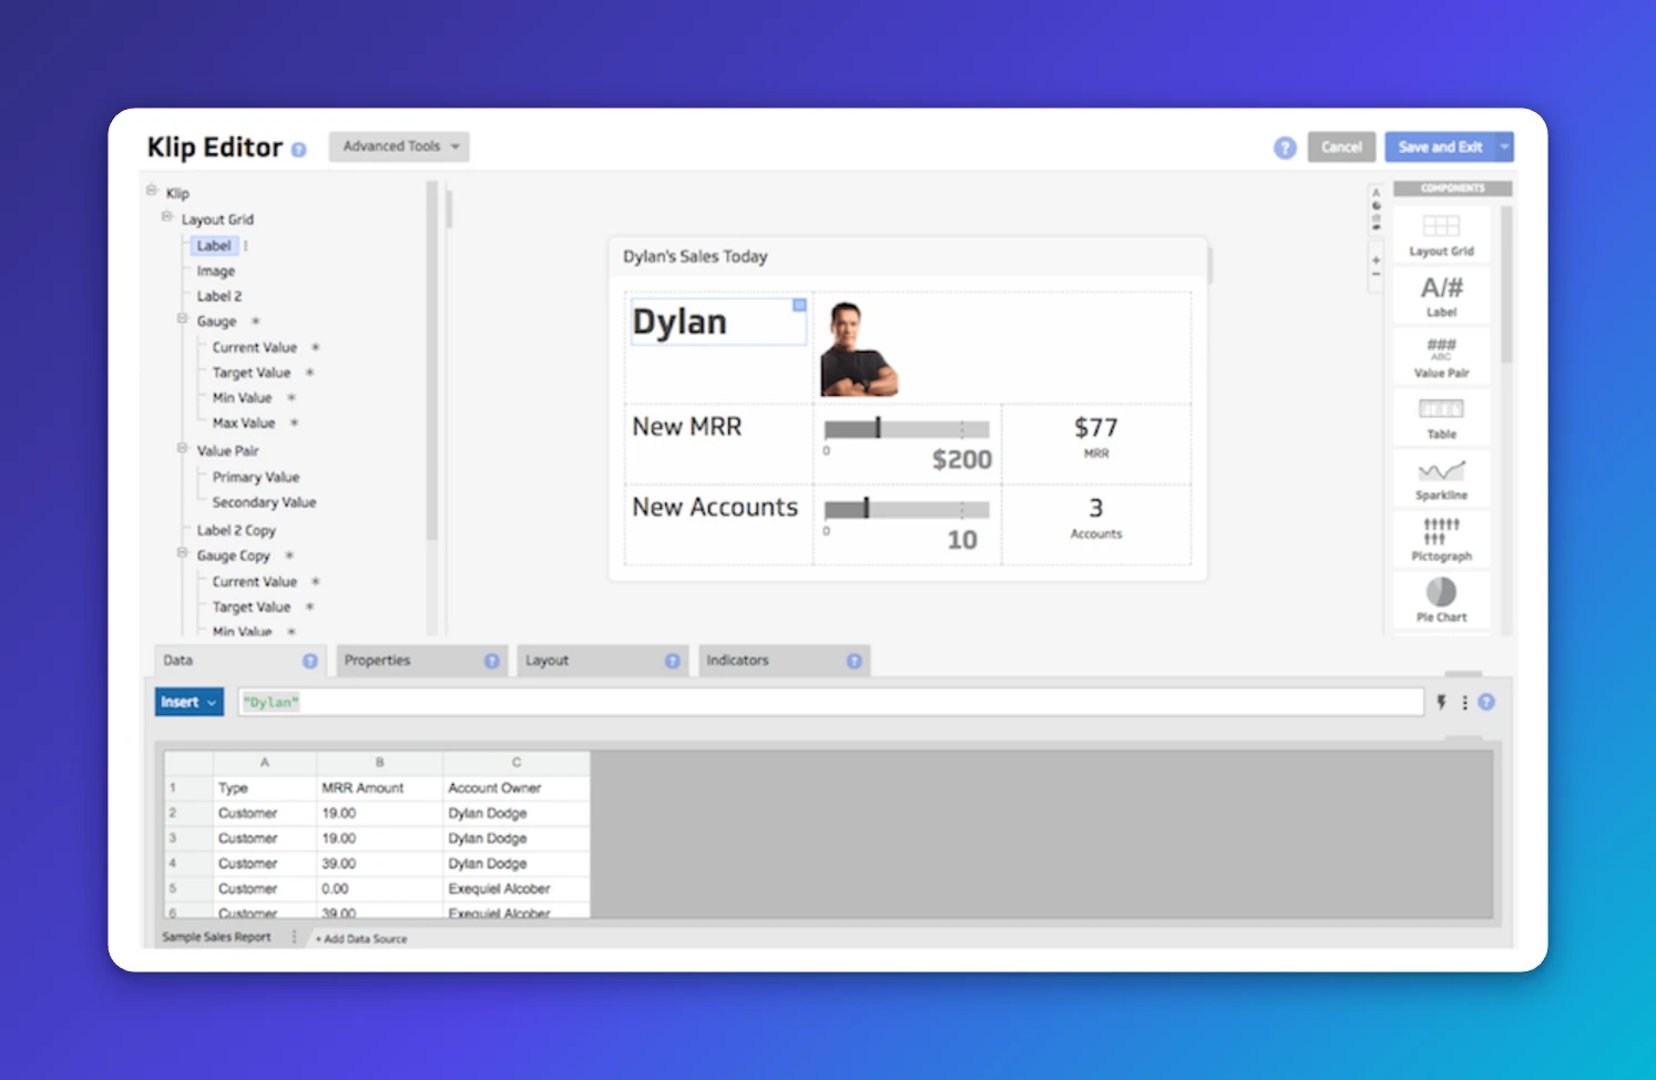
From the dashboard interface, click Add a Klip, then Build a Custom Klip. Start with the Blank component for maximum flexibility.
Select your connected data source. Use your CRM report and targets spreadsheet to build data visualizations, such as gauges or bar charts, that show each rep's KPIs against their goals.
Once you have built a scorecard for one rep, duplicate it, adjust the data reference for the next rep, and save it as a new Klip. Repeat until you have a scorecard for every member of the team, then arrange them on a single dashboard.
Step 4: Display and distribute
Put the leaderboard where your team will see it. Use TV mode to display your sales leaderboard on an office screen, share a private link with remote reps, or schedule a PDF to land in inboxes each morning.
For extra motivation, complement the leaderboard with a Salesforce TV dashboard showing pipeline and activity data alongside the rankings.
Pro tip: use cumulative monthly targets
Take a look at our internal sales leaderboard where monthly targets are cumulative. This approach works as positive reinforcement: reps can see their progress building throughout the month rather than resetting each week. It keeps motivation high even mid-month, when energy can dip.
Try out different layouts, colour themes, gauges, and graphs in Klips to find the format that resonates with your team.
Build your leaderboard with Klips
Klips makes it straightforward to spin up a sales leaderboard without heavy lifting:
- Connect your data: CRM, spreadsheets, or databases
- Pick your metrics: new customers, deals won, Expansion MRR, calls, average time to close
- Make it visible: run it on a TV dashboard, share a private link, or schedule a PDF
- Keep it fair: align scoring with the behaviours you want to reinforce
A leaderboard is only as good as the data behind it and the culture around it. With Klips, you can test different metric combinations, refine the layout, and keep the leaderboard current as your team's goals evolve.
Updated 2026-09-09




Most recent
- SEP 25What SOC 2 taught a small team about trust
- SEP 15The AI race: progress, humanity, and trust
- SEP 9The good advisor
- AUG 11Beyond simple sign-ups: how True Trials and Activation predict growth
- JUL 7Why business leaders miss important trends in their dashboards
- JUN 19The best chart for the job: Visualizing data for non-technical users