Sales Activity Dashboard
Sales activity dashboards track salespeople's daily tasks, focusing on productivity and pipeline progression.
Sales activity dashboards track salespeople's daily tasks, focusing on productivity and pipeline progression. This tool helps you prioritize customer interactions, identify potential issues early, and optimize activities to drive revenue growth.
What is a Sales Activity Dashboard?
This dashboard monitors your salesforce’s daily tasks, supporting productivity by prioritizing customer interactions. It helps you manage output effectively, focusing attention on crucial company activities.
Such dashboards integrate with pipeline data, linking activities to lead generation and business outcomes. By enabling early issue identification, these dashboards allow managers to address problems before they impact critical metrics like revenue.
Examples of Sales Activity Dashboards
28-Day Snapshot Dashboard
The 28-day snapshot dashboard informs you about sales across lead generation, nurturing, and conversion stages. It shows decreased call effectiveness despite higher volume, possibly due to shorter durations. In addition, the dashboard helps identify and address funnel issues early, allowing proactive measures to maintain revenue growth.
Who’s it for | Sales managers, sales team leaders, sales executives, e-commerce specialists |
How often it's needed | Daily, weekly, monthly |
Covered KPIs | Lead generation metrics, lead nurturing metrics, sales conversion rate, call volume, call effectiveness, longest call length, funnel stage progression |
Sales Team Activity Dashboard
Track lead processing, conversion, and individual performance metrics with a sales team activity dashboard. It delivers live updates on response times and unprocessed leads. By breaking down activities per representative, this dashboard helps pinpoint productivity trends and potential obstacles in the sales cycle.
Who’s it for | Sales executives, team leaders, sales operations managers |
How often it's needed | Daily |
Covered KPIs | Lead conversion rates, individual response metrics, response times, number of unprocessed leads, activity breakdown per representative, productivity trends, sales process bottlenecks |
Sales Overview Dashboard
Sales overview dashboards offer a comprehensive idea of sales performance, showcasing key metrics and trends. It highlights revenue, goals, closed deals, and other crucial KPIs. This tool enables you to monitor individual progress and overall sales activities effectively.
Who’s it for | Senior management, executive directors, sales managers, e-commerce specialists |
How often it's needed | Weekly, monthly, quarterly |
Covered KPIs | Sales goals/targets, revenue, closing ratio, average deal size, potential revenue in sales pipeline, sales cycle length, individual rep performance |
Sales Pipeline Dashboard
Sales pipeline dashboards visualize conversion rates from potential buyers to paying customers. They identify opportunities to close deals and move leads through sales stages. Moreover, the dashboard aids in revenue forecasting and recommends actions to achieve sales targets.
Who’s it for | Sales managers, account executives, sales directors |
How often it's needed | Weekly, monthly, quarterly |
Covered KPIs | Conversion rates, pipeline velocity, deal stage progression, win/loss rate, average deal size, sales cycle length, revenue forecast, percent closing ratio, lead-to-opportunity conversion rate |
Individual Sales Performance Dashboard
Individual sales performance dashboards offer sales reps a concise picture of their key metrics, including quota attainment, lead status, and forecasts. From the data displayed, reps can track their progress and adjust their strategies in real-time, significantly enhancing their effectiveness.
Who’s it for | Individual sales reps, sales managers |
How often it's needed | Daily, weekly, monthly |
Covered KPIs | Sales quota attainment, lead status, sales forecasts, conversion rates, average deal size, number of calls, number of meetings, pipeline value, win rate, sales cycle length, customer acquisition cost (CAC) |
Sales Territory Dashboard
A sales territory dashboard offers deep insights into multi-area operations, displaying resource allocation, revenue distribution, and opportunities. It enhances territory management by presenting real-time, accurate data in visually accessible formats. With the information it provides, this dashboard lets you improve strategies and balance workloads across different territories.
Who’s it for | Regional sales managers, sales directors, territory planners, executive leadership |
How often it's needed | Weekly, monthly, quarterly |
Covered KPIs | Revenue by territory, opportunity win rate by region, sales pipeline by territory, number of accounts by territory, average deal size by territory, sales rep productivity per region, market penetration rate, customer acquisition per territory, territory coverage ratio, lead response time by region, customer retention rate by region, customer retention rate by territory, quota attainment by territory |
Sales Leaderboard Dashboard
Sales leaderboards elevate team performance by ranking reps based on critical metrics. These visual displays create healthy competition and drive motivation among sales staff. Implementing leaderboards can significantly boost overall sales productivity and results.
Who’s it for | Sales directors, sales representatives, sales managers |
How often it's needed | Daily, weekly, monthly |
Covered KPIs | Total revenue generated, number of deals closed, conversion rate, average deal size, pipeline value, sales quota attainment, number of new leads generated, customer satisfaction score, sales cycle length, outbound calls made, outbound emails made, win rate, cross-selling/upselling success rate |
Sales Growth Dashboard
A sales growth dashboard tracks critical metric changes over time, revealing potential issues despite high rep performance. This dashboard can specify if deal sizes or staffing levels must be increased to meet volume targets.
Who’s it for | C-level executives, sales managers, sales directors, business analysts |
How often it's needed | Weekly, monthly, quarterly, yearly |
Covered KPIs | Year-over-year (YoY) revenue growth, quarter-over-quarter (QoQ) revenue growth, month-over-month (MoM) revenue growth, average deal size trend, customer acquisition rate, customer churn rate, sales pipeline growth, lead-to-opportunity conversion rate trend, opportunity-to-win rate trend, sales cycle length trend, market share growth, new product/service adoption rate, sales team productivity growth, customer lifetime value (CLV) trend, cost of customer acquisition (CAC) trend |
Sales Live Monitoring Dashboard
The live monitoring dashboard streamlines real-time performance tracking in fast-paced sales environments. Organizations can quickly identify and address issues affecting revenue. Prompt detection of bottlenecks allows for immediate corrective actions to optimize revenue strategies.
Who’s it for | C-level executives, sales managers, sales directors |
How often it's needed | Daily |
Covered KPIs | Real-time sales revenue, sales pipeline velocity, conversion rates at each stage, number of active deals, average deals size, CAC, win/loss ratio, sales cycle length, lead response time |
Marketing ROI Dashboard
With a marketing ROI dashboard, you can get comprehensive insights into marketing efforts and their sales impact. It aligns your sales and marketing departments to optimize resource utilization and boost revenue generation.
Who’s it for | Chief marketing officers, marketing directors, digital marketing managers, marketing analysts, sales directors, c-level executives |
How often it's needed | Weekly, monthly, quarterly, yearly |
Covered KPIs | Return on Marketing Investment (ROI), CAC, CLV, conversion rates, cost per lead (CPL), revenue attributed to marketing, marketing Qualified Leads (MQLs), sales Qualified Leads (SQLs), channel performance, campaign performance metrics, website traffic, content engagement, marketing spend by channel, sales cycle length |
Lead Generation Dashboard
A lead generation dashboard pictures the effectiveness of various lead generation tactics on revenue performance. Through it, sales and marketing relationships can be analyzed to identify successful strategies and areas for improvement.
Who’s it for | Marketing managers, sales managers, lead generation specialists, digital marketing coordinators, business development representatives, CMOs and sales directors |
How often it's needed | Daily, weekly, monthly |
Covered KPIs | Leads generated, lead conversion rate, average lead score, lead source performance, lead-to-opportunity ratio, time to conversion, MQLs, SQLs, lead nurturing effectiveness, channel-specific lead metrics, lead response time, lead engagement rate, average lead score, ROI by lead generation channel, cost per lead |
Sales Analysis Dashboard
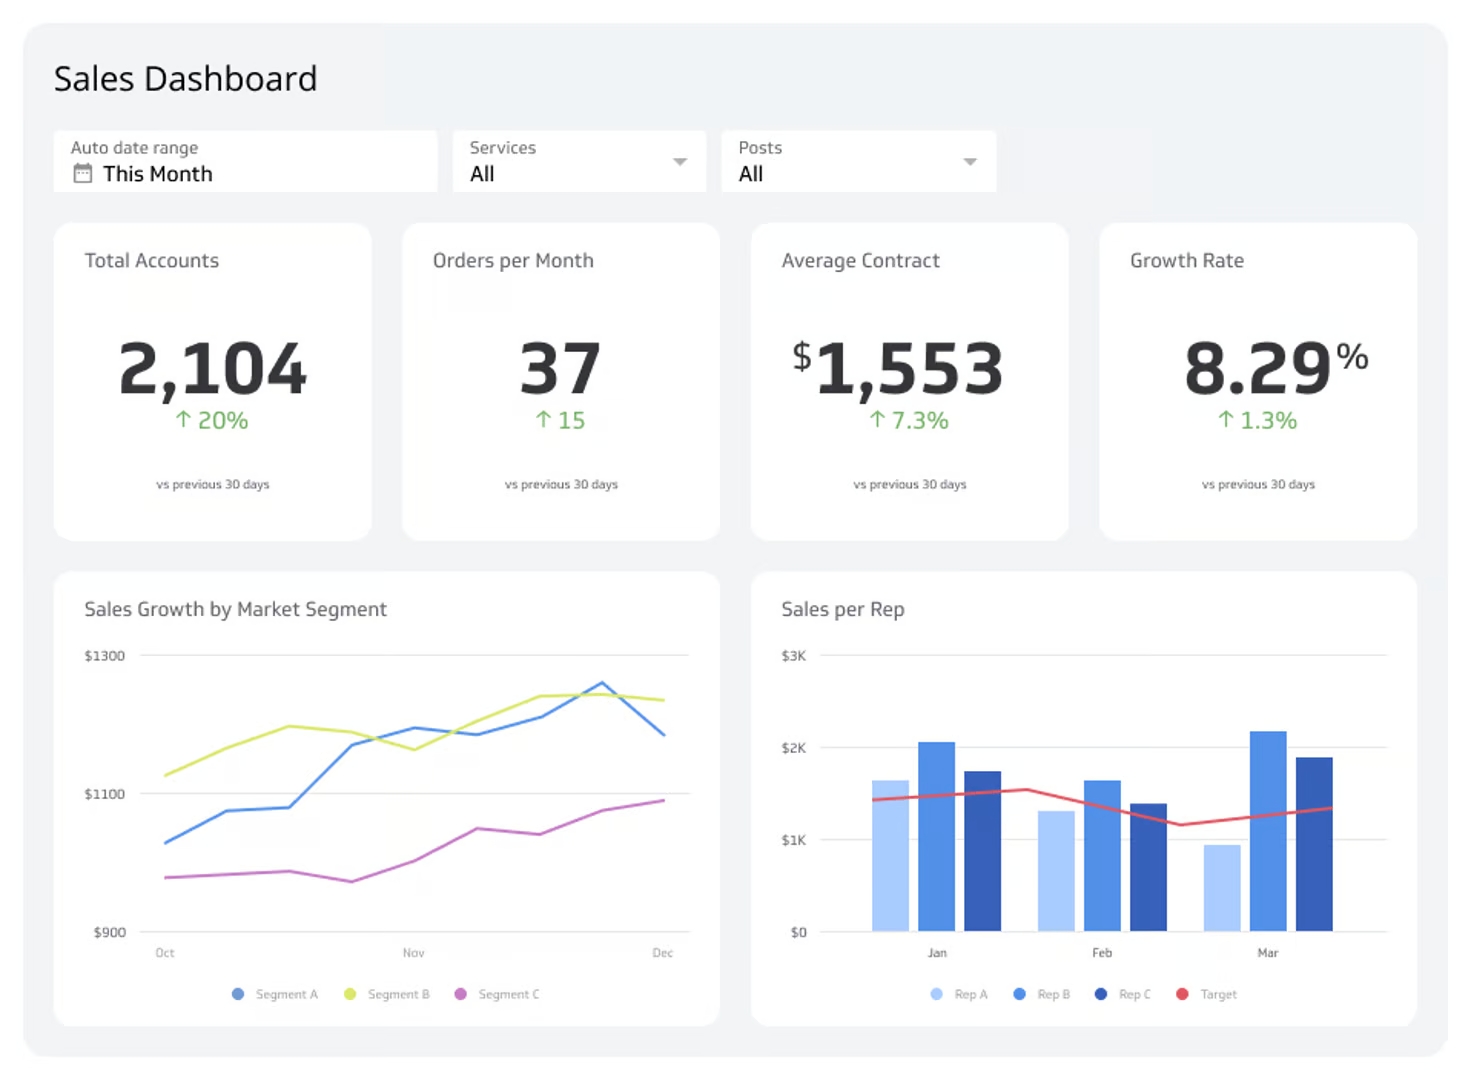
The sales analysis dashboard offers a complete breakdown of sales activities. It shows essential metrics through visualizations for detailed breakdowns. Using it lets you explore different scenarios and trends to streamline your revenue strategies and increase revenue.
Who’s it for | Business owners, sales managers, sales representatives, marketing teams, c-level executives |
How often it's needed | Daily, weekly, monthly, quarterly |
Covered KPIs | Total sales revenue, sales by product category, sales by region/state, sales by manager/representative, quarterly sales performance, sales trends over time, conversion rates, average deal size, sales pipeline velocity |
Boost your sales activities with Klipfolio
A sales activity dashboard monitors salespeople's tasks and links them to business outcomes. You can use their insights to boost productivity and address issues before they impact revenue.
With customizable visualizations, Klipfolio delivers real-time insights to supercharge your sales performance. Monitor key metrics, track collective progress, and identify areas for improvement at one glance. Start your free trial today.
Related Dashboards
View all dashboards


