Lead Generation Dashboard
Track the metrics that matter and turn insights into action.
What is a lead generation dashboard?
A lead generation dashboard tracks your most important campaign metrics in one place, showing you which marketing strategies are working and which need a rethink.
Are your landing pages converting? Are your keywords hitting the mark? With a clear view of your marketing performance, you can measure return on investment (ROI), justify your budget, and refine your strategies for maximum impact.
Lead generation dashboard examples
Facebook Ads Campaign Performance Dashboard
This dashboard gives you a complete view of your Facebook ad campaigns, helping you make data-driven decisions and allocate your budget effectively. It summarizes vital data so you can spot trends, measure success, and grow your return on investment.
| Who's it for | Digital marketers, social media managers, business owners, advertising agencies, e-commerce managers |
| How often it's needed | Daily, weekly, monthly |
| Covered KPIs | Click-through rate (CTR), cost per click (CPC), sales conversion rate, cost per conversion, return on ad spend (ROAS), impressions and reach, frequency, engagement rate, ad relevance score, cost per thousand impressions (CPM), total spending, budget pacing |
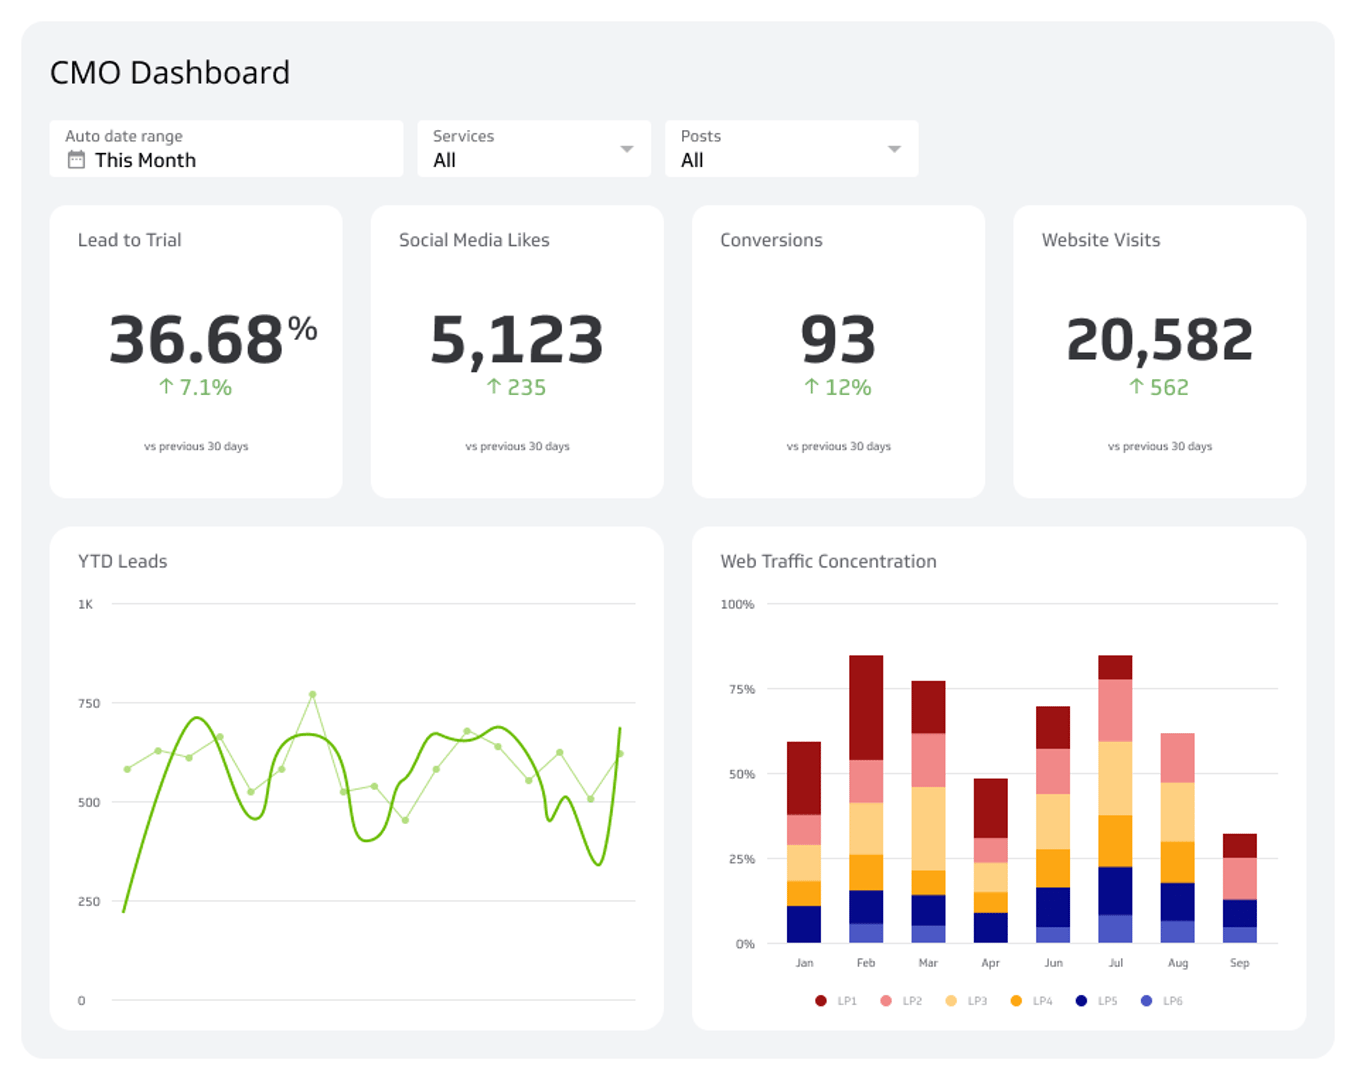
Google Analytics 4 Acquisition Overview Dashboard
The Google Analytics 4 Acquisition Overview Dashboard shows how users find and interact with your website or app. It pinpoints your top-performing channels, offers insight into audience growth, and tracks revenue. This big-picture view helps you improve your lead acquisition methods and allocate your marketing budget wisely.
| Who's it for | Digital marketers, website owners, e-commerce managers, content creators, SEO specialists, business analysts, product managers |
| How often it's needed | Daily, weekly, monthly, quarterly |
| Covered KPIs | User acquisition by channel, new user percentage, conversion rates by acquisition channel, revenue by acquisition channel, average engagement time by source, pages/screens per session by source, bounce rate by acquisition channel, user retention by acquisition source, campaign performance metrics, first user source attribution, customer lifetime value (CLV) |
YouTube Channel Performance Dashboard
A YouTube Channel Performance Dashboard provides a broad overview of your channel's growth and engagement. It lets you monitor subscriber trends, viewer watch time, and audience interactions with your content. By reviewing related YouTube metrics, you can identify your most successful videos and fine-tune your content strategy.
| Who's it for | Content creators, YouTube channel managers, social media marketers, brand managers, digital marketing teams, video production teams, social media influencers |
| How often it's needed | Daily, weekly, monthly, quarterly |
| Covered KPIs | Subscribers (total and growth rate), views (total and per video), watch time, audience retention rate, average session duration, engagement rate (likes, comments, shares), CTR for thumbnails and cards, top-performing videos, traffic sources, audience demographics, impressions, card click-through rate, end screen element click rate, subscriber vs. non-subscriber views, live stream performance metrics |
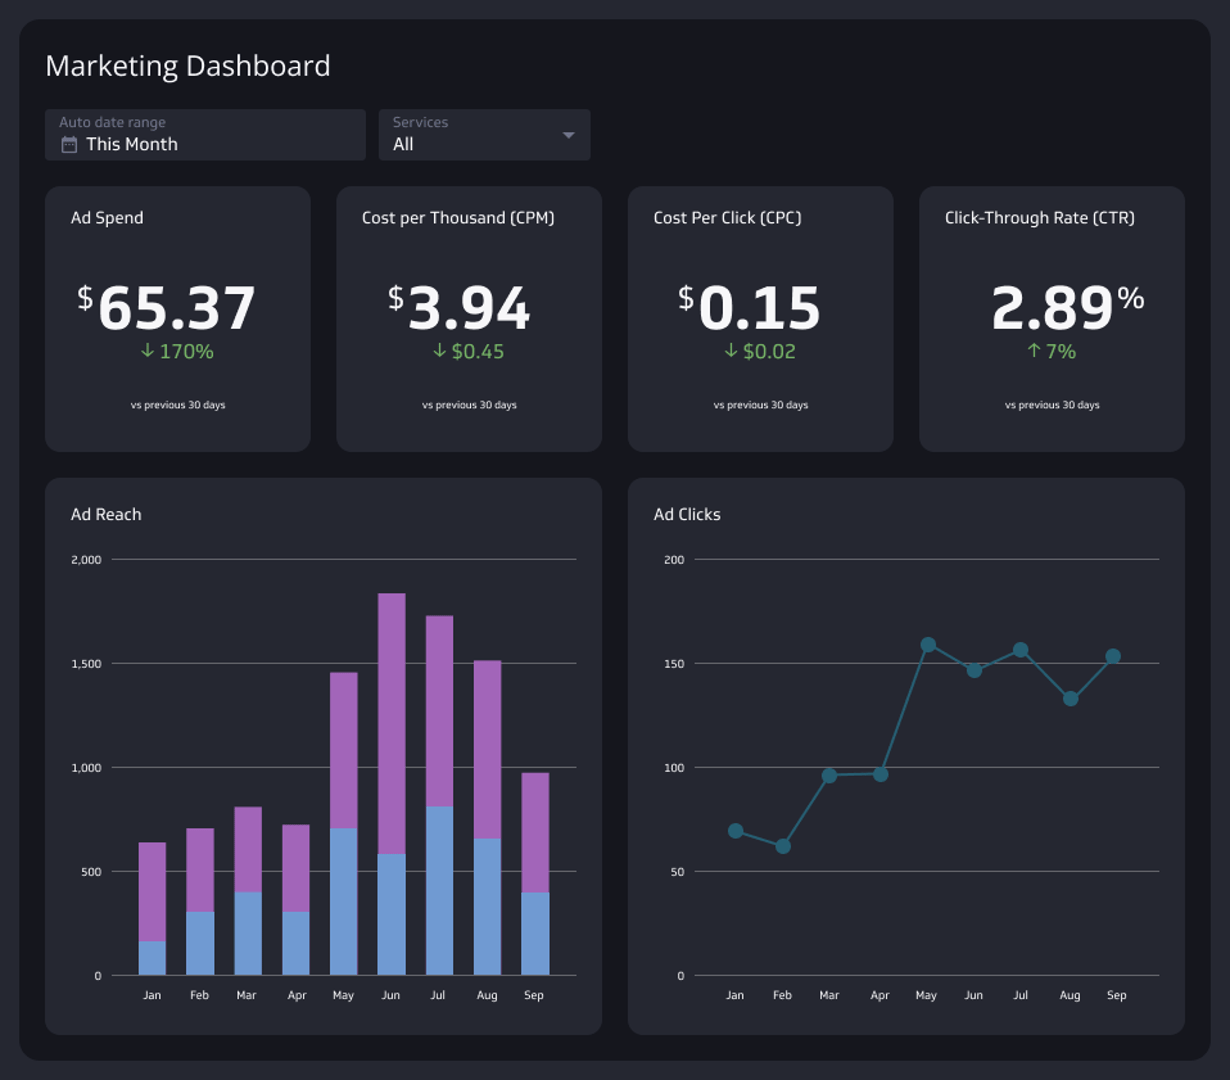
Google Ads Dashboard
Get a comprehensive view of your Google ad campaigns with a Google Ads dashboard. This dashboard lets you monitor KPIs that measure overall campaign effectiveness. With this data, you can refine your conversion process, improve your strategies, and make better use of your ad spend.
| Who's it for | Digital marketing managers, PPC specialists, advertising agencies, business owners, e-commerce managers, marketing directors, media buyers, performance marketers |
| How often it's needed | Daily, weekly, monthly, quarterly |
| Covered KPIs | Impressions, clicks, CTR, CPC, conversions, conversion rate, cost per conversion, ROAS, quality score, average position, impression share, budget utilization, ad relevance, landing page experience, search lost impression share, bounce rate, average session duration, pages per session, geographic performance, device performance, ad schedule performance, keyword performance, ad group performance, audience performance, remarketing list performance |
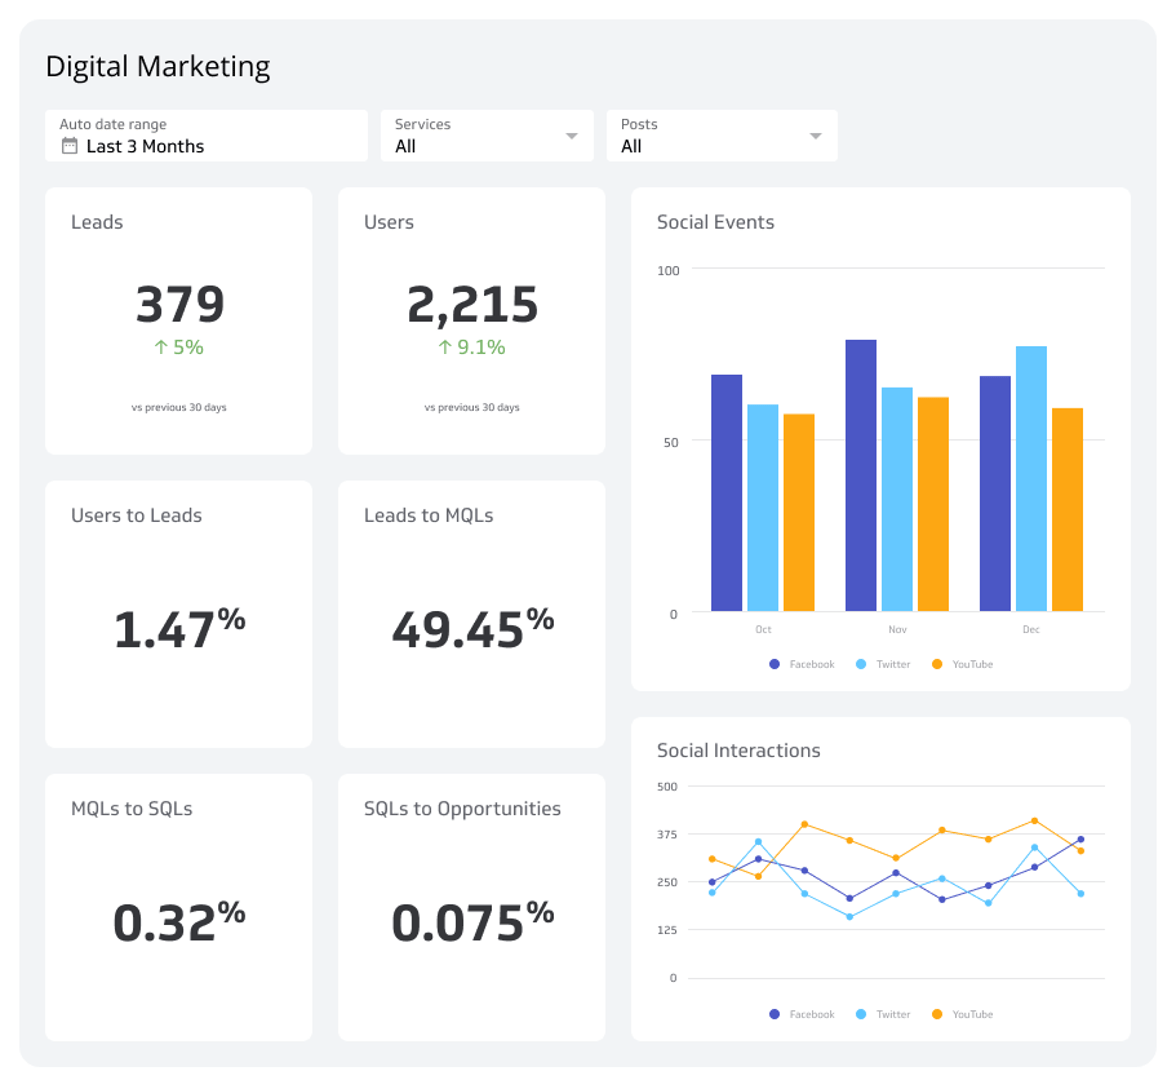
Social Networks Dashboard
A Social Networks Dashboard offers a breakdown of your performance across all major social media platforms. It tracks key growth and engagement metrics in real time, revealing trends and measuring your marketing success. Using a social networks dashboard empowers you to strengthen your social presence, boost engagement, and grow your audience efficiently.
| Who's it for | Social media managers, digital marketing teams, community managers, brand managers, content creators, influencers, PR professionals, marketing directors, business owners, customer service teams |
| How often it's needed | Daily, weekly, monthly, quarterly |
| Covered KPIs | Follower growth rate, engagement rate (likes, comments, shares, reactions), reach (organic and paid), impressions, CTR, post frequency, best-performing content types, audience demographics, sentiment analysis, response time, mentions and tags, video views and completion rate, story views and completion rate, hashtag performance, traffic from social to website, conversions from social media, CPC for paid campaigns, ROAS for paid campaigns, influencer campaign performance, user-generated content metrics, competitor benchmarking, best times to post |
LinkedIn Ads Campaign Performance Dashboard
The LinkedIn Ads Campaign Performance Dashboard provides a high-level overview of your ads' performance, helping you track ROI effectively. This is particularly valuable for B2B companies, where identifying high-quality leads is critical for the sales pipeline. It allows for rapid assessment and adjustment of ad strategies to connect with the right professional audience.
| Who's it for | B2B managers, LinkedIn advertising specialists, digital marketing managers, lead generation managers, marketing agencies |
| How often it's needed | Daily, weekly, monthly |
| Covered KPIs | Impressions, clicks, CTR, CPC, conversions, conversion rate, cost per conversion, ROAS, lead generation metrics (number of leads, cost per lead), audience demographics, budget utilization, ad format performance comparison, audience segment performance |
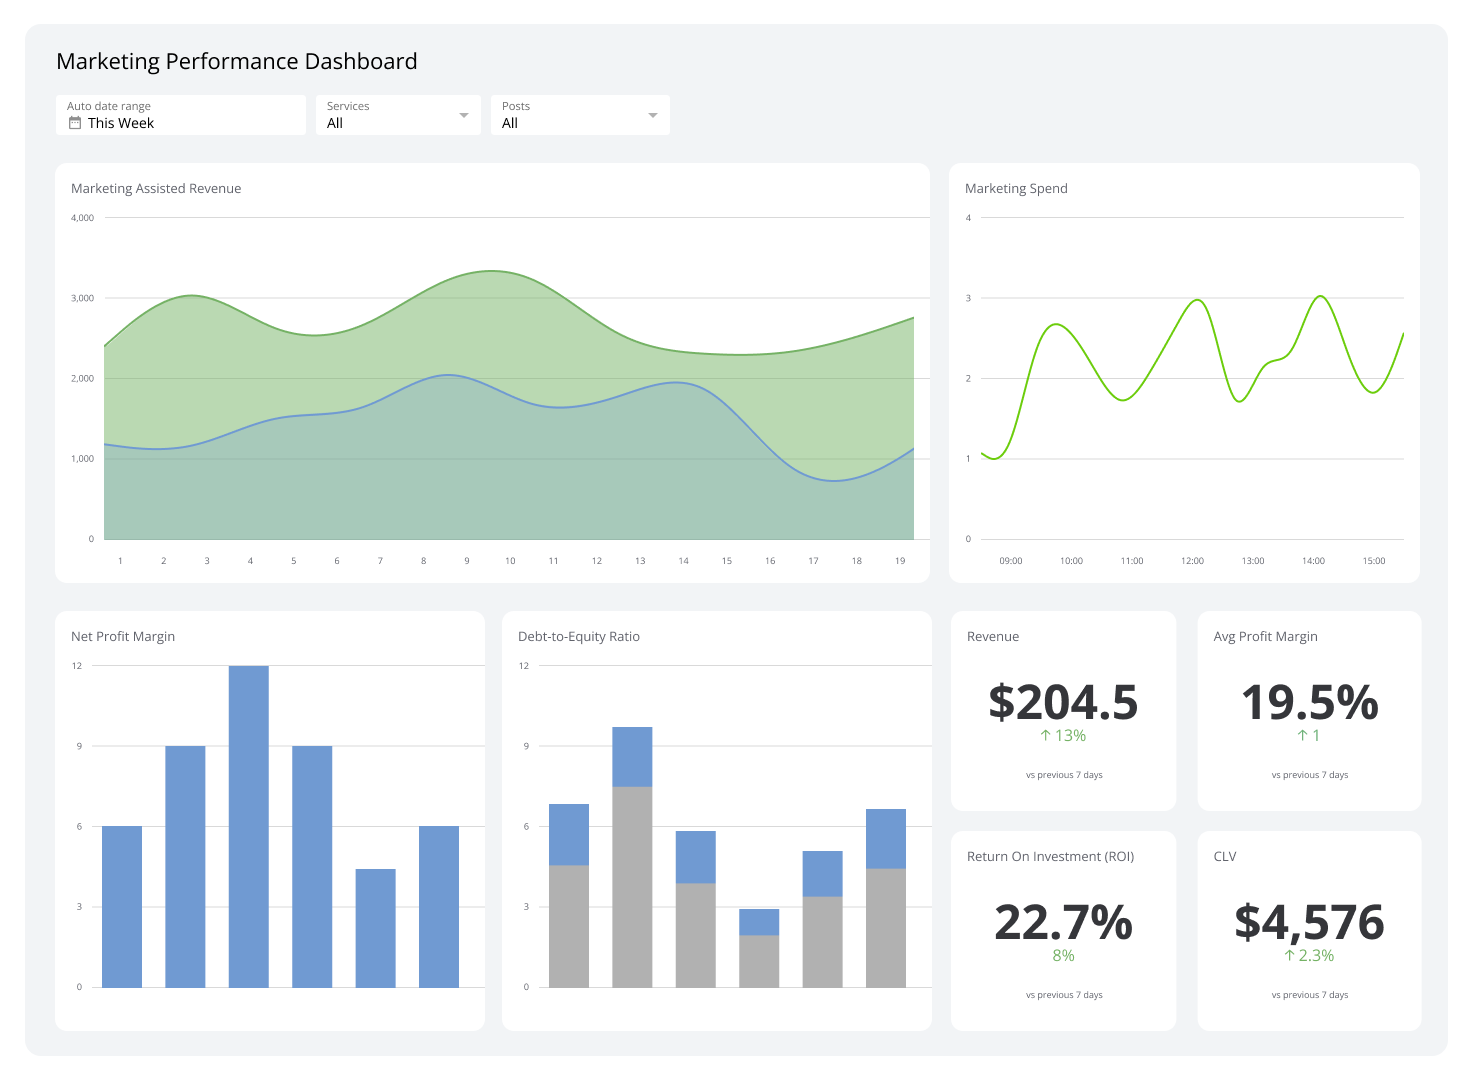
Marketing and Sales Deals Overview Dashboard
A Marketing and Sales Deals Overview Dashboard connects data from your marketing platforms and CRM systems to give you a complete picture of your sales funnel. It provides up-to-date insights into deal progression and monthly sales targets, and visualizes the customer journey to identify where potential leads are lost. This is essential for aligning marketing and sales teams around a single source of truth.
| Who's it for | Sales directors, sales teams, marketing managers and directors, business development representatives, account executives, C-level executives, sales operations teams, marketing operations teams |
| How often it's needed | Daily, weekly, monthly, quarterly |
| Covered KPIs | Total pipeline value, number of deals in pipeline, average deal size, win rate, sales cycle length, conversion rates between pipeline stages, monthly/quarterly revenue targets vs. actuals, lead-to-opportunity conversion rate, opportunity-to-win conversion rate, CAC, customer lifetime value (CLV), marketing qualified leads (MQLs) generated, sales qualified leads (SQLs) generated, deal velocity, top-performing products or services, top-performing sales representatives, revenue by marketing channel, return on marketing investment (ROMI), customer churn rate, upsell and cross-sell rates, sales leads |
Email Marketing Overview Dashboard
An Email Marketing Overview Dashboard helps you identify your most successful campaigns and find critical drop-off points in your email funnel. Are your subject lines effective? Is your CTA driving clicks? Use these insights to nurture leads more effectively and drive better results.
| Who's it for | Email marketing managers, digital marketing directors, content marketers, marketing automation specialists, customer engagement teams, marketing analysts, CMOs and marketing executives |
| How often it's needed | Daily, weekly, monthly, quarterly |
| Covered KPIs | CTR, open rate, conversion rate, bounce rate (soft and hard bounces), unsubscribe rate, list growth rate, email forwards, overall ROI of email campaigns, revenue per email sent, average order value from email campaigns, email marketing engagement score, email bounce rate, mobile open rate, A/B test results, top-performing email templates, top-performing subject lines, subscriber segmentation effectiveness, email campaign frequency |
Build your lead generation dashboard with Klipfolio Klips
Your campaign data is scattered across spreadsheets, platform-specific analytics, and weekly reports. A lead generation dashboard brings all your key metrics together so you can see what's working, prove your impact, and act faster.
With Klipfolio Klips, you can build a custom dashboard examples that connects your data sources, tracks ROI in real time, and visualizes your entire lead funnel. Start building today — no credit card required.
At a glance
Focus Area
Lead generation, campaign performance tracking, marketing ROI, paid advertising, email marketing, social media analytics
Metrics List
CTR, CPC, ROAS, conversion rate, cost per lead, MQLs, SQLs, CLV, engagement rate, impressions, bounce rate, open rate
Reference Rate
Daily, weekly, monthly, quarterly depending on channel and dashboard type
Related Dashboards
View all dashboards