Google Ads Dashboard
A Google Ads dashboard gathers and displays metrics like click-through rates and cost per click to track the performance of your Google-executed ad campaigns.
What is a Google Ads dashboard?
A Google Ads dashboard transforms raw ad data into visual metrics—impressions, clicks, conversions, and cost per conversion—so you can assess campaign performance at a glance. It centralizes performance data across campaigns, ad groups, and keywords, helping you track what's working and identify optimization opportunities.
Dashboards provide insights into ad spend, return on ad spend (ROAS), click-through rates (CTR), and quality scores to guide your optimization efforts. By customizing your view to focus on the metrics that matter most, you can monitor trends over time and make informed decisions about budget allocation and bid adjustments.
Examples of Google Ads dashboards
Executive Google Ads dashboard
An executive Google Ads dashboard gives stakeholders a clear overview of campaign performance and its impact on business goals. It helps you quickly assess whether campaigns are meeting strategic objectives and identify underperforming areas.
This dashboard provides a strategic view of ad performance across multiple channels, devices, and geographies, making it easier to allocate advertising budgets effectively and focus resources where they matter most.
| Who's it for | Marketing executives, advertising managers, digital strategists, C-suite leaders |
|---|---|
| How often it's needed | Real-time, daily, weekly, monthly, quarterly |
| Covered KPIs | Total ad spend, click-through rate (CTR), cost per click (CPC), cost per acquisition (CPA), return on ad spend (ROAS), impressions, conversions, conversion rate, top-performing keywords, ad quality scores, audience engagement metrics, campaign performance by geographic location, device breakdown (desktop, mobile, tablet), bounce rate from ad traffic, ad frequency, average ad position, percentage of budget spent, video ad view rate (for video campaigns), lifetime value (LTV) of ad-driven customers, impression share, ad relevance score, cost per impression (CPI), top-performing ad creatives, days and times with the highest engagement, percentage of conversions by ad type |
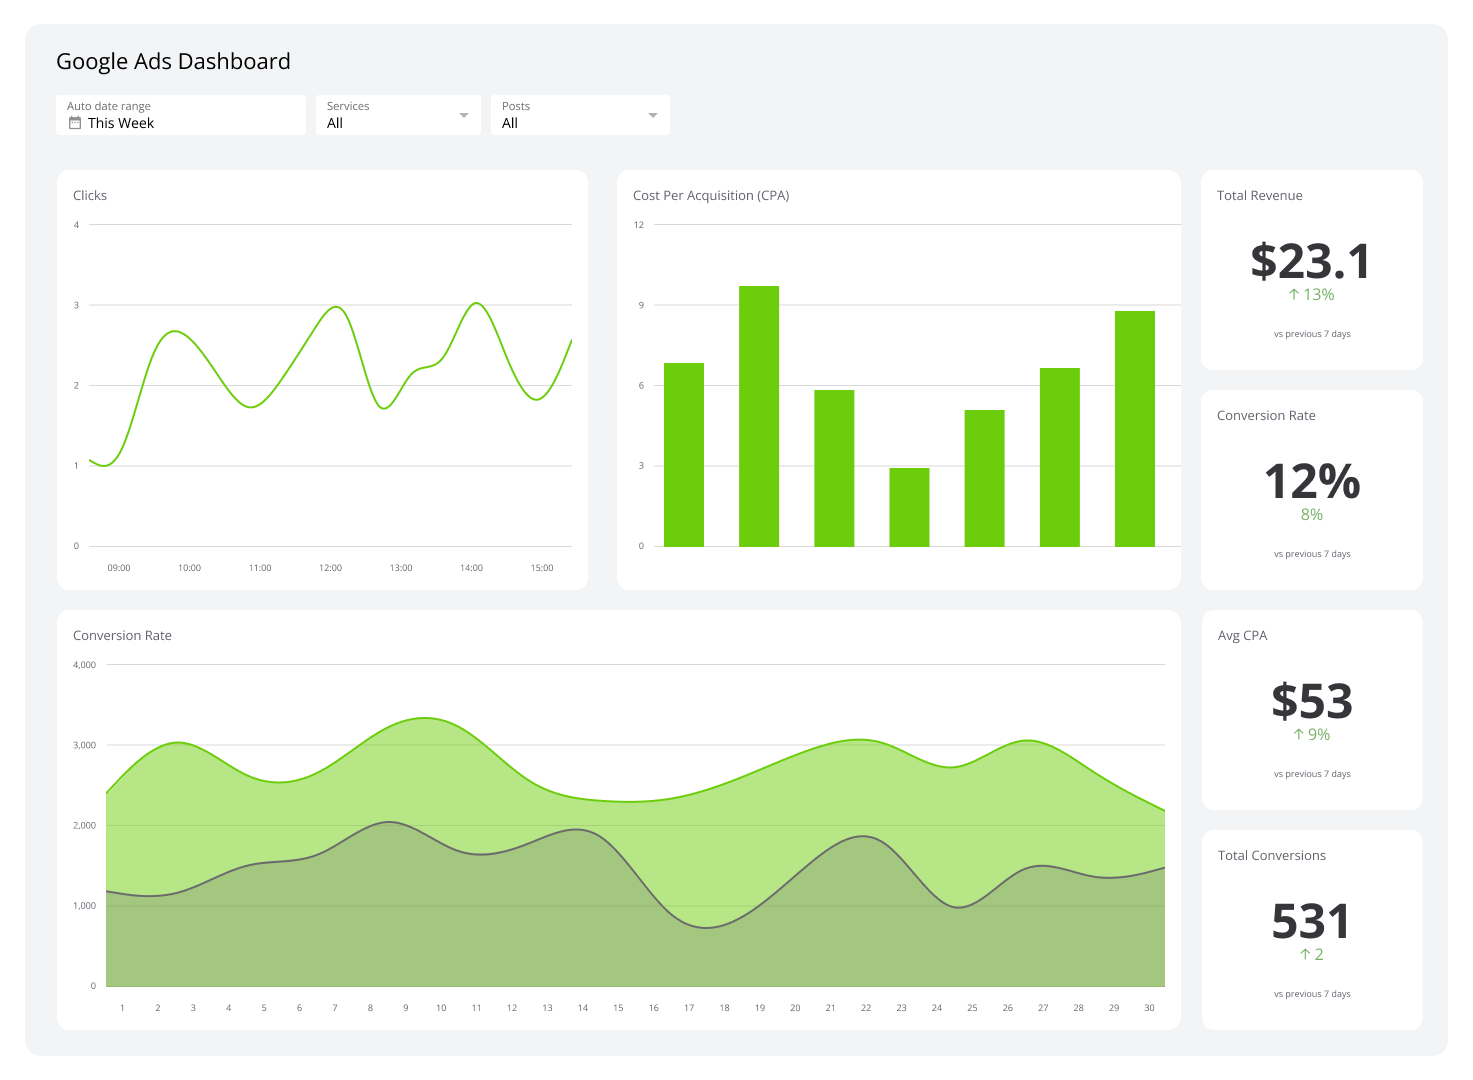
Google Ads campaign performance overview dashboard
A campaign performance overview dashboard tracks and assesses the performance of individual Google Ads campaigns. They display metrics such as impressions, clicks, click-through rate (CTR), cost per click (CPC), and conversion rates to show how each campaign performs against set objectives.
With live data updates, this dashboard enables you to rapidly adjust ad copy, keywords, and targeting to optimize performance. It recognizes underperforming campaigns and provides actionable insights for more informed decision-making. By consolidating all key performance metrics in one place, it simplifies campaign management and saves you time.
| Who's it for | Marketing managers, digital advertisers, campaign strategists, executives |
|---|---|
| How often it's needed | Real-time, daily, weekly, monthly, quarterly |
| Covered KPIs | Conversions, total ad spend, bounce rate from ad traffic, audience reach, cost per acquisition (CPA), click-through rate (CTR), ad quality score, top-performing keywords, campaign ROI, video ad view rates (if applicable), return on ad spend (ROAS), impressions, ad engagement rate by device type, frequency of ad views, demographic breakdown of ad engagement, cost per click (CPC), ad placement performance (search vs. display network), budget utilization percentage, conversion value, average position of ads, impression share, conversion rate by demographic, number of new leads generated, campaign performance over time |
Google Ads performance dashboard
A Google Ads performance dashboard focuses on the ad performance metrics of individual ads rather than entire campaigns. This dashboard provides granular insights into each ad's performance, allowing for more precise optimization.
Unlike the campaign performance overview dashboard, which examines broader campaign data, this dashboard gives you detailed visibility into individual ad performance. It highlights underperforming ads and shows when to adjust ad copy, targeting, or bidding strategies to improve results.
| Who's it for | Digital marketers, campaign managers, ad strategists, executives |
|---|---|
| How often it's needed | Real-time, daily, weekly, monthly, quarterly |
| Covered KPIs | Ad spend, cost per acquisition (CPA), impressions, click-through rate (CTR), bounce rate from ad traffic, campaign performance trends over time, return on ad spend (ROAS), total number of clicks, ad engagement by device type, conversion value, ad placement performance (search vs. display network), top-performing keywords, competitor impression share analysis, conversion rate, audience reach, frequency of ad views, video view rates, demographic breakdown of ad engagement, budget utilization rate, ad quality score, cost per click (CPC), number of new leads generated, ad engagement by geographic region, impression share, effectiveness of remarketing campaigns, landing page performance, ad viewability rate, share of voice (SOV) in the market, percentage of conversions from first-time visitors, cross-channel attribution metrics, ad scheduling performance, lifetime value of customers acquired through ads, time-lag to conversion, ad fatigue analysis, percentage of conversions from mobile devices, split-testing (A/B) results for ad variants |
Google Ads keyword analysis dashboard
A keyword analysis dashboard concentrates on the performance of keywords in your ads. They show how each keyword drives traffic, clicks, and conversions, helping you identify the ones that deliver the best results.
Unlike dashboards that examine overall campaigns, these dive deep into keyword-specific data to spot trends and issues. They highlight underperforming keywords and opportunities for better targeting, allowing you to adjust bids and strategies more effectively.
| Who's it for | Digital marketers, SEO specialists, campaign managers, content strategists, executives |
|---|---|
| How often it's needed | Real-time, daily, weekly, monthly, quarterly |
| Covered KPIs | Top-performing keywords, keyword quality scores, cost per click (CPC) by keyword, keyword match type performance, conversion rates for specific keywords, impressions by keyword, click-through rate (CTR) by keyword, search volume trends for targeted keywords, keyword competition level, negative keyword impact, keyword relevance scores, return on ad spend (ROAS) by keyword, keyword ranking changes over time, percentage of budget spent on top-performing keywords, cost per conversion by keyword, keyword performance by geographic location, bounce rate for traffic driven by specific keywords, keyword performance segmented by device, ad spend distribution across keyword groups, impression share of targeted keywords, long-tail keyword effectiveness, performance of branded vs. non-branded keywords |
Facebook Ads + Google Ads dashboard
A Facebook Ads Google Ads dashboard provides a unified view of advertising performance across both platforms. It allows you to analyze data such as impressions, video views, cost per conversion, and audience reach side by side.
By comparing metrics across platforms, this dashboard helps determine which platform yields the best results for specific campaigns or target demographics. It also reveals differences in audience engagement, ad spend efficiency, and conversion paths, offering deeper insights into their unique strengths.
| Who's it for | Digital marketers, advertising managers, campaign analysts, media buyers, business owners |
|---|---|
| How often it's needed | Real-time, daily, weekly, monthly, quarterly |
| Covered KPIs | Total ad spend, click-through rate (CTR), cost per click (CPC), return on ad spend (ROAS), total conversions, conversion rate, cost per acquisition (CPA), impressions, reach, ad frequency, campaign performance by device, geographic performance breakdown, audience demographic insights, ad placement performance (Facebook vs. Google), keyword performance, ad relevance scores, bounce rate, quality score, engagement rate (likes, comments, shares), cost per thousand impressions (CPM), total budget allocation, ad creative performance (image vs. video), lead generation volume, cost per lead (CPL), search term performance, conversion by ad group, impression share across both platforms |
Google Ads peak hours dashboard
A peak hours dashboard highlights the times when your ads achieve the highest performance. It reveals patterns in clicks, conversions, and cost-efficiency to help you focus your budget on the most effective time frames.
This insight enables effective ad scheduling and bid adjustments to maximize campaign returns during peak hours. The dashboard also contrasts performance during peak and off-peak periods to uncover opportunities to refine ad spend and identifies variations across campaigns, regions, or audience segments for a detailed understanding of what works best at different times.
| Who's it for | Digital marketers, campaign managers, paid search analysts, business owners |
|---|---|
| How often it's needed | Real-time, daily, weekly, monthly |
| Covered KPIs | Ad performance by time of day, click-through rate (CTR) by hour, cost per click (CPC) by time, conversion rate by time of day, total ad spend during peak hours, return on ad spend (ROAS) by hour, number of conversions by hour, impressions by time of day, quality score by time slot, average position during peak hours, ad impressions by device, bounce rate during peak hours, cost per conversion by time, search term performance by time of day, cost per thousand impressions (CPM) by peak times, geographical performance during peak hours, audience demographics engagement during peak times |
Google Ads monthly breakdown dashboard
A monthly breakdown dashboard provides a complete view of ad performance on a month-by-month basis. They organize metrics such as ad spend, clicks, conversions, and click-through rate (CTR) to reveal trends and patterns over time.
This helps you assess how campaign performance aligns with seasonal changes, promotional periods, or shifts in audience behavior. It also enables better budget forecasting and strategic planning by offering clear month-to-month comparisons. By highlighting underperforming months or areas of inefficiency, you can make targeted improvements quickly.
| Who's it for | Digital marketers, campaign managers, business owners, analysts |
|---|---|
| How often it's needed | Monthly |
| Covered KPIs | Click-through rate (CTR), total clicks, total ad spend, return on ad spend (ROAS), cost per click (CPC), cost per thousand impressions (CPM), conversion rate, impressions by device, top-performing ads, cost per conversion, geographical performance, ad group performance, impressions by location, audience engagement metrics, ad schedule performance, budget allocation by campaign, search term performance, quality score, campaign performance by keyword, total impressions, clicks by device, conversions by device, budget pacing |
Get valuable insights from your Google Ads data in one place
A Google Ads dashboard is essential for refining your advertising strategies. It offers a clear and organized view of metrics like click-through rates, conversion rates, and cost per conversion, providing in-depth insights into your campaigns, ad groups, and keyword performance.
With the right dashboard, you can pinpoint areas for improvement and maximize ROI. Klipfolio offers a customizable dashboard solution that integrates seamlessly with Google Ads, enabling real-time updates and data visualization across multiple campaigns. Try our platform free today.
At a glance
Focus Area
Google Ads campaign performance, ad optimization, and budget allocation
Metrics List
Impressions, clicks, conversions, cost per click, click-through rate, return on ad spend, quality scores, conversion rates, cost per acquisition
Reference Rate
Real-time, daily, weekly, monthly
Related Dashboards
View all dashboards