Marketing Performance Dashboard
Your marketing ROI, in real-time.
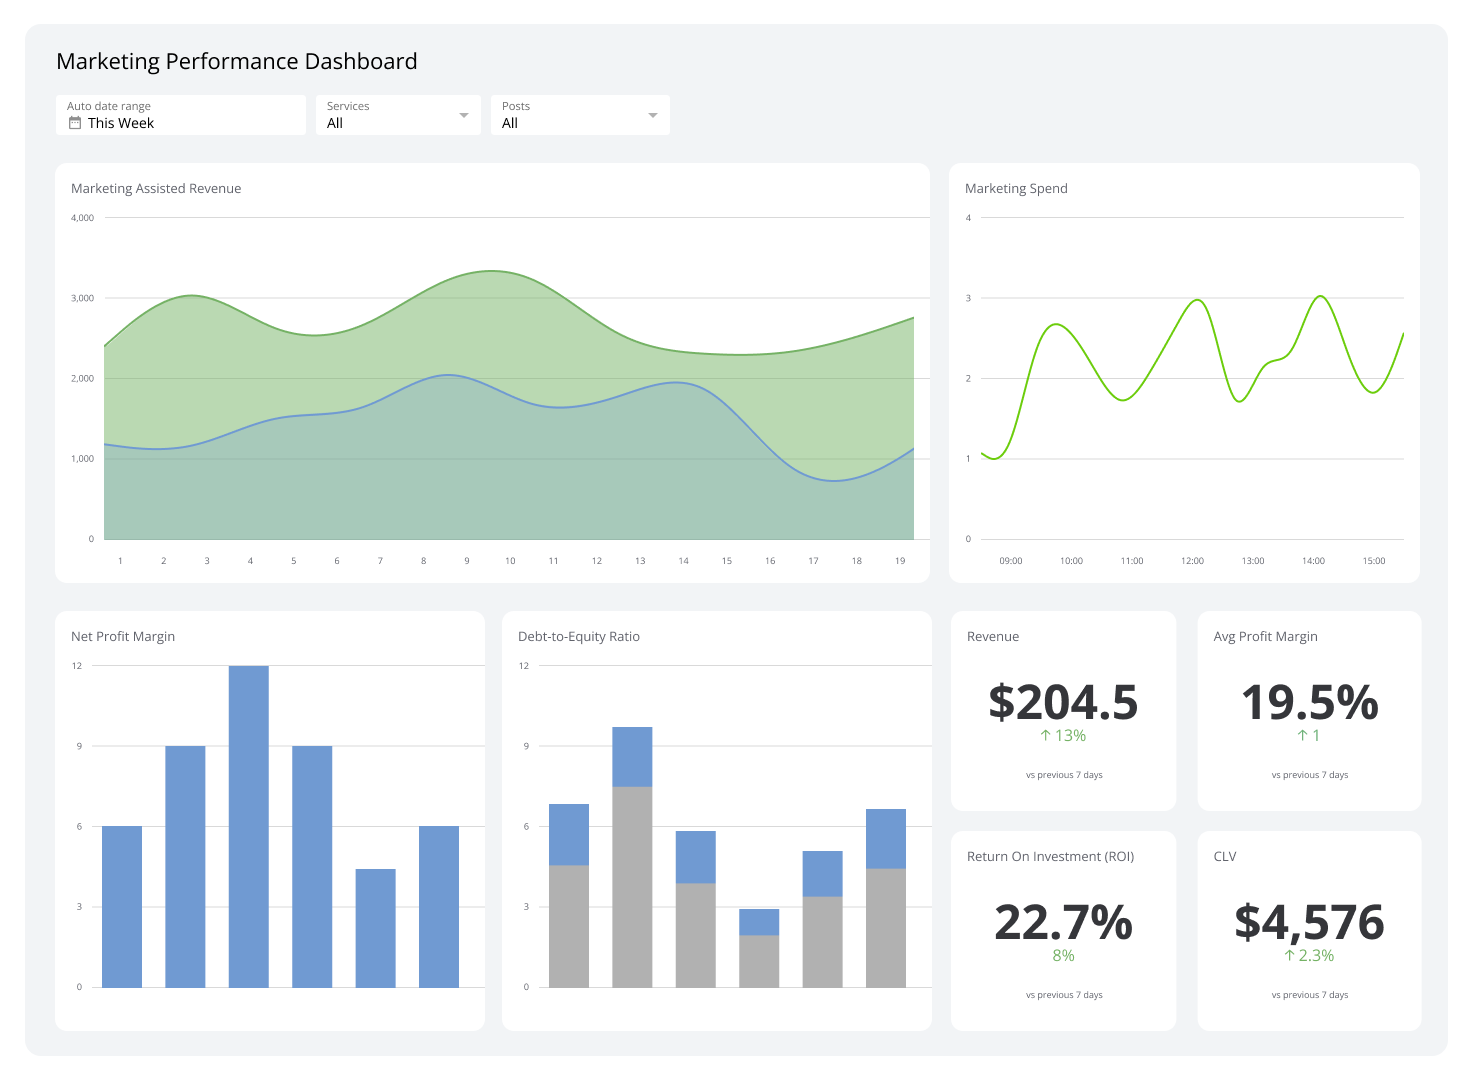
What is a marketing performance dashboard?
Is your marketing budget actually working? A marketing performance dashboard gives you a real-time, consolidated view of all your marketing data in one place.
This marketing dashboard moves you beyond siloed reports from different platforms. By visualizing your key metrics together, you can accurately assess the impact of your strategies, identify areas for improvement, and make data-driven decisions to improve every campaign for a better return on investment.
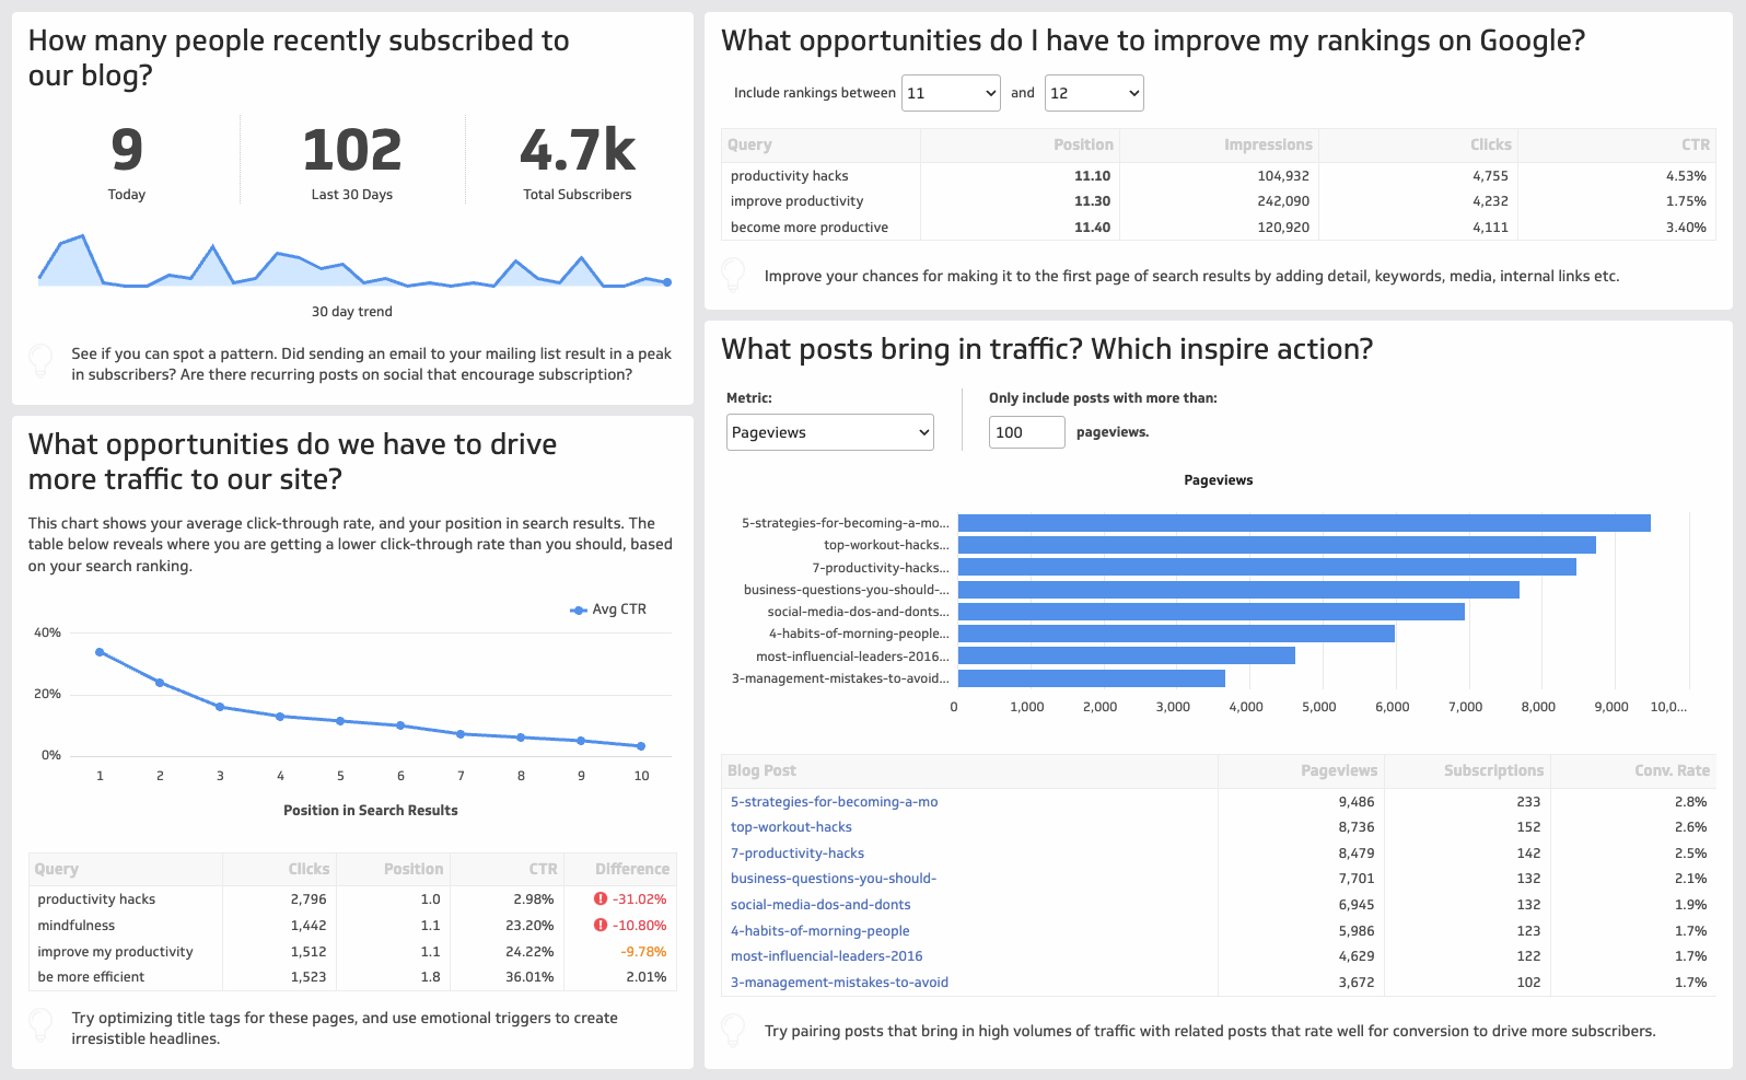
Key metrics for your marketing performance dashboard
An effective marketing dashboard connects your spending to real business results. Here are the essential metrics to track so you can understand what's working and what isn't.
- Cost Per Lead (CPL): Measure the cost-effectiveness of your marketing campaigns in generating new leads. Tracking CPL helps you allocate your budget to the channels that deliver the most value.
- Customer Acquisition Cost (CAC): Understand the total cost to acquire a new customer. When compared with customer lifetime value, CAC is a critical indicator of your business's long-term profitability and sustainability.
- Lead Generation: Monitor the volume of new leads your marketing efforts are generating. This is your pipeline's lifeblood and a key predictor of future sales.
- Lead-to-Conversion Rate: Track the percentage of leads that become paying customers. This metric helps you gauge the quality of your leads and the effectiveness of your sales funnel.
- Return on Marketing Investment (ROMI): The ultimate measure of marketing success. ROMI tells you how much revenue you're generating for every dollar spent on marketing, proving the value of your efforts to the rest of the business.
Why a marketing performance dashboard matters
Without a centralized view, marketing data lives in disconnected tools — your ad platform, your CRM, your email software, your analytics account. That fragmentation makes it nearly impossible to see the full picture, let alone act on it quickly.
A marketing performance dashboard solves this by pulling your data into a single, always-current view. Instead of building a manual report at the end of the month, your team can monitor performance daily and course-correct in real time.
This matters most when budgets are tight and every channel needs to justify its spend. When you can see CPL, CAC, and ROMI side by side, you stop guessing and start making decisions grounded in evidence.
What to include in your marketing performance dashboard
The right metrics depend on your audience. A dashboard built for your marketing team can go deep — channel-level breakdowns, funnel stage data, and campaign-specific KPIs. A dashboard built for executives should stay high-level, focusing on pipeline impact and revenue contribution.
Regardless of audience, most marketing performance dashboards benefit from tracking marketing KPIs across these areas:
- Acquisition: Cost Per Lead, Customer Acquisition Cost, traffic by channel
- Engagement: Click-through rate, bounce rate, average session duration
- Conversion: Lead-to-conversion rate, goal completion rate, pipeline value
- Revenue impact: ROMI, Return on Ad Spend (ROAS), revenue attributed to marketing
Keep the layout clean. Group related metrics visually, use consistent date ranges, and make sure every number on the dashboard connects to a decision someone can act on.
How to build a marketing performance dashboard with Klips
Stop guessing about your marketing ROI. With a custom dashboard, you get a holistic view of your efforts across social media, email, SEO, and paid advertising — all in one place.
Klipfolio Klips connects to 130+ data sources, including your ad platforms, CRM, email tools, and analytics accounts. Use Excel-like formulas to model your data, choose from 30+ visualization types, and distribute your dashboard to your team via TV mode, scheduled email, or embedded views.
Whether you're a marketing manager tracking daily campaign performance or a director presenting results to the leadership team, Klips gives you the flexibility to build exactly the marketing dashboard examples your audience needs — without waiting on a developer.
At a glance
Focus Area
Marketing performance tracking, campaign ROI, lead generation, and conversion monitoring.
Metrics List
Cost Per Lead, Customer Acquisition Cost, Lead Generation, Lead-to-Conversion Rate, Return on Marketing Investment (ROMI), ROAS, Click-Through Rate, Bounce Rate.
Reference Rate
Daily to weekly monitoring recommended for campaign-level metrics; monthly for strategic KPIs like CAC and ROMI.
Related Dashboards
View all dashboards