Click-Through Rate (CTR)
Click-Through Rate (CTR) is the percentage of people who click on a link after seeing it, across organic search, paid ads, and email campaigns.
Click-Through Rate by Blog Category
What is Click-Through Rate (CTR)?
Click-Through Rate (CTR) is the percentage of people who click on a link after seeing it. It tells you how well your content, ad, or search listing earns attention from the people who see it.
A high keyword ranking tells you where you appear. CTR tells you whether that position is actually working. Two pages can sit at the same rank and perform very differently, because one headline earns the click and the other doesn't.
Click-Through Rate formula
CTR = (Clicks / Impressions) × 100
Example: If your search listing appears 10,000 times and receives 750 clicks, your CTR is 7.5%.
CTR applies wherever a link is shown and clicked: organic search results, paid ads, email campaigns, and social media posts. The formula is the same across all of them.
Why CTR matters
CTR is a direct signal of relevance. When someone sees your listing and clicks it, they're telling you the headline, subject line, or ad copy matched what they were looking for.
In paid search, CTR carries extra weight. Platforms like Google use it as part of their quality scoring. A higher CTR can improve your ad placement and lower your cost per click, which means better results without more spend.
In organic search, a strong CTR means your title tags and meta descriptions are doing their job. A weak CTR on a page that ranks well is a clear prompt to rewrite the snippet, not the content.
Tracking CTR alongside Conversion Rate tells you the full story. High CTR with low conversions means you're earning the click but not delivering on the promise. Low CTR with high conversions means the people who do click are the right ones, but you're leaving volume on the table.
What is a good CTR?
There's no universal benchmark. CTR varies significantly by channel, industry, and position.
Organic search: The first result on a Google search page averages around 25 to 30% CTR. By position five, that drops to roughly 6 to 7%. Anything above 5% for a mid-page result is generally healthy.
Paid search: Average CTRs typically fall between 2 and 5%, depending on industry and keyword intent. High-intent keywords tend to earn higher CTRs.
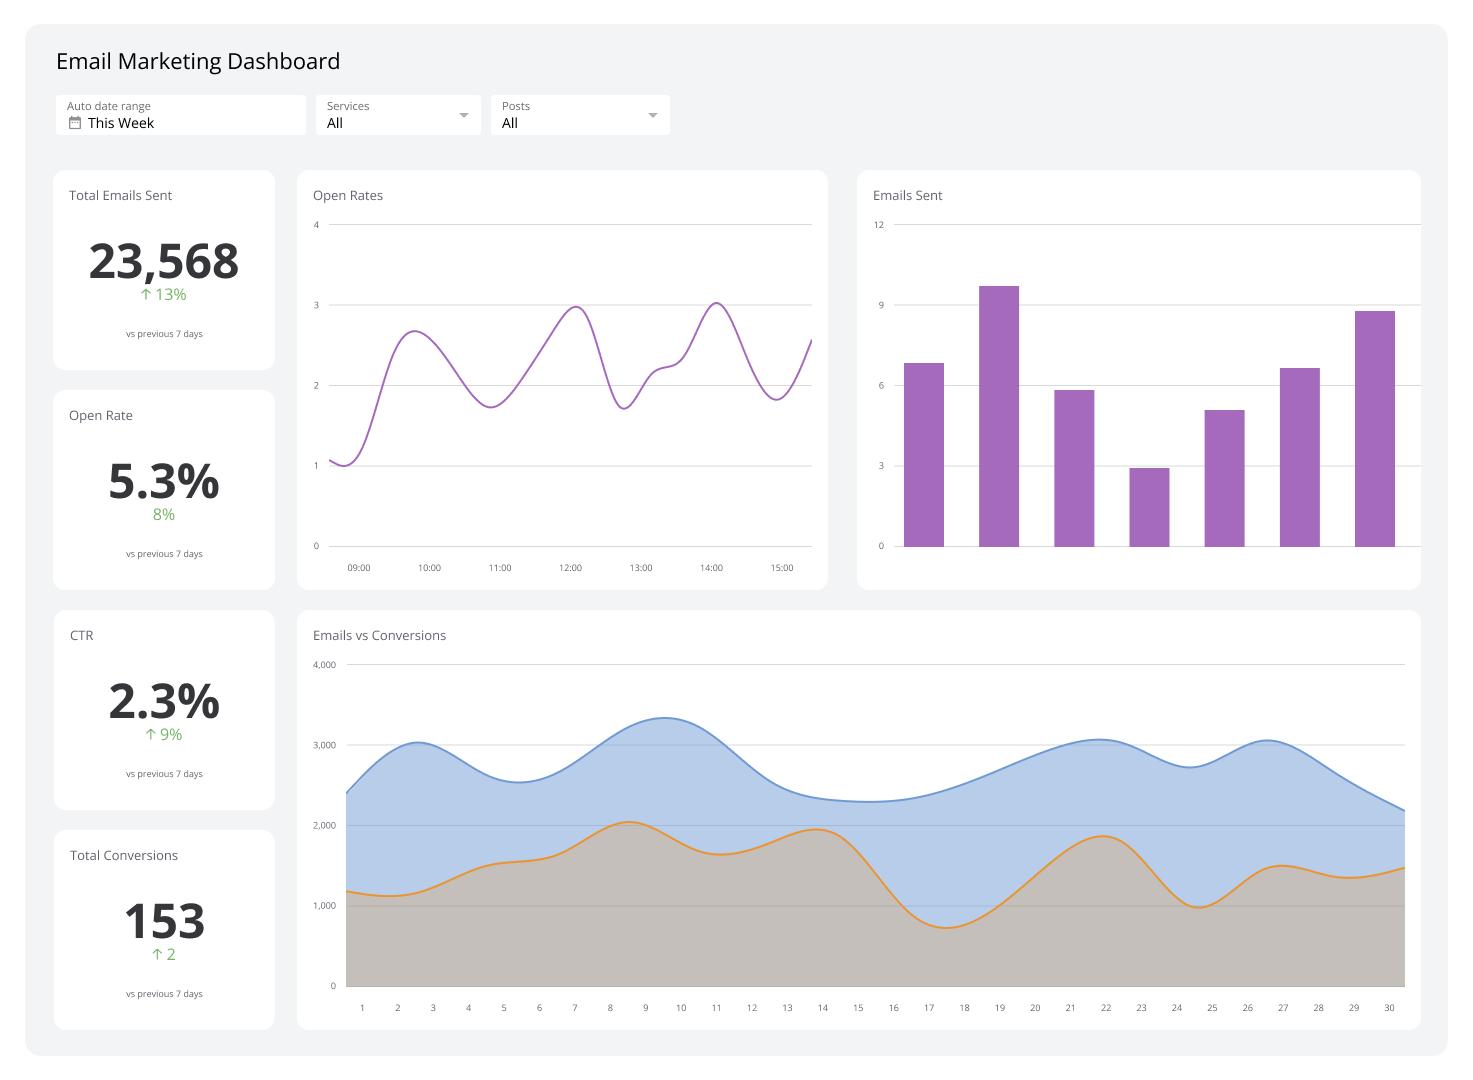
Email: Average email CTR across industries sits around 2 to 3%. B2B campaigns often see higher rates when the offer is specific and the list is well-segmented.
The most useful benchmark is your own historical data. If your CTR is rising, something is working. If it's falling, something changed, and it's worth finding out what.
How to improve CTR
Before running experiments, pull your CTR data by channel and by page or campaign. That tells you where the opportunity is largest.
Rewrite title tags and meta descriptions: These are the first thing a searcher sees. If your snippet doesn't match their intent, they won't click. Test specific, benefit-led language over generic descriptions.
Use numbers and specifics: Headlines with numbers ("7 ways to...") consistently outperform vague ones in both organic and paid search.
Match the message to the moment: Ad copy and email subject lines should reflect exactly what the audience is thinking at that point in their journey. Generic copy loses to specific copy every time.
Test subject lines for email: A/B test subject lines before sending to your full list. Small wording changes can move CTR by several percentage points.
Check your position: In organic search, moving from position five to position two can double your CTR without changing a word of copy. Improving the underlying page quality and earning backlinks matters here.
How to track CTR
Most platforms surface CTR natively. Google Search Console shows organic CTR by page and query. Google Ads and Meta Ads Manager report CTR at the campaign, ad set, and ad level. Email platforms like Mailchimp and HubSpot include CTR in standard send reports.
The challenge is that these numbers live in separate places. When you're running campaigns across search, social, and email at the same time, you're switching between platforms to get a complete picture, and by the time you've assembled the numbers, they're already out of date.
Pulling CTR alongside related metrics like Impressions, Conversion Rate, and Cost Per Click into a single dashboard means you can see the full picture without the manual assembly. That's where a tool like Klips helps: connect your data sources, set up the metrics that matter to your team, and keep them current automatically.
See the full list of digital marketing metrics & KPIs to track alongside CTR.
Reporting frequency
Monitor CTR weekly for active campaigns. Review monthly for organic search performance. For paid campaigns with significant spend, daily monitoring helps you catch drops before they cost you.
Create custom dashboards for you and your team.
Get started with KlipsCTR variations
Ad CTR: Clicks divided by impressions for a paid ad unit
Email CTR: Clicks on a link inside an email divided by emails delivered
Organic CTR: Clicks on a search result divided by impressions in search
| Variation | What it measures | Primary use |
|---|---|---|
| Organic CTR | Search listing performance | SEO |
| Ad CTR | Paid ad engagement | PPC, display |
| Email CTR | Email link engagement | Email marketing |