
Sales Conversion Rate
Measure of the effectiveness of your sales team at converting leads into new customers.
Qualified Leads to Win Conversion Rate
What is Sales Conversion Rate?
Sales Conversion Rate measures how effectively your sales team converts leads into paying customers. It's a critical metric for aligning sales and marketing around lead quality.
Marketing owns lead generation. Sales owns conversion. When those two functions share a common metric, it creates accountability on both sides. If marketing generates 100 leads and sales closes 10, your conversion rate is 10%. Whether that's strong or weak depends on your industry, your product, and your historical performance.
How to calculate Sales Conversion Rate
Sales Conversion Rate is the percentage of leads or visitors who become customers during a given period.
Sales Conversion Rate = (Number of Successful Conversions / Total Number of Leads or Visitors) × 100
For example, if your team receives 200 qualified leads in a month and closes 30 deals, your Sales Conversion Rate is 15%.
This formula works at any level of the funnel: by campaign, by channel, by rep, or across the entire pipeline.
How often to report on Sales Conversion Rate
Track Sales Conversion Rate weekly to catch short-term dips, and review it monthly to spot trends and inform strategy.
Who uses the Sales Conversion Rate metric?
Sales Managers use it to coach reps and identify pipeline gaps. Executives use it to assess go-to-market efficiency. Marketing teams use it to evaluate lead quality.
How to measure Sales Conversion Rate
Attribution is one of the hardest problems in sales and marketing. Prospects rarely follow a straight line from awareness to purchase. They're influenced by conferences, word of mouth, ads, and direct outreach, sometimes all at once. Even sophisticated attribution models can't capture everything.
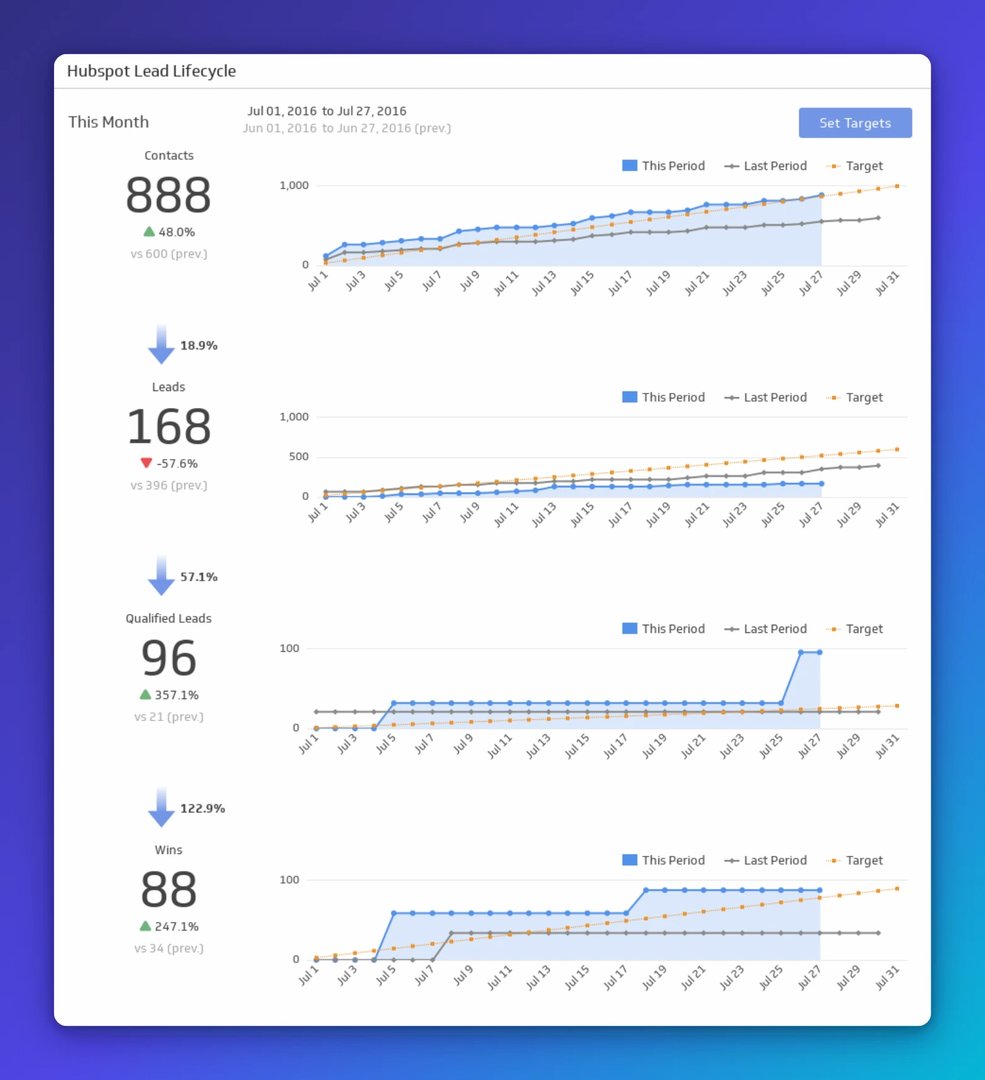
The most reliable approach is to measure conversion through a defined funnel with discrete stages. A common framework is the lead lifecycle:
Marketing Captured Leads: Contacts with a known name or email
Marketing Qualified Leads (MQLs): Leads marketing believes are ready for sales engagement
Sales Qualified Leads (SQLs): Leads sales has accepted and is actively working
Closed Won: Leads that converted to paying customers
Tracking conversion rates between each stage tells you where leads are dropping off and which part of the funnel needs attention. For a broader view of sales and marketing spend efficiency, the SaaS Magic Number is a useful companion metric.
When conversion rates are measured consistently across the funnel, both sales and marketing share a common frame of reference for the buyer's journey. That shared view makes it easier to diagnose problems and act on them quickly, without waiting for someone to pull a number or reconcile two different spreadsheets.
Here's an example of a lead lifecycle report.
What affects Sales Conversion Rate?
Several factors can push your conversion rate up or down:
Lead quality: Poorly qualified leads inflate your pipeline without improving conversions. Tightening your qualification criteria often raises conversion rates even if total lead volume drops.
Sales process: Long or inconsistent sales cycles reduce conversion. Standardizing your process and reducing friction at each stage helps.
Follow-up speed: Leads contacted quickly after showing intent convert at higher rates. Delays let competitors in.
Messaging fit: If your pitch doesn't match the prospect's pain point, conversion suffers regardless of lead quality.
What is a good Sales Conversion Rate?
There's no universal benchmark. Conversion rates vary widely by industry, deal size, and sales motion. A 5% rate might be exceptional for enterprise software and poor for e-commerce. Use your own historical data as the primary reference point, then layer in industry benchmarks where they're available.
Track the metric over time. A consistent upward trend signals improving alignment between marketing and sales. A sudden drop is a signal to investigate lead quality, messaging, or process changes.
The goal isn't a number. It's the confidence to know whether your pipeline is healthy and what to do when it isn't.
Create custom dashboards for you and your team.
Get started with KlipsHow to track Sales Conversion Rate with a dashboard
Tracking Sales Conversion Rate in a spreadsheet works at small scale, but it breaks down quickly as your pipeline grows and your data lives in multiple tools. Pasting numbers into a spreadsheet, or asking an AI tool to interpret them without full context, adds steps and introduces errors. A real-time dashboard connects your CRM, marketing platform, and other sources automatically, so the number is always current and always consistent.
With Klips, you can build a sales dashboard that pulls live data from your pipeline, visualizes conversion rates by stage or channel, and distributes it to the right people, without manual exports. When everyone sees the same numbers, sales and marketing can move faster on what the data is telling them.





