Content Engagement
Content engagement refers to a set of interactions with your content. These interactions are essential touchpoints that help users progress along their buying journey.
Track all your Digital Marketing KPIs in one place
Sign up for free and start making decisions for your business with confidence.

From liking a Facebook post to sharing a blog post, there are many different opportunities for users to engage with your content.
These interactions are crucial in helping users develop a long-term connection with your brand, progress along the buying journey, and gather the information they need to make a purchase decision.
As a marketer, you need to measure content engagement. Tracking engagement metrics can reveal much about your audience and help you improve your content marketing strategy to reflect what users want.
Why Does Content Matter?
From the moment users first hear about your brand to the instant they make a purchase decision, a series of interactions with your brand happens. Hopefully, these interactions continue after the purchase and result in a loyal customer.
These interactions result in a primarily self-directed user journey in a digital environment. Except for interactions with a salesperson or customer service representative, most touchpoints happen through users consuming your content.
For the past two decades, brands have increasingly invested in content marketing to create meaningful touchpoints supporting various buying tasks on multiple channels. Whether users are researching a solution to a pain point, comparing products, or simply seeking entertaining content, there is branded content that meets the user’s immediate needs.
Unsurprisingly, 60% of marketers describe content as a critical decision factor in their overall digital marketing strategy.
What Is Content Engagement?
Content engagement refers to a set of interactions with your content. These interactions can take several forms. Here are a few examples:
- A user can click on a piece of content.
- They can write a comment after consuming content.
- They can share your content with a friend.
- They can save the content to read later.
- Shoppers can subscribe to receive more content.
These interactions are essential touchpoints that help users progress along their buying journey. Still, they also give marketers valuable insights into how shoppers make buying decisions and how content can drive sales.
Why Measure Content Engagement?
Content engagement is more than a vanity metric. It unveils actionable insights into the user journey and content performance that can inform content creation and optimization efforts.
Content Marketing Performance and ROI
Did you know that less than a third of marketers consider their content marketing strategy as extremely or very successful?
In this situation, you should track content performance to optimize existing content and make data-driven decisions when investing in developing new content.
Any successful marketing campaign needs clear goals. Measuring these goals allows marketers to ensure that the campaign is on track and make adjustments if needed. From a financial point of view, measuring results helps marketers assess the ROI of different projects to justify spending and inform future financial decisions.
Measuring content performance can be tricky. Unless a piece of content directly leads to a sale, it’s generating qualitative value that can be hard to capture.
A possible approach is to measure content engagement to assess the qualitative value of a piece of content. Content engagement can paint a comprehensive picture of how a piece of content helps a user progress along the buying journey and ultimately leads to a sale.
Better Understanding of Your Target Audience
Tracking content engagement can reveal a lot about your audience. For instance, comparing engagement between similar pieces of content published on different channels can help you identify which channels users prefer.
You can use a similar approach to determine which content formats or topics resonate with your target audience.
Mapping the User’s Journey
Mapping the user’s buying journey will help you better connect with your audience and develop content that consistently converts users to the next stage of their journey.
Content engagement can act as a breadcrumb trail. Follow this trail to track and understand the user’s buying process.
Things like comments can reveal the questions and challenges users encounter, while clicks show which pieces of content help users find the next step in their journey.
Nurturing Leads and Existing Customers
B2B marketers must consider that almost half of the buying journey consists of independent research. This trend is, even more, defining for the B2C space.
With few opportunities to interact with prospects and existing customers in person, content nurtures leads.
Measuring content engagement is an excellent way to assess how well content fulfills this purpose.
Making Strategic Decisions
Content engagement metrics can support strategic decisions. They can inform content marketing strategies by helping you identify a need for information you can meet with new content. You can also develop content aligned with the latest trends mentioned in comments or recommend a different next step if users seem to stop consuming content at a specific point.
You can also use content engagement to optimize your publication strategy, for instance, by focusing on the channels with the most engagement.
Plus, measuring content engagement is a helpful tool for forming the right partnerships. An increasing number of brands are looking into influencer marketing, and the market size could increase by 14% in 2023 compared to 2022.
Content engagement numbers can help you identify the influencers who strongly connect to their audience. It’s also a great way to find magazines, blogs, podcasts, and other partners.
How to Measure Content Engagement?
You can use different digital marketing metrics and tools to track content engagement. Focus on the ones that make the most sense for your organization.
Website Analytics
Website analytics are easy to obtain through tools like Google Analytics. They provide you with unique insights into engagement for your different pages and blog posts. Here are some of the metrics you should track.
Session Metrics
Creating a map of the average session will help you learn more about visitors and what they want to accomplish when they visit your site.
You can measure the average session length. A long session indicates your internal linking structure is ideal for helping visitors discover content. Short sessions aren’t necessarily a negative indicator since users might quickly locate the information they need.
You should also look at the average number of pages viewed per session and perform a flow analysis. Flow analysis reveals the paths users follow. It’s a helpful tool for understanding the tasks users want to perform on your site.
Clicks and Visits
Clicks are a simple tool that helps you identify your most important pages. You should track external clicks as well as internal ones.
Clicks can reveal which landing pages drive traffic to your website and which internal navigation elements get the most attention.
This data can give you a better idea of which topics visitors are interested in, but it can also show which navigation elements are prominent in your design.
Clicks don’t tell the whole story. You should also look at the average time spent on the page to determine if users found what they wanted after clicking a link.
The exit rate for each page can also be interesting to track. The exit rate indicates the percentage of users who ended the session after viewing a specific page. A high exit rate can indicate that a page contains information that fulfills the user’s current goals but can also indicate a frustrating experience.
CTAs and Conversion Rates
Calls to action are a staple of digital marketing. A CTA aims to get users to perform a specific action, like subscribing to your email list, connecting with your brand on social media, or filling out a form to download a white paper.
CTAs directly ask for engagement. These touchpoints are crucial steps in the user’s journey because they typically help you gather contact information or identify prospects with a strong interest in your products or services.
Tracking the conversion rate of your different CTAs is a valuable content engagement metric. You can calculate the conversion rate of a CTA by taking the number of conversions, dividing it by the number of total visits for the page, and multiplying the result by 100.
Form Submissions
Form submissions are a standard format used for CTAs. Brands often use forms to collect a name and email address before giving a user access to gated content.
However, forms are also a helpful way for users to contact brands. Many websites have contact forms where users can ask for help, share feedback, or request a quote for a project.
Tracking the number of form submissions and using flow analysis to determine users' steps before filling out a form can help you identify the content that generates good engagement.
Email Management Software
Besides automating tasks like managing your email lists and sending content series, email management software with built-in analytics capabilities can help you uncover valuable insights into content engagement trends for this channel.
With 74% of marketers citing email as the most effective channel, tracking email engagement can substantially impact the overall performance of your digital marketing efforts.
Email Sign-Ups
Email sign-ups are a form of content engagement. You can use this metric to set goals and assess how well your existing content makes users want to subscribe to receive more.
Flow analysis can reveal which pages, pieces of content, and CTAs lead to the most subscriptions.
Email Open Rate
Your email open rate reflects the percentage of recipients who open your emails. This metric can indicate how many recipients are still actively pursuing their buying journey. A low open rate can indicate that it’s time to refresh your email list.
You can also use your email opening rate to optimize your titles and content. A high email open rate indicates that you’re consistently sharing content that recipients find valuable and they engage with it.
Click-Through Rate
Emails can act as a powerful traffic funnel for your website. A common strategy is to share the first few paragraphs of a blog post and encourage users to click on a link to keep reading.
You can also rely on emails to generate sales by sharing deals and including links to purchase the product.
Your click-through rate indicates how many recipients follow these links after opening your emails. It’s a crucial content engagement metric that reflects how relevant your emails feel and how well they capture recipients’ attention.
Social Media and Video-Sharing Platforms
Social media and video-sharing platforms typically have built-in tools designed to help you track engagement. However, a social media management platform can help you track engagement across multiple sites in one place and access more detailed analytics.
Social media engagement numbers are more than vanity metrics. Here are the ones you should track.
Impressions
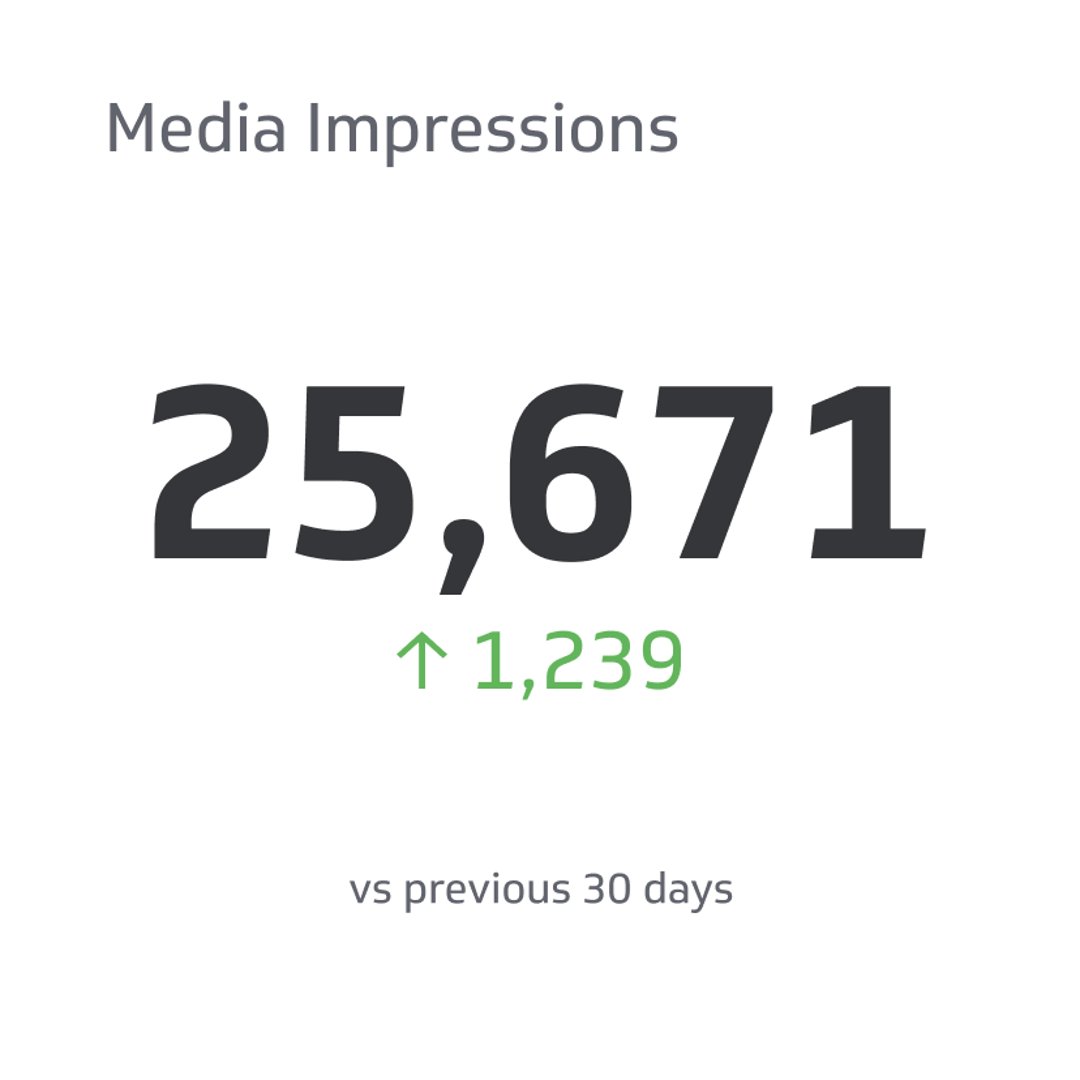
Impressions are the number of users you can reach with a post. Your follower count can help you estimate the number of impressions for your posts, but there are other factors to consider:
- A user who shares your content can increase the number of impressions since their friends will see your post.
- Your content will show up in searches or when users explore hashtags. These searches add to your impression total.
- Search engines are increasingly including content from social media in search results. A trending post in search results can help you get more impressions.
- If you’re promoting your posts or running ad campaigns on social media, you can bid to get more impressions.
Likes and Reactions
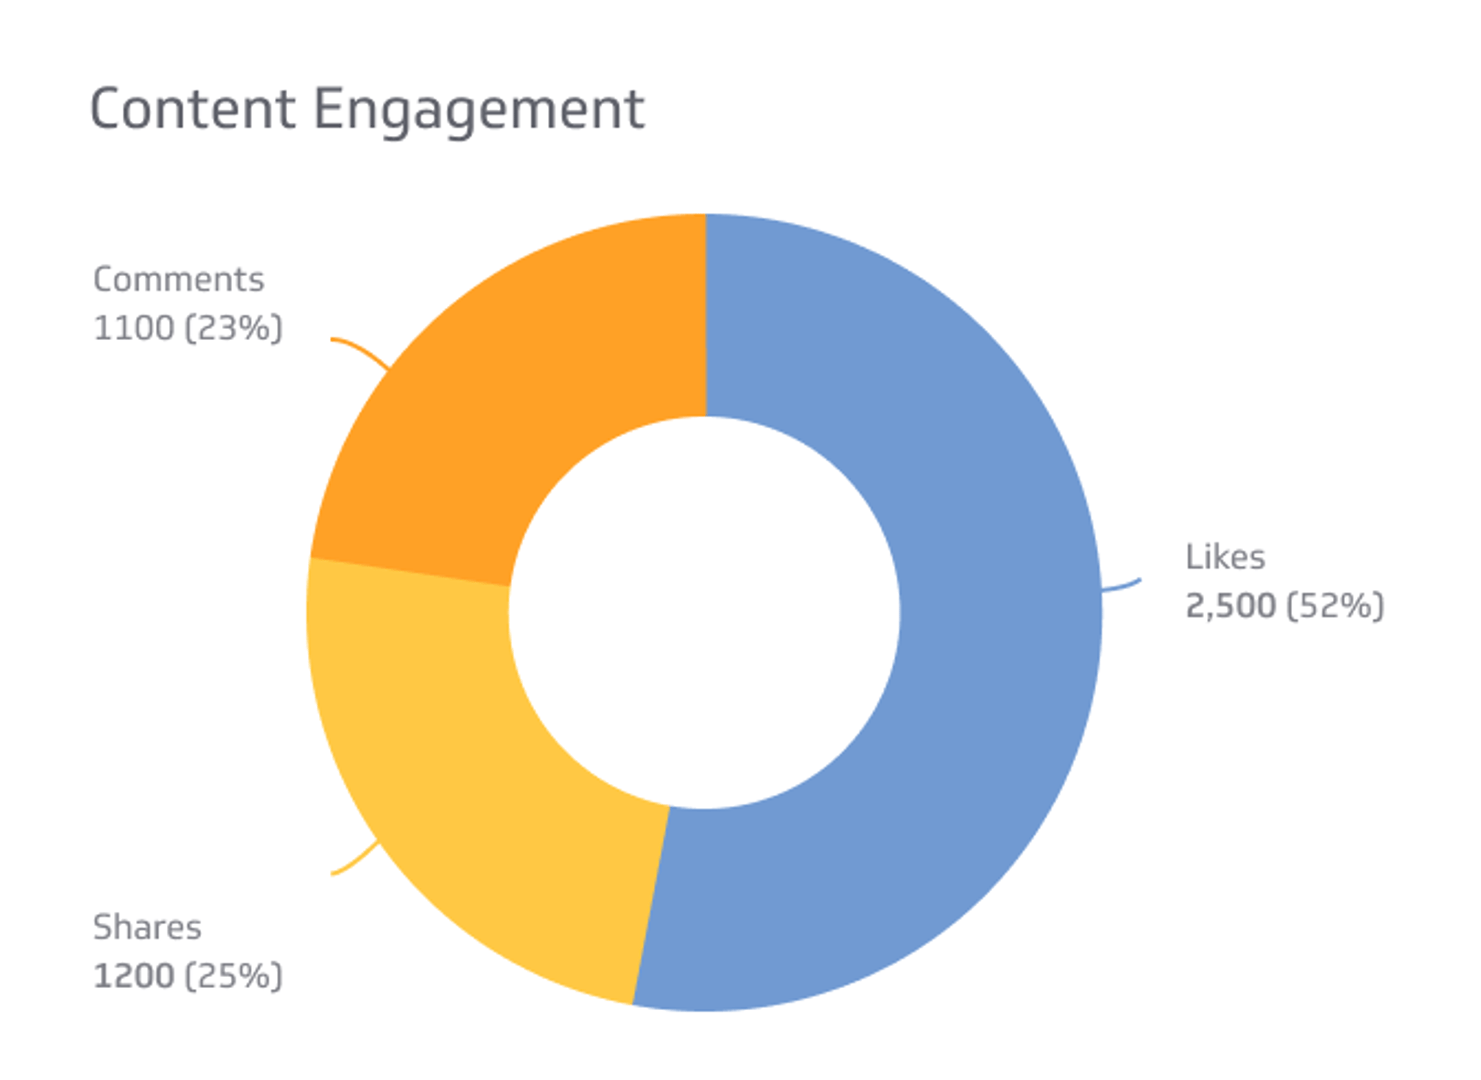
Likes are a simple metric to track. They can give you an idea of the number of users who felt the content was relevant or valuable enough to warrant a reaction.
Facebook is now letting users pick from different reactions. These reactions can help you assess how users feel about your content.
Comments
Comments are a valuable social media metric for two reasons:
- The number of comments a post gets tells you how many users felt a meaningful connection with the content.
- The content of the comments can reveal a lot about your audience, how they feel about your content, and what might be missing from your posts.
Besides tracking the number of comments you get, tracking the nature of comments, for example, how many comments are positive, neutral, and negative in tone, can be helpful.
You should also take the time to read the comments and respond. Comments are an excellent way to connect with your audience and provide users with the information they need to progress on their journey.
Shares
If a user shares a post, it means that the content strongly resonated with them, and they wanted to share this experience with others. Moreover, sharing content can also be a way for users to curate their social media presence by highlighting their connection with your brand.
Shares are one of the most important engagement metrics because they directly increase your number of impressions. Additionally, they help your brand reach an exponential number of users that could be potential buyers in the future.
So, pay attention to the type of content that gets the most shares, and try replicating this formula to increase and strengthen your brand's loyal customer base!
Mentions
You can also track the number of posts that tag your brand or use a brand hashtag. It’s a good way to assess how active the conversation around your brand is or how many users feel a connection deep enough to bring up your brand on social media.
Average Video Watch Time
Track your average video watch time if you have a presence on YouTube or any other social media platforms.
This metric reveals how many users keep scrolling when your videos show up and how many people take the time to watch the content. You can use this information to identify the videos that immediately grab users’ attention and develop more content that uses similar topics or editing techniques.
Wrap Up
If you’re not tracking content engagement, it’s time to make a few changes to your marketing strategy and incorporate tools that will provide detailed insights into how users interact with your site, blogs, emails, and social media posts.
Tracking engagement across channels will provide you with valuable insights you can use to develop content that feels more relevant and engaging. You can also learn a lot about your target audience, uncover the latest trends, and increase your outreach through content users will want to share.
Related Metrics & KPIs

.png)

