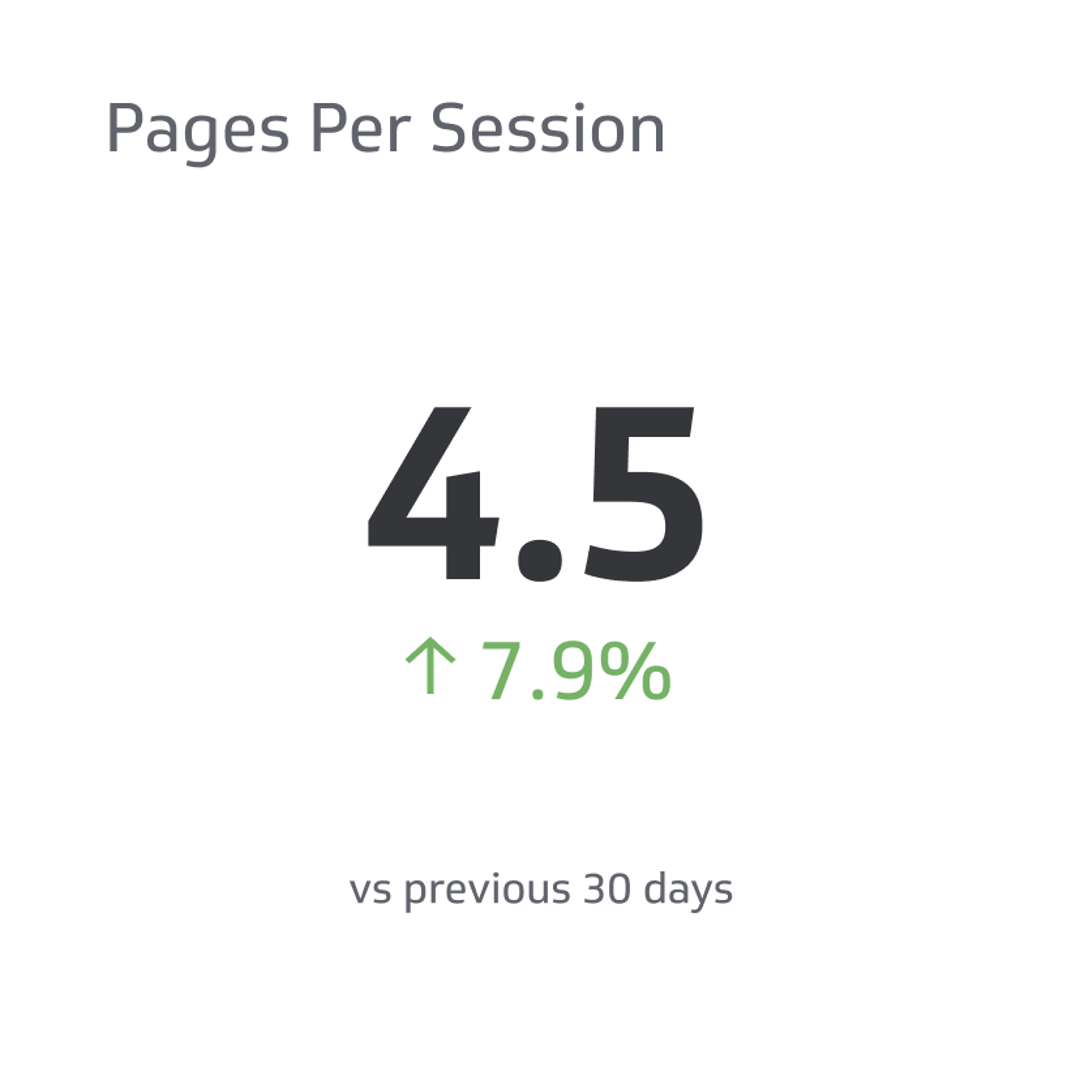
Pages Per Session
Views per session is defined as the number of web pages the user views.
Track all your Digital Marketing KPIs in one place
Sign up for free and start making decisions for your business with confidence.
Google Analytics (GA) or another web metric reporting system provides so much information that you might feel overwhelmed. But of course, all of those details are likely important. But how do you know which statistics to pay the closest attention to?
You’ll find data about your viewer’s average session duration, click-through rate, conversion, and more. And each of these items has value.
But today, we’ll focus on everything you need to know about pages per session. First, let’s look at benchmarks and key performance indicators. So you can turn the data into actionable information that keeps your website thriving.
Pages Per Session Defined
First, Google Analytics defines a session as how long a user or visitor interacts with your app or website.
It then defines views per session as the number of web pages the user views. And it counts repeated views, so if your viewer hits the back button to re-read something, that counts toward your total.
Page views or pages per session tell the broad story of your website visitor experience.
- Shows the average number of pages users view during a visit to your site
- Demonstrates how easy your website is to navigate
- Indicates whether or not visitors find your content interesting or compelling enough to read more.
Simply put, a reader lands on your website, scans the page, likes the content, and clicks to your next page. Hopefully, they will stick around to view more of your content. Pages per session tell how many pages the user viewed during one visit.
Calculating Pages Per Session
Google Analytics does the heavy lifting for you so that you can track your average page views per session in the Audience Overview Report. But if you want to understand the math behind it, here it is.
Calculate your average page view rate with this formula from GA:
Average page views per session = (Page View Events + Screen View Events) / Total Sessions
Say your website had 75,000 page and screen views in one month with 50,000 sessions. Calculate your page views per session like this.
75,000/50,000 = 1.5
On average, every visitor who visited your site viewed 1.5 pages per session during the month (or evaluated period.) Now, users don’t view half the pages. So what? They had one eye closed?
But seriously, this number says your website viewers are showing some interest in your content. They are exploring beyond the page they landed on, which is what you want to see. But how do you know if that number is good enough?
How Many Pages Per Session Is A Good Number?
When determining your benchmark for page views per session, look at industry data. Again, comparing apples to apples helps when at all possible. For example, comparing your lifestyle website to a grocery site might leave you feeling woefully under par.
Last Fall, Littledata examined almost 6,000 websites to determine an average of 2.6 pages per session. So that’s an excellent all-around benchmark to set.
In addition, their data show the top 20% of websites get 4.0 pages per session. And the top 10% get 5.2. So again, these are great goals to set, as the longer someone stays on your website, the higher your chances of meeting sales or marketing goals.
How Many Page Views Per Session Is Bad?
You can see from Littledata’s survey that our example of 1.5 pages per session is lower than average. But is it wrong?
Unfortunately, the lowest 20% of websites receive only 1.7 page views per session. So our example is barely above the worst-performing sites surveyed at 1.4 views.
Average pages per session range from 1.7 to 4.0, so if you fall somewhere in between, you are suitable with most websites. Think of lower rates as an opportunity to improve rather than a complete failure.
Setting Your Pages Per Session Goal
Consistently meeting a realistic goal of around 2 to 2.6 pages per session gets easier over time as your site grows with more pages and (hopefully) compelling content.
Your goal starting may be to nurture your users’ interest and keep them engaged long enough to take the next step. Following your user’s click trail from the Behavior User Flow reports fills in the story of what captures their attention most.
Knowing what interests your users helps you set a realistic page-per-session goal.
Best Practices For Pages Per Session
Remember that pages per session are one of many digital marketing metrics examining your website’s ability to meet your goals. So whether your goal is to get more readers or convert those readers into customers, here are some best practices for raising your page views per session.
Optimize Your Viewer’s Experience
Each webpage needs a user-friendly interface with compelling copy. And in addition, adding internal links and Calls To Action (CTAs) keep your visitor engaged with your content. Here are a few more ways to optimize your pages for more session views.
- Provide accessible site and page navigation.
- Create high-quality, relevant material that is informative and engaging.
- Implement effective on-page SEO techniques, like optimizing meta tags and using relevant keywords.
- Ensure you have fast page load times.
These items improve your website’s visibility in search engine results so you attract more of your target traffic. Utilizing social media and other online platforms to promote your website also drives more session views. And more sessions equate to more opportunities to increase page views.
Internal Links & CTAs Increase Pages Per Session
Internal links and CTAs can provide more page views per session by directing users to related content that might interest them. You know your content, but users don’t. So you have to show them what else you’ve got.
Calls to Action, such as “learn more” or “you won’t believe what’s next,” are great ways to keep a user on your site longer. Their engagement helps reduce your bounce rates and increase session duration. All of which are essential metrics for measuring your website’s success.
Overall, internal links and CTAs are crucial in increasing pages per session views. They guide users to related content and improve their experience on your site.
Track Other Metrics, Too
Don’t put too much stock in only one of many analytical metrics. Optimizing pages to keep users engaged raises other data points that need your attention.
Pages per session are one item of importance, to be sure. But don’t make the mistake of focusing all your attention there. For example, you may aim to gain repeat visits to convert readers to buyers. Yes, you want them to follow your CTAs to make the purchase. But you also want them to come back for future products too.
Pay attention to your overall analytical trends for a full measure of your site’s success. Consider your bounce rate and average session time for the big picture. First, you need readers to come. Then you can engage them with your content so they stick around and visit more pages.
For example, websites with high page views per session, a high bounce rate, and a low session duration might show users searching but needing help finding specific information. You don’t want them jumping around, then leaving frustrated, which can happen with low-quality content.
So look at pages per session data and key metrics to judge your success. Your specific goals determine which data points are most important.
Celebrate Your Success
Longer average time on page combined with higher pages per session tells you your website interests users. They like what they see, so they click to learn more. And that raises your conversion rate of users to buyers (or callers, appointments made, email signups, etc.)
Most of the time, higher page views per session indicate your hard work is paying off. Your site is easy to navigate with compelling content. So take time to celebrate even small achievements. It keeps you motivated to provide your best site.
Why Do Pages Per Session Dip In Google Analytics?
You’ve optimized content, added internal links, and followed the best practices. But what happens when you suddenly see a drop in pages per session?
Page views dip for a variety of reasons.
- Users may find the information they need on the first page they visit, so they don’t need to look further.
- You may need help with page loading or navigation.
- Decreases in user engagement with your content
- A shift in the source of website traffic to lower-quality sources
Some things to consider are recent changes in your website design or content. Are the changes not sitting well with your intended audience?
Analyze user behavior and website metrics to help identify the underlying cause for the dip in pages per session. Drops in page views aren’t necessarily bad, which is why it is critical to track other metrics too.
How To Track Google Analytics Pages Per Session
Here’s a step-by-step guide to tracking page views per session in Google Analytics.
- Sign into your GA account and select the website or app in question.
- Click on Audience, then Behavior in the left-hand menu, and finally, select Overview.
- Look for the Page Views column and note the average pages per session. You’ll also see Unique Page Views here.
Detailed Views Of Top Pages
For a detailed view of your top performers, click Behavior on the left-hand side. Then Site Content and All Content for a list of all your Pageviews, sorted by their amount in descending order.
Switch the view to ascending to also see your lowest performers.
- Note your highest and lowest viewed pages to gain potential optimization insight.
- Sort by Average Time on Page to see where your users spend the most time on your website.
Pageviews and Average Time on Page help you understand your audience’s behavior. That information steers your marketing strategy. But it also helps you give users the quality and type of content they want from you.
Remember that you designed some pages to need less time, such as a thank you page after someone joins your email list. So perusing multiple GA data points is vital to overview your audience’s behavior. And it’s important to consider page factors like content and user experience relevance.
Digging A Little Deeper Into GA Pages Per Session Reports
When digging deeper into the GA data, create a custom report. This information comes in handy when you want to see data regularly.
- Click Customization in the left-hand menu, select Custom Reports, then New Reports.
- Give your report a name to easily access it later.
- Select a report type.
- Under the Metric Group section, choose Pages/Sessions as your metric.
- Under the Dimension Drilldowns, select Page as your dimension.
- Click Save to create your custom report.
- Click the report to open, share, and view the data.
What’s the Difference Between Page Views and Unique Page Views?
Google Analytics says that unique pageviews in the Content Overview report compile views generated during the same session from the same user. So each unique pageview shows the session numbers when a user viewed that page one or more times.
The difference is that the unique metric counts the times visitors visit a page within their session. And page views count the overall total of times the page was viewed (including same-user repeat visits.)
So Which is Better: Unique Page Views or Page Views?
Each answer fits only some since it depends on your website goals. But unique page views are generally more critical.
That’s because if you have only a tiny amount of returning unique page views with a high number of total page views, your new visitors aren’t returning. And you need them to return, especially if you’re an online shop.
Return customers are precious since they already know your product. You don’t have to market as much to them as you would to a new visitor. And they’ll probably spend a little more than a first-time customer. So for these reasons (and more), unique page views prove very beneficial.
Pages Per Session: Everything You Need To Know Wrapup
It’s easy to let the Google Analytics dashboard make your head spin. You find so much information that it’s hard to keep it straight. But knowing which metrics make the most significant difference helps you know where to spend your time and energy.
Pages per session tell you the average number of site pages a user visits during one session. And more is usually better since it means users find your content compelling enough to explore your website.
Aim for 1.7 to 4.0 pages per session as a realistic benchmark of your website’s success in creating a meaningful user experience. But don’t forget to consider other GA metrics.
Looking at your overall audience behavior statistics helps you focus on improving site navigation while optimizing specific pages. Your time is valuable, so staying focused on Calls to Action and internal link optimization increases the likelihood of unique pageviews and returning customers.
Related Metrics & KPIs