Sales Leaderboard
Track performance, motivate your team, and crush your targets.
What is a sales leaderboard?
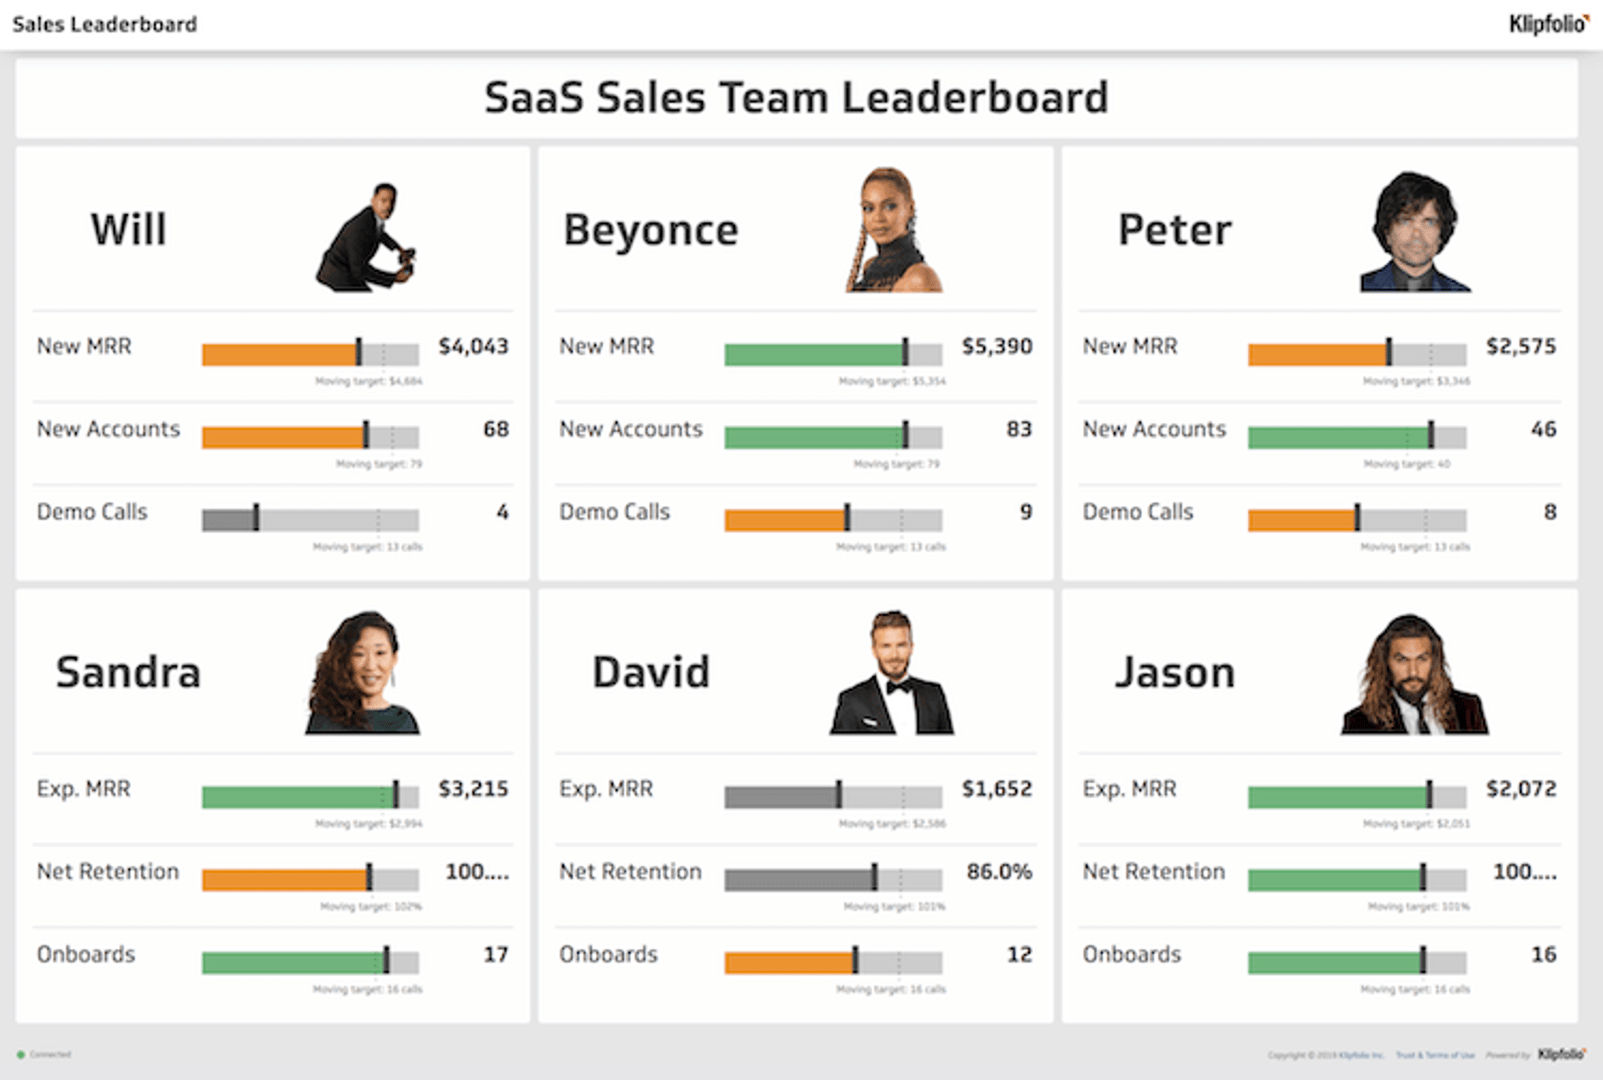
A sales leaderboard is a real-time visualization that displays your sales team's individual and collective performance side-by-side, so everyone knows where they stand.
Instead of digging through reports, a leaderboard surfaces results at a glance. You can monitor performance daily, weekly, or monthly, keeping the whole team aligned on the goals that matter most.
Displaying a sales leaderboard on a TV dashboard in your office fosters a transparent, data-driven culture. It motivates your team, sparks friendly competition, and lets everyone celebrate wins as they happen.
Why your team needs a sales leaderboard
A sales leaderboard does more than track numbers. It builds momentum and creates a culture of open communication. Here are the key benefits:
Boost motivation through competition. When team members can see their performance in real time, healthy competition drives them to hit their targets.
Improve individual and team performance. Leaderboards provide immediate feedback, helping reps understand where they stand without waiting for a weekly meeting. Quick adjustments become the norm.
Increase visibility and transparency. Make sales data accessible across the company. The sales team stays accountable, and other departments gain visibility into how the business is growing.
Make faster, data-driven decisions. A live leaderboard helps sales leaders spot trends, identify top performers, and offer coaching where it's needed most, well before end-of-quarter reports arrive.
How to build a powerful sales leaderboard
Creating a sales leaderboard is simpler than you might expect. The key is connecting your data sources for an automated, always-on view of performance, no manual spreadsheet updates required.
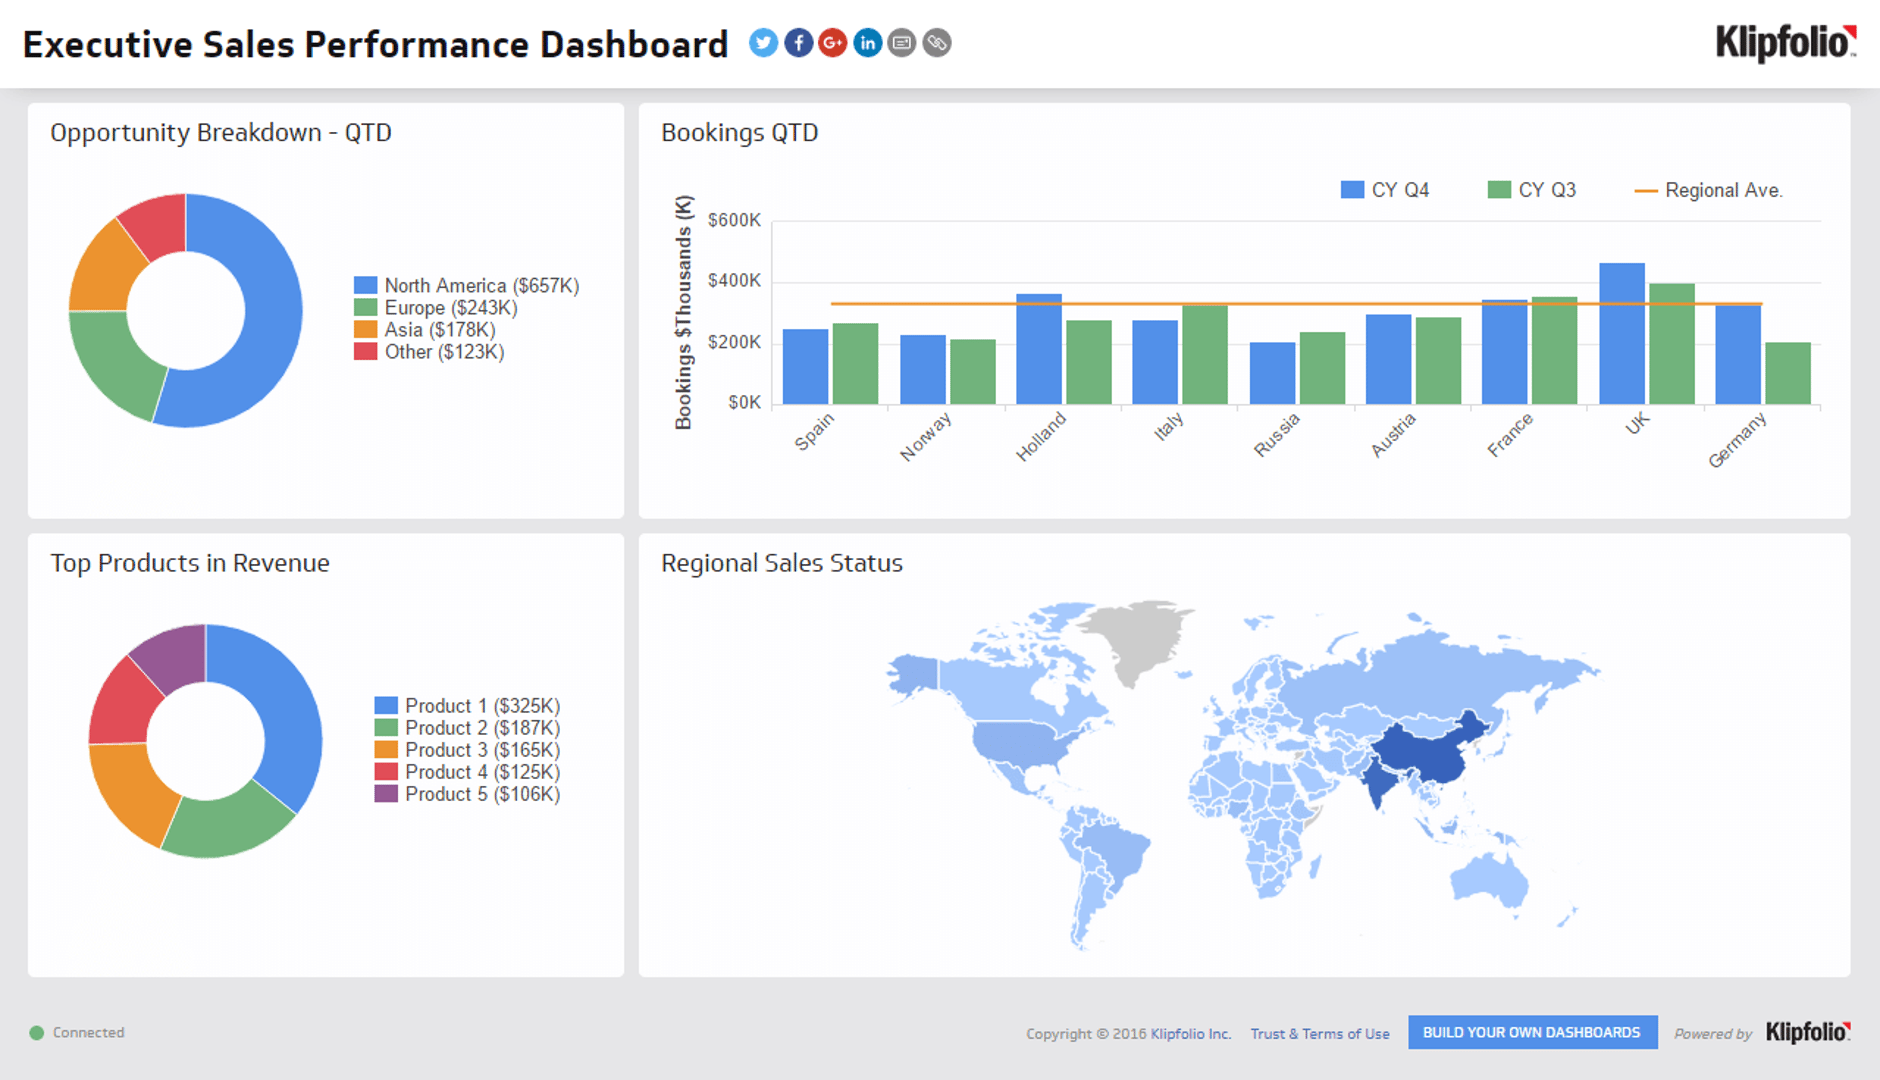
Define your key sales metrics. Decide what to measure first. Are you focused on new deals, call volume, or revenue? Choose the KPIs that directly align with your company's goals.
Connect your data automatically. Link directly to your CRM, like Salesforce, and any other relevant data sources. A dedicated dashboard tool pulls the latest data on a schedule, so your leaderboard is always current.
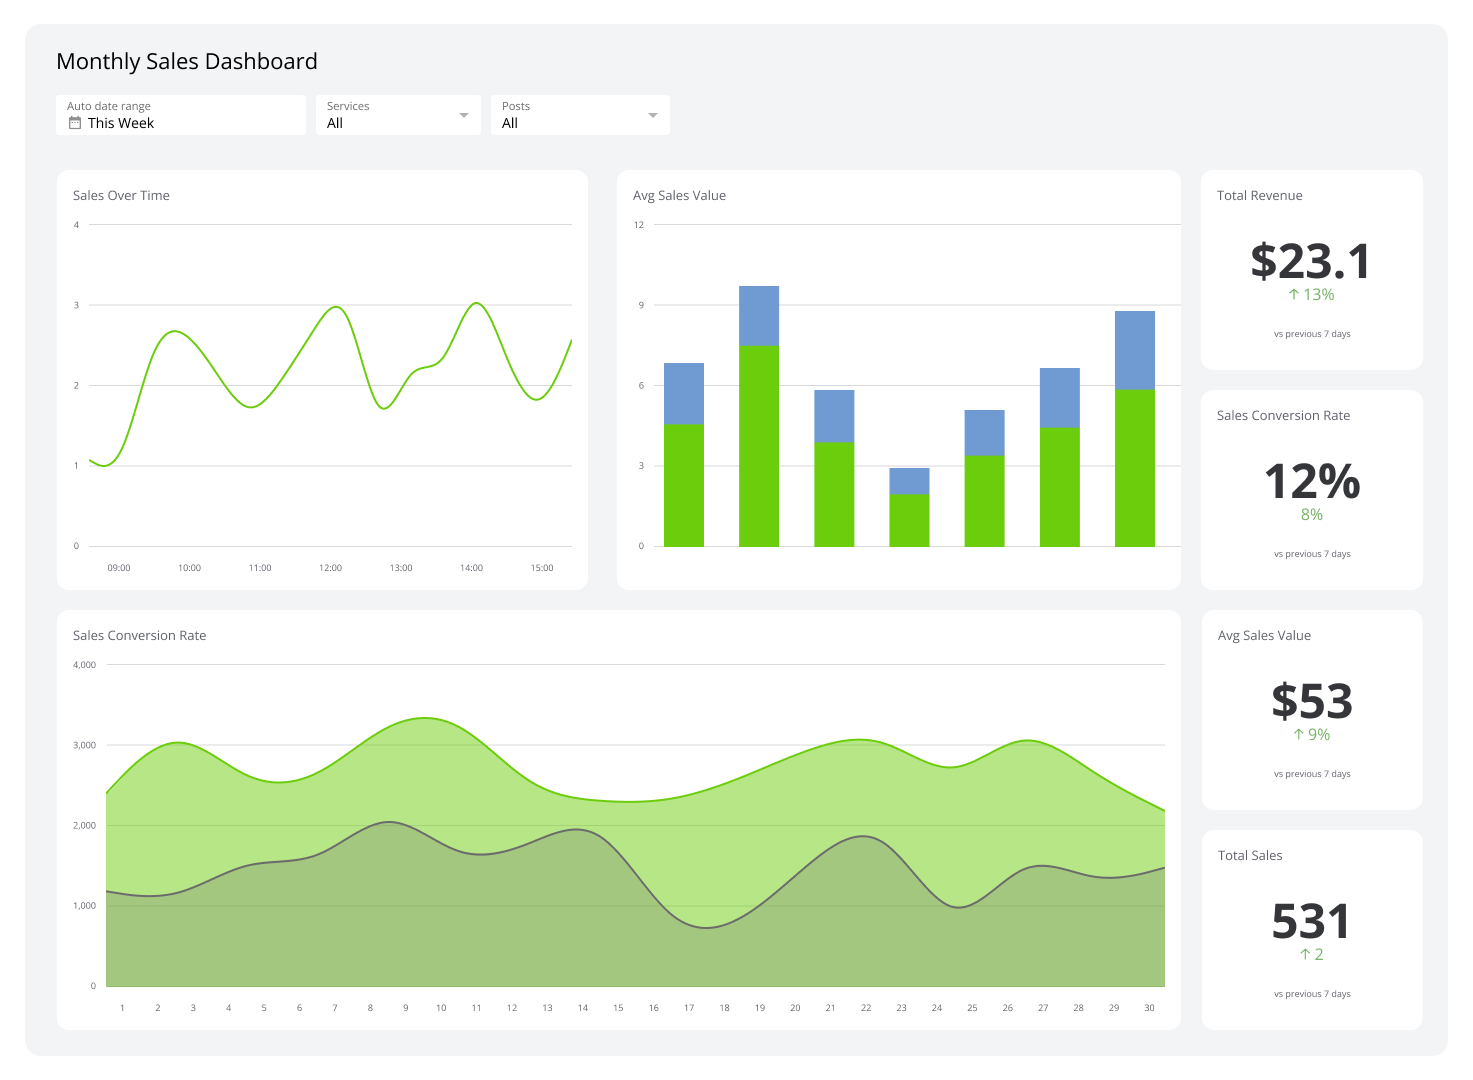
Visualize your data for clarity. Choose visualizations that match each metric. Gauges work well for tracking progress against a target; bar charts are ideal for comparing performance across the team.
Share it everywhere. Display your leaderboard on a TV monitor in the office, share it via a public link, or schedule regular email reports. The more visible it is, the more impact it has.
Key metrics for your sales leaderboard
To build an effective sales dashboard, you need to track the right metrics for your business stage. A startup might focus on acquiring new logos, while a more established company may prioritize expansion revenue.
Here are the most common and impactful metrics for a sales leaderboard:
New MRR: Monthly Recurring Revenue from new deals. This is the lifeblood of any SaaS or subscription-based business.
New customers: The total count of new clients. A strong metric for tracking market penetration and growth.
New logos: The number of new companies acquired. Crucial for B2B businesses focused on expanding their customer base.
Demo calls: The number of product demonstrations completed by the sales team. A key top-of-funnel indicator of future sales activity.
Expansion MRR: New monthly revenue generated from existing customers through upsells or cross-sells. Vital for sustainable, long-term growth.
Retention rate: The percentage of customers your team successfully keeps over a given period. High retention signals a healthy business and a satisfied customer base.
Onboarding calls: Post-sale calls completed by the sales or customer success team to ensure new customers get started successfully.
A sales leaderboard transforms raw data into a clear, motivating picture of your team's progress. Track the right KPIs with a KPI dashboard, make them visible, and you build a transparent culture where everyone is empowered to perform at their best. Klipfolio Klips makes it straightforward to connect your data and build a leaderboard that drives real results, with no manual updates and no stale reports.
At a glance
Focus Area
Sales performance tracking and team motivation
Metrics List
New MRR, New Customers, New Logos, Demo Calls, Expansion MRR, Retention Rate, Onboarding Calls
Reference Rate
Daily, weekly, or monthly refresh depending on team cadence
Watch: Sales Leaderboard Overview
Related Dashboards
View all dashboards