Sales Pipeline Dashboard
Visualize your sales process, from lead to close.

What is a Sales Pipeline Dashboard?
A sales pipeline dashboard gives you a real-time, visual command centre for your entire sales process. It provides a clear view of team performance, helping you refine your sales strategy and drive consistent company growth. By transforming complex sales data into actionable insights, a dashboard lets managers make faster, more informed decisions, pinpoint high-value opportunities, and align the entire team.
Examples of sales pipeline dashboards
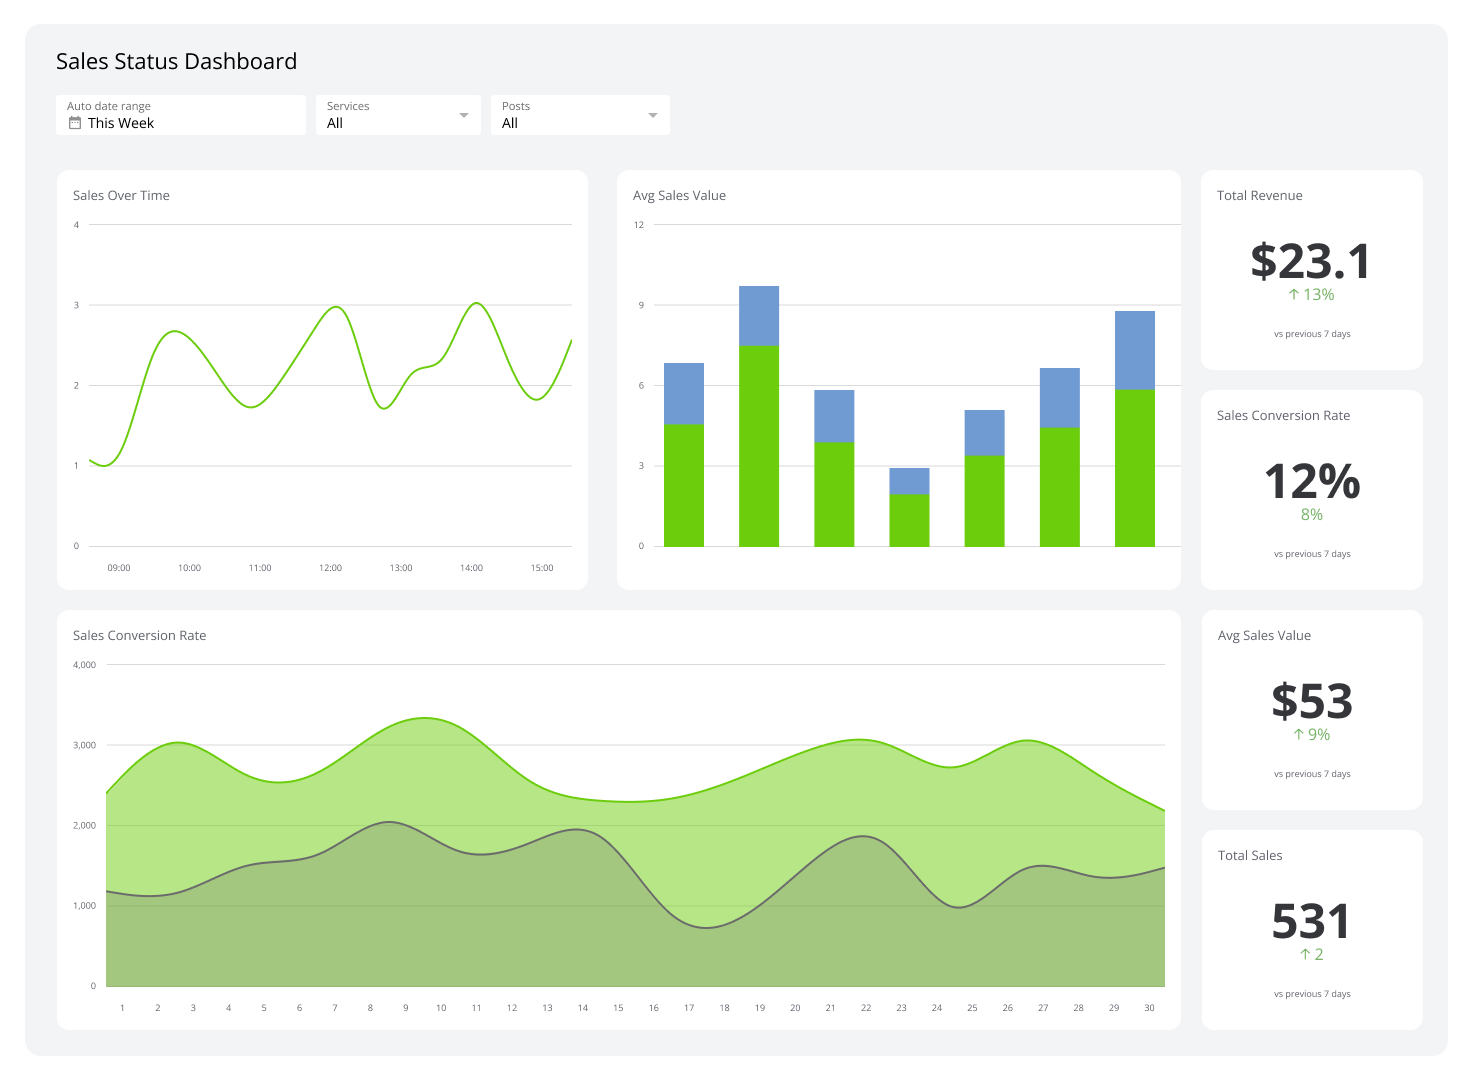
Sales analysis dashboard
A sales analysis dashboard is the mission control for your sales operations, pulling in data in real time. It distills complex processes into clear metrics that decision-makers can use to identify and act on emerging trends. The broad scope of a sales analysis dashboard enables proactive management, making it a powerful tool for accelerating revenue.
| Who it's for | Sales managers, C-level executives, sales team leaders, sales representatives, sales analysis teams |
|---|---|
| How often it's needed | Daily, weekly, monthly |
| Covered KPIs | Total pipeline value, number of deals in each stage, win rate, average deal size, sales cycle length, conversion rates between stages, revenue forecasts, sales velocity, deal age, activity metrics |
Quarterly forecast dashboard
A quarterly forecast dashboard offers a panoramic view of your sales landscape, highlighting potential areas for growth and the current status of your pipeline. This tool facilitates systematic sales projections by comparing best-case forecasts with historical outcomes, leading to more accurate and reliable planning.
| Who it's for | Sales executives, C-level executives, sales managers and directors, financial planning and analysis teams, board members and investors |
|---|---|
| How often it's needed | Monthly, quarterly, yearly |
| Covered KPIs | Quarterly revenue forecast, pipeline coverage ratio, weighted pipeline value, win rate by sales stage, average deal size, sales cycle length, forecast accuracy, quota attainment, yearly growth rate, customer segment distribution, seasonality trends, best-case scenario forecasts, worst-case scenario forecasts, new business vs. upsell/cross-sell forecasts |
Sales growth dashboard
The sales growth dashboard provides a fast and effective way to analyze sales data across different segments of your business. It helps managers spot trends, set realistic goals, and support their teams. By visualizing deal progress, it allows for timely strategy adjustments to boost revenue, improve customer focus, and make planning more precise.
| Who it's for | Sales managers and directors, C-level executives, marketing managers, sales team leaders, business development executives, product managers |
|---|---|
| How often it's needed | Weekly, monthly, quarterly, yearly |
| Covered KPIs | Sales-to-date, month-over-month (MoM) sales growth rate, revenue per sales rep, customer acquisition cost (CAC), customer lifetime value (CLV), new customer growth rate, existing customer growth rate, average deal size growth, win rate trends, market penetration rate, sales qualified leads (SQL) growth, revenue per customer, churn rate, return on sales (ROS) |
Sales cockpit dashboard
A sales cockpit dashboard streamlines your sales team's workflow by centralizing critical information. This tool eliminates the need for reps to jump between multiple platforms, boosting productivity. Integrating it with your customer relationship management (CRM) software provides an in-depth view of sales targets, customer interactions, and progress toward revenue goals.
| Who it's for | Individual sales representatives, account executives, sales team leaders, sales managers, inside sales teams, field sales representatives, sales operation specialists |
|---|---|
| How often it's needed | Daily or weekly |
| Covered KPIs | Sales quota attainment, team quota attainment, pipeline value and health, win rate, number of won opportunities, customer engagement scores, product mix in pipeline, forecasted revenue, deals at risk, sales velocity, time spent on various sales activities, customer satisfaction score (CSAT) |
Sales performance dashboard
A sales performance dashboard unifies customer data and sales activities in one accessible location. It allows sales reps to quickly find the information they need about potential buyers and what motivates them to purchase. Ultimately, this dashboard helps you focus on the most promising leads, make smarter decisions, and close deals faster.
| Who it's for | Sales representatives, executive leadership, sales managers |
|---|---|
| How often it's needed | Daily, weekly, monthly, quarterly |
| Covered KPIs | Lead conversion rate, sales growth, average deal size, sales cycle length, CAC, CLV, win rate, sales by product/service, sales by region, quota attainment |
Sales summary dashboard
A sales summary dashboard simplifies sales tracking for your company's leadership. It shows current sales progress, compares it to goals and past results, and breaks down performance by product or region. This tool gives leaders a clear, high-level overview of their efforts, helping them make better strategic decisions.
| Who it's for | Company executives, financial analysts, sales managers |
|---|---|
| How often it's needed | Daily, weekly, monthly, quarterly |
| Covered KPIs | Total sales volume, sales vs. targets, year-over-year (YoY) growth, sales by product, sales by region, sales growth rate, average revenue per user (ARPU), customer churn rate, top-performing sales reps, ROS |
360-degree-view dashboard
A 360-degree-view dashboard provides your sales representatives with a complete summary of their accounts, streamlining client relationship management. This dashboard consolidates relevant KPIs across every critical aspect of the sales process, giving your team a comprehensive picture of each client's history, status, and potential.
| Who it's for | Sales representatives, account managers, customer success teams |
|---|---|
| How often it's needed | Daily, weekly, monthly, quarterly |
| Covered KPIs | Account status, revenue from account, next follow-up date, CSAT, last interaction date, product usage, client organizational structure, issues logged, potential for upsell/cross-sell, CLV |
Sales territory dashboard
A sales territory dashboard provides a clear view of performance across different regions, helping you increase sales without additional spending. Data-driven insights help you allocate resources more effectively, strengthen market presence, and drive overall sales performance.
| Who it's for | Sales managers, sales executives, sales representatives |
|---|---|
| How often it's needed | Quarterly and yearly |
| Covered KPIs | Sales volume by territory, territory revenue growth, customer density, territory coverage, market potential, sales per rep, customer acquisition rate, account load per rep, territory profitability |
Sales KPI dashboard
A sales KPI dashboard offers a real-time summary of your most critical sales metrics, like sales cycle length and customer churn rate. This focused view makes it easier to identify trends, spot performance issues, and make effective strategy adjustments and resource allocations.
| Who it's for | Sales managers, account managers, sales analysts, sales executives |
|---|---|
| How often it's needed | Daily, weekly, monthly, quarterly |
| Covered KPIs | Total sales, sales growth, sales target achievement, conversion rate, average deal size, sales cycle length, lead response time, CAC, customer churn rate, forecast accuracy |
Account manager dashboard
An account manager dashboard brings together essential data points, enabling your account managers to nurture existing clients and identify potential upsell avenues. This tool helps strengthen customer relationships and drives revenue expansion across your entire business.
| Who it's for | Account managers, sales managers, sales executives, customer success managers |
|---|---|
| How often it's needed | Daily, weekly, monthly, quarterly |
| Covered KPIs | Account health score, monthly recurring revenue (MRR) per account, CLV, up-sell and cross-sell opportunities, CSAT, net promoter score (NPS), engagement level, response time, renewal rate |
Executive sales dashboard
An executive sales dashboard gathers the most critical aspects of the sales pipeline and presents them in a single, authoritative interface. Real-time visibility into vital sales indicators and trends lets you identify areas that need attention, distribute resources effectively, and make growth-focused decisions.
| Who it's for | Chief sales officers, vice presidents of sales, sales directors, C-level executives |
|---|---|
| How often it's needed | Daily, weekly, monthly, quarterly |
| Covered KPIs | Total sales revenue, sales growth rate, win rate, average deal size, lead conversion rate, sales cycle length, quota attainment, sales by region/product, CAC, customer retention rate, forecast accuracy |
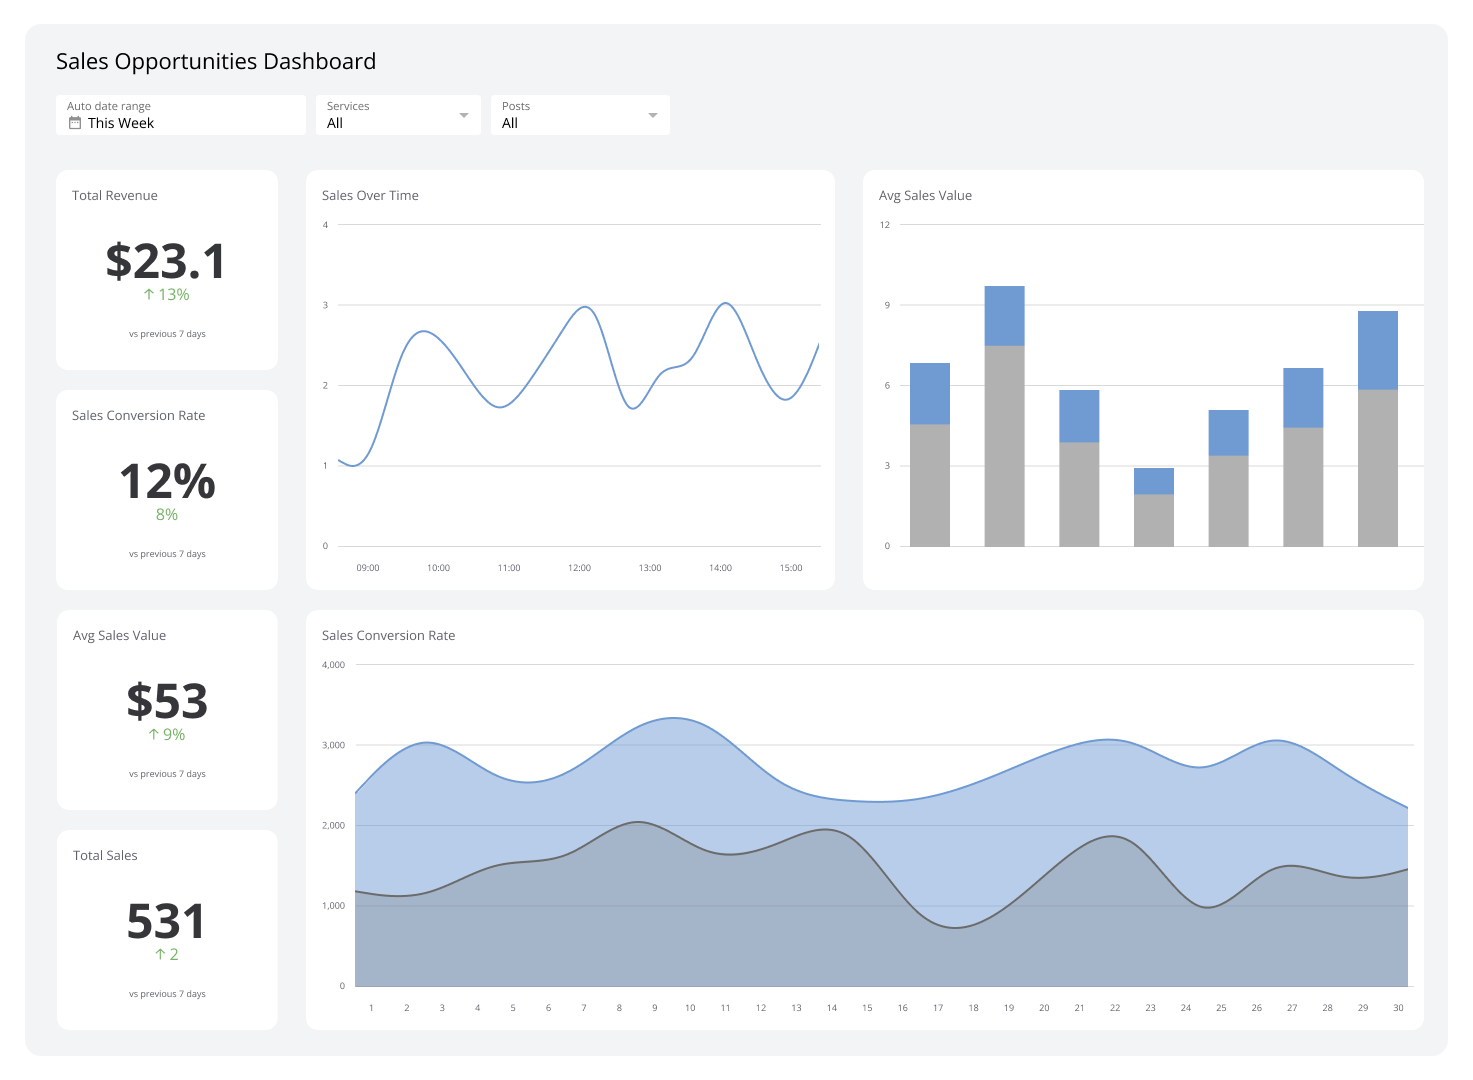
Sales opportunity dashboard
A sales opportunity dashboard spotlights promising leads, giving you the data needed to focus your sales efforts where they matter most. With it, your sales teams can navigate their pipeline with precision, anticipate challenges, and identify the most valuable routes for expansion.
| Who it's for | Sales managers, sales representatives, business development managers, sales operation teams |
|---|---|
| How often it's needed | Daily, weekly, monthly, quarterly |
| Covered KPIs | Number of opportunities, opportunity stage distribution, estimated sales value, conversion rate, average sale price, opportunity win rate, sales cycle length, age of opportunities, lead source analysis, sales rep performance, forecasted revenue, missed sales opportunity |
Sales engagement dashboard
A sales engagement dashboard provides a clear picture of how your team interacts with prospects and customers, spotlighting the effectiveness of your sales strategies. Using its data, you can refine your process, coach your team more effectively, and drive sustainable revenue growth.
| Who it's for | Sales managers, sales executives, sales directors, sales operation leaders |
|---|---|
| How often it's needed | Daily, weekly, monthly |
| Covered KPIs | Outreach activity volume, engagement levels, response rates, pipeline progression rates, conversion rates at each stage, average deal size, sales cycle length, win rates |
Sales activities dashboard
A sales activities dashboard displays key performance metrics, like call volume and email response rates, that provide valuable insight into your team's efforts. This information lets you recognize top performers, identify areas for improvement, and fine-tune your sales approach for maximum impact.
| Who it's for | Individual sales representatives, sales team leaders, sales operations managers, sales managers, C-level executives |
|---|---|
| How often it's needed | Daily, weekly, monthly |
| Covered KPIs | Call volume, longest call length, email outreach volume, response rates, conversion rates, sales pipeline progression, number of meetings scheduled, time spent on various sales activities |
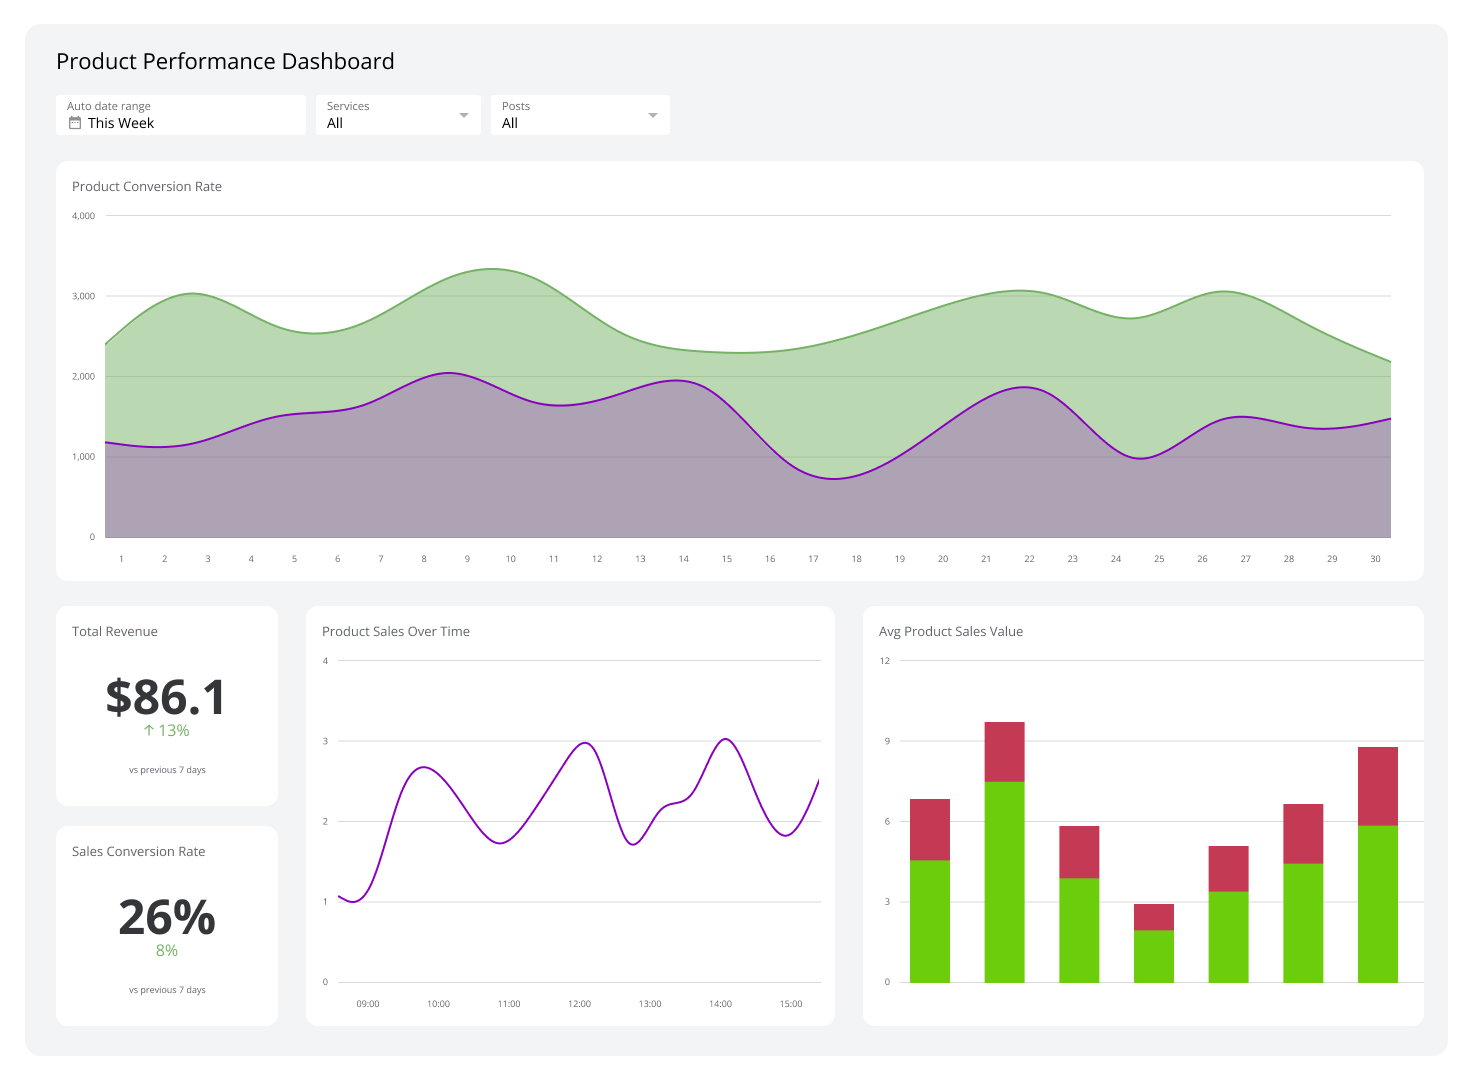
Deal performance dashboard
A deal performance dashboard offers a comprehensive view of your sales pipeline, giving you a decisive edge in managing your sales process. This tool lets you focus on top opportunities, accurately predict revenue, and make decisions that directly boost performance.
| Who it's for | Account managers, sales operations teams, business development specialists, sales managers, C-level executives |
|---|---|
| How often it's needed | Daily, weekly, monthly, quarterly |
| Covered KPIs | Win rate, average deal size, sales cycle length, pipeline velocity, conversion rates by stage, expected closure dates, deal probability, top-performing products/services |
Build your sales pipeline dashboard with Klipfolio
With Klipfolio Klips, you can build a sales pipeline dashboard that unifies your data and gives your team the real-time insights they need to close more deals. Connect your CRM, spreadsheets, and other data sources in one place, get everyone on the same page, and start making data-driven decisions that accelerate growth.
Try Klips free — no credit card required.
At a glance
Focus Area
Sales pipeline management, sales performance tracking, revenue forecasting, and team productivity.
Metrics List
Win rate, sales cycle length, quota attainment, pipeline velocity, conversion rate, average deal size, CAC, CLV, forecast accuracy, MRR.
Reference Rate
Daily to quarterly, depending on dashboard type and audience.
Related Dashboards
View all dashboards