
Sales Growth metric and KPIs
Sales Growth measures your sales team's ability to increase revenue over a fixed period, making it a core indicator for business strategy and forecasting.
Sales Growth
What is Sales Growth?
Sales Growth measures your sales team's ability to increase revenue over a fixed period of time. Without revenue growth, businesses risk stagnation and losing ground to competitors.
Sales Growth is a strategic indicator used by executives and boards to shape business strategy. It connects directly to profitability, which is why it draws attention from every level of the organization: executives, directors, frontline reps, and shareholders alike.
Key indicators
Positive Sales Growth percentage: Revenue increased compared to the prior period.
Negative Sales Growth percentage: Revenue declined compared to the prior period.
Key terms
Current sales revenue: The total dollar value of sales during the current period.
Previous period sales revenue: The total dollar value of sales during the comparison period.
Why is the Sales Growth metric important?
Few metrics carry the weight of Sales Growth. It tells you, at a glance, whether the business is moving forward or falling behind. That clarity matters more than any report you could pull manually or any number you could paste into a chatbot and ask to interpret.
What makes Sales Growth especially useful is that it creates a cascade. A single growth target at the top of the organization translates into focused, trackable activities at every level below it. Executives own the revenue number. Directors own regional performance. Managers own cycle efficiency. Reps own their individual quotas. Everyone knows where they stand and what they're accountable for.
Here is an example of how Sales Growth cascades into role-specific metrics:
| Role | Metric |
|---|---|
| Executive | Revenue Growth by Quarter |
| Director | Sales by Region |
| Managers | Sales Revenue Per Hour; Missed Sales Opportunities; Sales Cycle Duration |
| Reps | Conversation to Appointment; Sales Quota Attainment |
When those metrics are visible and consistent, you spend less time chasing numbers and more time acting on them.
Using the Sales Growth metric to lead your team
Sales Growth gives your organization a shared direction, but it is too high-level to guide daily decisions for frontline reps and account managers. The cascade of metrics in the table above bridges that gap: each role gets a number that is directly within their control and directly connected to the overall target.
The key is making those metrics visible to everyone, not buried in a spreadsheet or locked inside a tool that only one person can access. When your team can see performance in real time, without having to ask someone to pull a report or figure it out themselves, accountability becomes automatic. You stop explaining your business from scratch every time a question comes up, because the answer is already there.
Whether you start with Google Sheets, a Salesforce Dashboard, or a dedicated dashboard tool, the goal is the same: one version of the truth, accessible to everyone who needs it.
Create custom dashboards for you and your team.
Get started with KlipsExample of a sales growth dashboard
Here is an example of a sales dashboard built around Sales Growth as the central metric. It tracks sales KPIs on a monthly basis and uses targets to show how each team member contributes to the overall business goal.
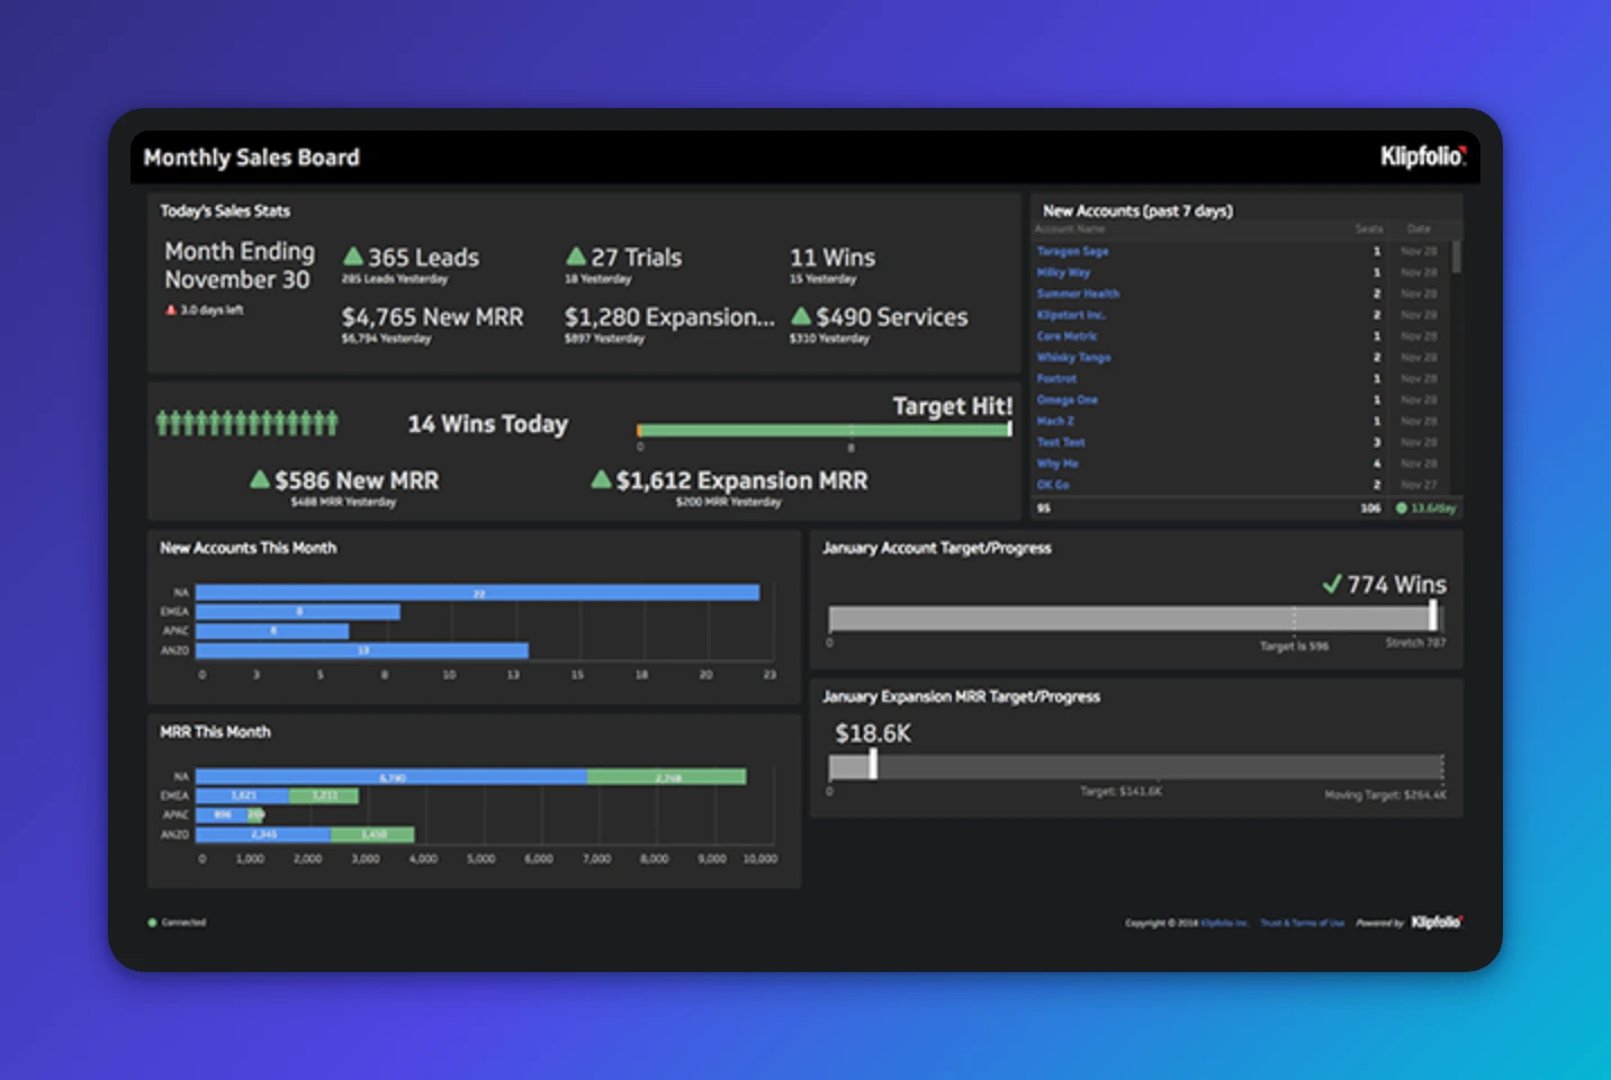
The value of a dashboard like this is not the chart itself. It is the confidence that comes from knowing the number is right, knowing it is current, and not having to wait for someone to send it to you. A small team with that kind of clarity operates like a much larger one.





