Sales Orders Filled per Unit Time Metric
Measure how many sales orders your team completes within a specific timeframe.
Track all your Sales KPIs in one place
Sign up for free and start making decisions for your business with confidence.
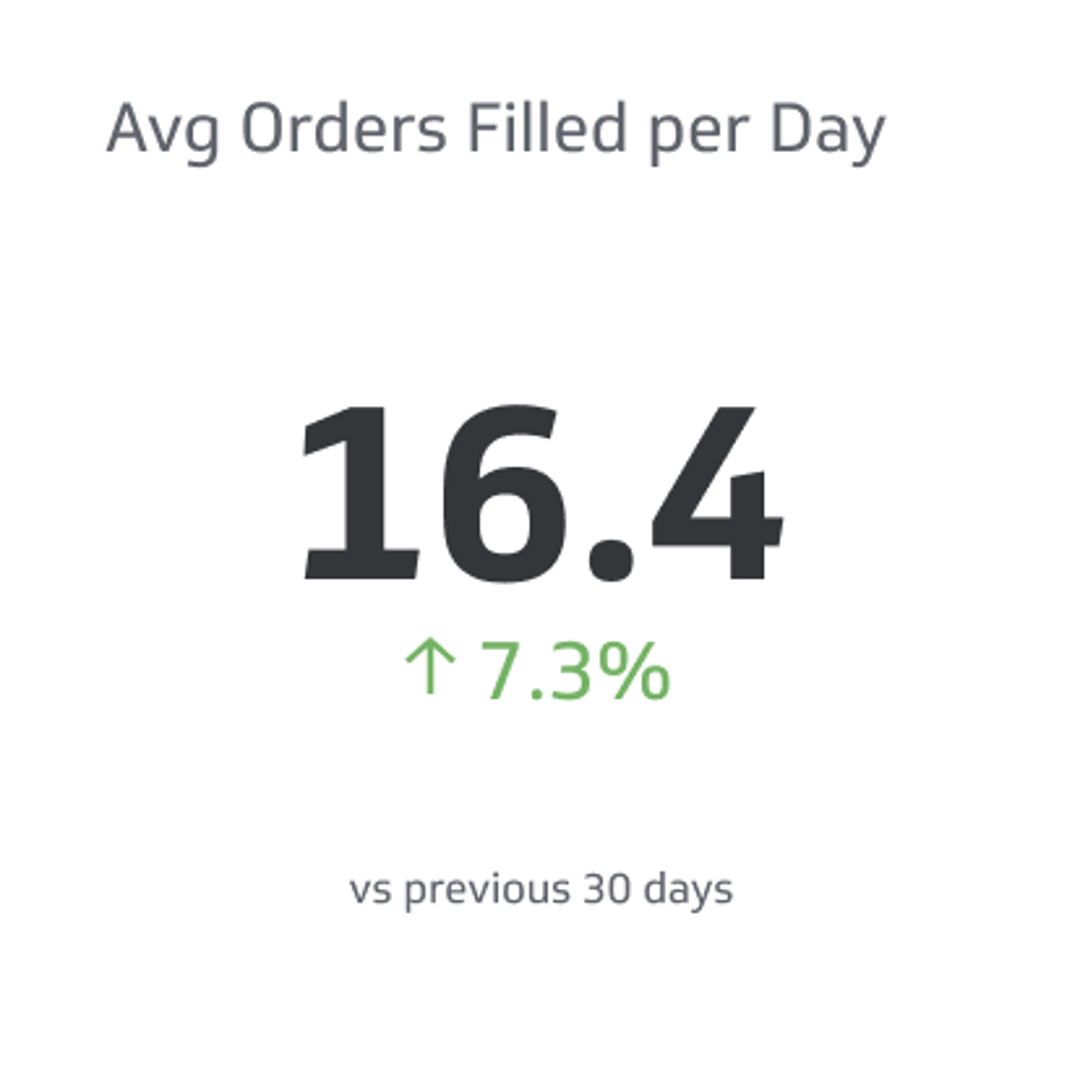
Sales orders filled per unit time measures how many sales orders your team completes within a specific timeframe—typically per day, week, or month. This KPI reveals both efficiency and capacity, showing whether your order fulfillment process is keeping pace with demand.
For growing companies, tracking this metric helps identify bottlenecks in fulfillment, set realistic team targets, and celebrate wins when throughput improves. It's especially valuable for businesses with high order volumes or seasonal spikes.
Why this metric matters
Order fulfillment speed directly affects customer satisfaction. When customers receive their orders quickly, they're more likely to return and recommend your business. Conversely, slow fulfillment can damage your reputation and increase cart abandonment.
It reveals operational capacity. If your team consistently fills fewer orders than expected, it signals understaffing, process inefficiencies, or system bottlenecks. By tracking this metric, you can spot problems early and allocate resources where they're needed most.
It supports revenue forecasting. Knowing how many orders your team can realistically handle per day helps you set achievable sales targets and plan inventory more accurately. This prevents overselling and ensures you can deliver on customer promises.
It enables fair performance measurement. Sales and fulfillment teams can see concrete targets and track their progress. This transparency builds accountability and gives team members clear goals to work toward.
How to calculate sales orders filled per unit time
The formula is straightforward:
Orders Filled per Unit Time = Total Orders Completed ÷ Time Period
Example: If your fulfillment team completed 156 orders in one week, your metric would be:
156 orders ÷ 7 days = 22.3 orders per day
For monthly tracking:
- 450 orders completed in one month ÷ 30 days = 15 orders per day
- Or simply report: 450 orders per month
You can adjust the time unit (hour, day, week, month) based on your business needs and order volume.
Variations and related metrics
Average orders filled per day: The most common variation, useful for daily performance monitoring and identifying weekly patterns.
Average orders filled per week: Helps smooth out daily fluctuations and shows longer-term trends without the noise of single-day spikes or dips.
Average orders filled per hour: For high-volume operations or those with multiple shifts, hourly tracking reveals which times are most productive and where scheduling might need adjustment.
Orders filled by fulfillment center: If you operate multiple warehouses or fulfillment locations, track this metric separately to compare efficiency across sites.
Orders filled on time: Complements this metric by measuring not just quantity but also whether orders met their promised delivery dates.
Benchmarks and targets
Realistic targets depend on your industry, order complexity, and team size. Here are some general guidelines:
- E-commerce: 20–50 orders per day per fulfillment associate (varies by product type and packaging complexity)
- B2B or custom orders: 5–15 orders per day per associate (typically more complex)
- High-volume retail: 50–100+ orders per day per associate
Start by calculating your current baseline, then set incremental improvement targets. A 10–15% improvement over three to six months is often realistic without sacrificing quality.
How to improve your orders filled per unit time
Streamline your order picking process. Organize inventory by location and implement zone picking (where team members pick orders in designated areas) rather than having one person pick an entire order. This reduces travel time and errors.
Invest in automation where possible. Conveyor systems, barcode scanners, and order management software reduce manual handling and speed up processing.
Optimize your packing workflow. Pre-stage packing materials, use right-sized boxes to reduce waste, and consider assembly-line packing where one person focuses on one task (e.g., placing items, adding packing materials, sealing).
Train and cross-train your team. New team members are slower; regular training and cross-training reduce errors and build confidence. Experienced staff can mentor others and share efficiency tips.
Monitor and manage peak periods. Identify your busiest times and plan staffing accordingly. Temporary workers, flexible schedules, or shift adjustments can help you meet demand without burning out your core team.
Use data to identify bottlenecks. Track where orders slow down—is it in picking, packing, or quality checks? Once you pinpoint the issue, you can address it directly.
Reporting frequency
Most teams track this metric monthly, with weekly reviews to catch problems early. High-volume operations may monitor it daily to respond quickly to staffing or process issues.
Audience
- Sales managers: Monitor fulfillment capacity to set realistic sales targets.
- Operations and fulfillment managers: Use this metric to optimize staffing, identify process improvements, and measure team performance.
- Sales team: See how quickly orders are being processed and adjust customer expectations accordingly.
- Finance: Use fulfillment speed to forecast cash flow and resource allocation.
Related Metrics & KPIs