
Summary - Do you have more control over your sales performance than before? We’ll help you unlock the power of your sales metrics using sales analytics.
It’s no secret that sales are all about numbers. Whether you’re tracking monthly revenues or analyzing customer acquisition costs, knowing how to do sales analytics can help you identify trends and optimize performance.
Understanding sales analytics can be a game-changer for your business by allowing you to make data-driven decisions. In this article, let’s explore sales analytics, its importance, and the metrics you need to track for your business.
What is sales analytics?
Sales analytics is all about studying and understanding sales data. By using statistical methods, it helps process past sales information to find useful patterns and improve sales plans.
The sales analytics process entails turning raw sales data into valuable insights that guide strategic business choices.
Why is sales analytics important?
Sales analytics plays a pivotal role in your business growth strategy. It also helps you to optimize your sales performance and improve accountability within your team.
Here are a couple of reasons sales analytics is important.
Allows you to uncover valuable sales insights
Sales analytics goes beyond understanding past sales performances. It's a strategic tool that can help you shape your business's future.
When you analyze sales data thoroughly, you're not just looking at numbers. You're delving deep into what drives your business to uncover valuable trends that can lead to success. There’s no need to guess if you use historical and real-time analytics to predict future sales accurately.
With sales analytics, you may be able to predict how well your business will do next quarter or know which products will be in high demand. Sales analysis helps you proactively adjust your strategies to meet market needs, staying ahead of the competition.
When you can foresee opportunities and address risks early on, you can turn challenges into chances for growth in a fast-changing market.
Lets you optimize your sales performance
Making sure your sales performance is top-notch isn't just something nice to have. It's a must in today’s fiercely competitive business world.
Sales analytics serves as a microscope for your strategies. It helps you fine-tune your approach by shedding light on the strengths and weaknesses of your current strategies. Sales analytics’ continuous process of feedback and improvement keeps your sales strategies flexible and able to adjust to what customers want.
Improves accountability within the company
Sales analytics changes how accountability is established in your team by setting clear, doable, and measurable targets based on the data you've gathered. When goals are based on data, they align with your team's abilities and your business goals.
When your team can see how their efforts impact the results, it gives them a sense of ownership and pride in their work.
With this level of transparency and motivation, they won’t just try to meet random goals. They will know what objectives they’re striving towards to help the business succeed.
Moreover, sales analytics offer openness and accountability to create a culture of collaboration. It's not about blaming people when goals are missed. It's about working together to understand where things went wrong and adjust strategies.
This approach strengthens teamwork to move your business forward in a cycle of constant growth and improvement.
Sales analytics reports and dashboards
Data transparency when it comes to sales analytics is tricky. Many members of your team may lack the training required to do ad-hoc reporting in CRM tools and are more focused on revenue-generating activities like logging calls and completing demos.
That’s fair, too. You want your best reps selling, and your sales analysis should accelerate that, not hinder that.
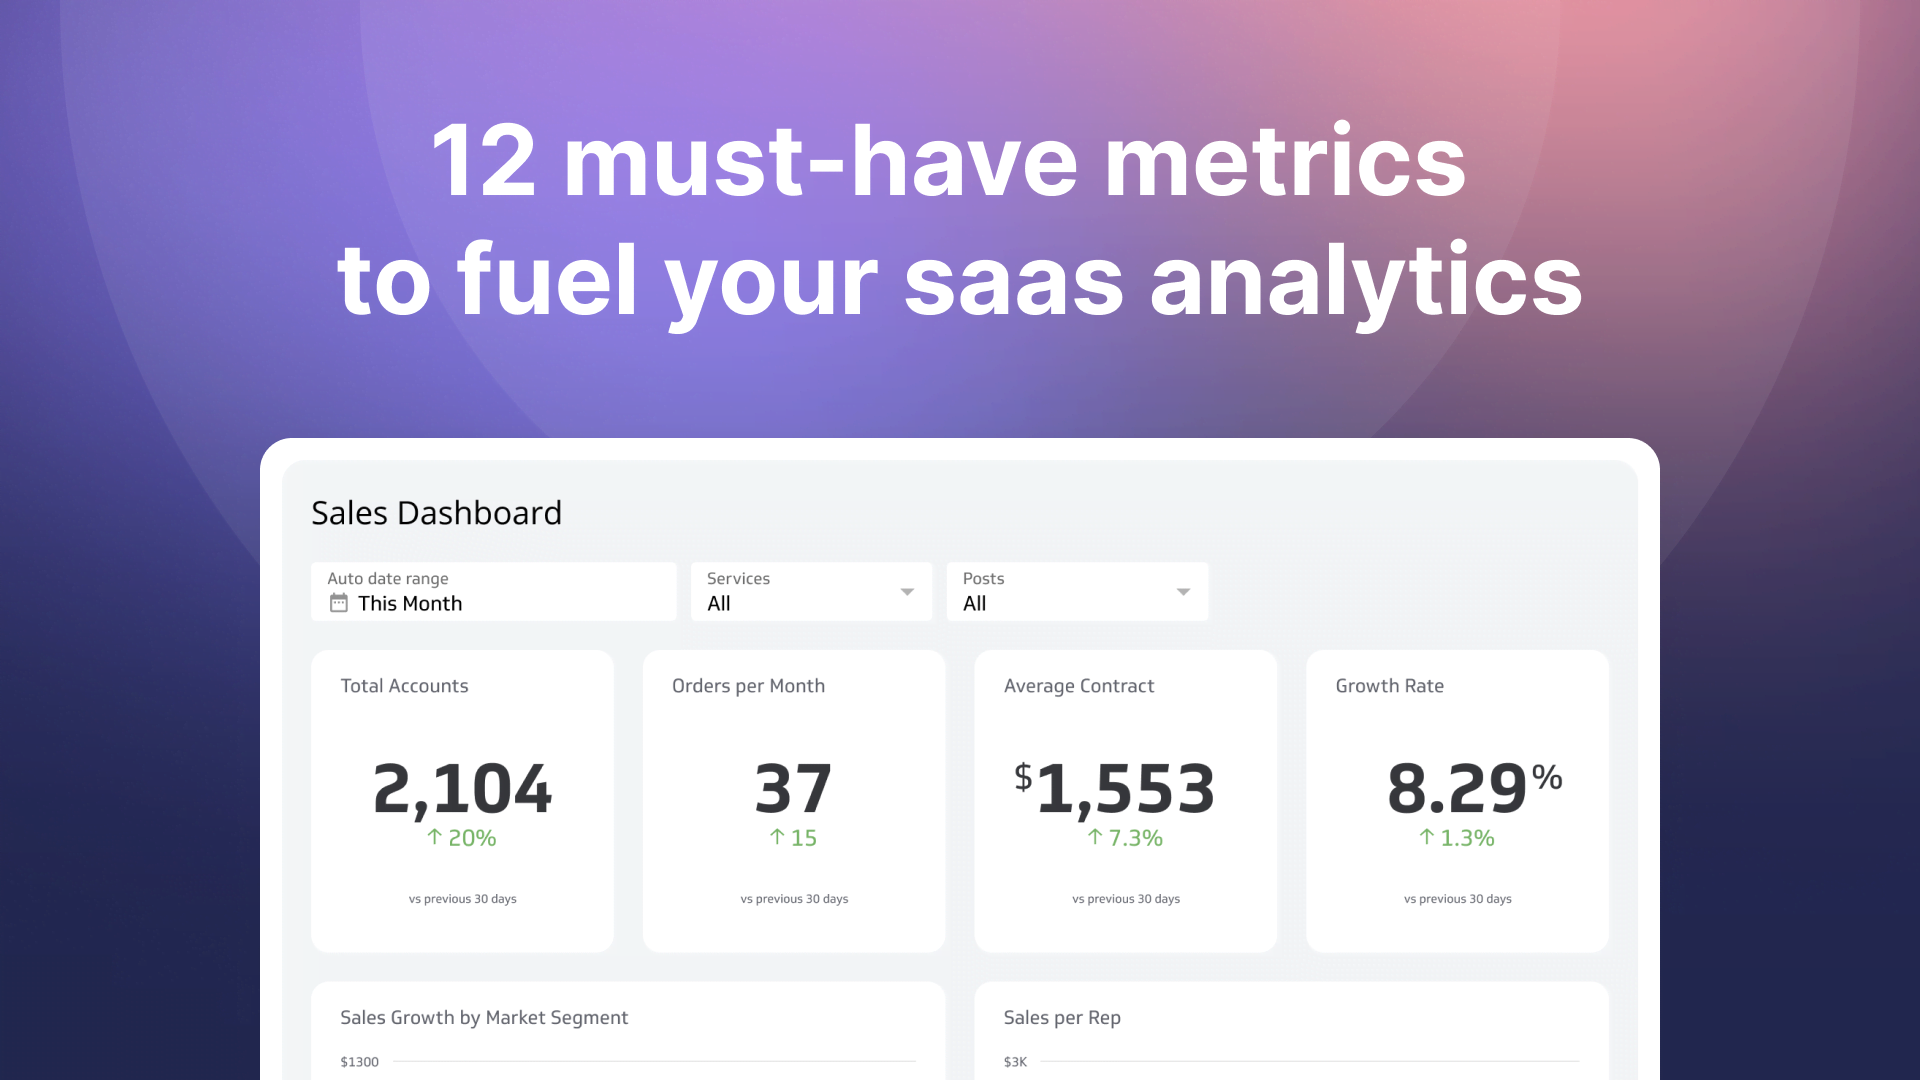
A solution for your team’s sales analytics is to display data on a sales dashboard. Ideally, the dashboard will be straightforward, intuitive, and communicate a clear message. This can be done using free tools like Google Sheets, PowerPoint, or Excel. Or it can be hooked up to a dashboard software solution like PowerMetrics.
Here’s an example of a sales analytics report generated using Klipfolio.
Another positive way to increase transparency and accountability for your sales analytics process is to display a sales leaderboard. A leaderboard can be displayed on a TV and used to track revenue performance against a time-bound target.
For example, tracking your team’s performance towards a monthly revenue objective.
Integrating a sales leaderboard into your analytics toolkit encourages healthy competition and helps align team efforts toward shared goals.
With our sales analytics visualization tool, you can make complex data easier to understand at a glance. Additionally, it serves as a real-time representation of individual and team contributions toward achieving your company’s predetermined targets.
12 important metrics and sales data to track for analysis
With endless sales metrics and KPIs, you should know the right data to track. Focus on metrics that align with your business objectives and scale your business, such as:
1. Sales Growth
By monitoring sales growth, you get a clear view of your business's health and expansion. It reflects the success of your sales strategies and the market's acceptance of your products or services.
Consistent growth shows that a business is doing well, while a lack of growth means that you need to reevaluate your strategies. From investors to stakeholders internal teams monitor sales growth to understand where the business is headed and make informed decisions based on available data.
Sales analytics revolves around your ability to grow revenue. A small blip in your trend line will do more than furrow brows—it’ll have your team digging through the data for definitive answers.
2. Sales Target
Sales targets are strategic assets that help align your team’s efforts with the overall objectives of the company. Keeping a close eye on these targets makes sure your team stays focused and motivated, giving them clear direction and a sense of purpose.
Sales may be represented as revenue, number of accounts, units sold, or any other measure that is relevant to your team. Achieving these targets often comes with incentives, which further motivate your team to do their best.
It's important to strike a balance by setting targets that are challenging yet achievable. For example, you can set a revenue goal that is slightly higher than what you achieved in the previous quarter. Or you can aim to increase the number of units sold by a percentage according to current market conditions and your team’s capabilities.
3. Opportunities
Tracking sales opportunities isn’t just about identifying potential sales but also evaluating them to determine if they are worth pursuing.
You should focus your sales efforts where they’re most likely to result in closed deals. Since predicting the future isn't possible, the next best thing is to use your current opportunities as indicators in sales analytics.
For instance, if one product consistently gets top sales during a particular season or holiday, you might want to push that product more during those times.
Prioritizing the right opportunities allows you and your sales team to work more effectively. By focusing on prospects that have a high chance of success, you can direct your resources wisely.
Your team can concentrate their efforts on leads that are most likely to become customers. It also prevents wasting time on leads that are unlikely to convert. This way, you optimize your sales efforts and boost overall performance.
4. Sales to Date
The sales-to-date metric provides you with a current view of how well your sales are performing within a specific timeframe. This sales analytics metric offers immediate feedback on whether your team is on the right track to reach their goals.
This information is essential for making small adjustments to your strategies in the short term and can motivate or guide your sales team. By regularly reviewing your sales up until now, you can identify trends and make predictions about future sales to achieve your targets.
5. Product Performance
If you’re selling multiple products, it’s important to track sales for each line. This way, you can identify which ones are doing well and which aren’t. The sales performance metric can guide your decisions on inventory, marketing, and product development.
With this sales analytics data, you can improve products, set prices, and even discontinue those that aren’t selling well. Tracking product performance will lead to maximizing profits and aligning your products with what customers want.
6. Lead Conversion Rate
Lead conversion rate is an important measure of how well your sales process turns potential customers into paying ones. A high conversion rate shows that your sales tactics are effective and that your product is appealing.
On the other hand, a low conversion rate could indicate problems in the sales process or a lack of alignment with what the market wants.
When you know where your company stands with this metric, you can increase your revenue without necessarily needing more leads.
7. Sell-through Rate
If you’re selling physical goods, tracking your sales versus the total inventory is an important analytics undertaking. A high sell-through rate means that demand is meeting or surpassing supply, while a low rate can indicate that you have too much stock or that customers are losing interest in the product.
Understanding this rate can help you strategize for production, procurement, and clearance. As a result, you can optimize your stock levels and reduce the costs of holding inventory.
8. Cannibalization Rate
Monitoring cannibalization rate is important for businesses that offer multiple similar products. It helps you understand how introducing a new product impacts the sales of existing items. Through sales analytics, you can make informed decisions about managing your product line and whether to launch new items or discontinue others.
9. Quote-to-Close
The quote-to-close ratio is a metric that shows how well your sales process turns proposals or quotes into actual sales. It gives insight into the effectiveness of your sales pitch, the competitiveness of your pricing, and the demand for your products in the market.
Improving this ratio directly impacts your profits and is an important focus for sales optimization strategies.
10. Sales per Rep
Sales per rep is crucial to monitor when planning your workforce or if you’re structuring incentives.
Checking the sales performance of each representative gives you valuable information about their individual success and helps identify those who may need extra support or training.
If you’re concerned about turning collaboration into competition, think of it as learning from one another to enhance overall sales performance.
11. Average Purchase Value
Understanding the average purchase value can guide you toward smart decisions about pricing, marketing, and product development. It can affect strategies aimed at getting customers to spend more by offering additional products or services (upselling) or by suggesting complementary items (cross-selling).
12. Sales by Region
Analyzing sales data by region helps reveal market trends, customer preferences, and areas where demand is high or low. Using insights from this sales analytics information, you can customize marketing campaigns, distribution strategies, and regional sales approaches.
It also helps identify opportunities for growth in new markets or the need to improve performance in existing ones.
Ultimately, this analysis optimizes how you allocate resources and maximizes the effectiveness of your business's geographical presence.
Best sales analytics tools
Using dedicated sales analytics tools lets you dive into your data and gain valuable insights quickly. From data collection to analysis and reporting, here are some tools you’re going to need to analyze your sales data.
Customer Relationship Management (CRM) system
Sales analytics start with data collection. A CRM lets you gather information from various sources into one centralized system and manage these connections.
With this, you can get a complete view of how customers interact with your business, from the first contact to after they make a purchase. It keeps track of every interaction, customer preference, and past purchase.
It also provides insights into what customers might buy in the future.
The data you collect from your CRM helps you personalize your marketing messages and tailor customer experiences. Ultimately, you get to provide excellent customer service, which is crucial for building strong relationships and keeping customers loyal.
CRM systems like Salesforce, HubSpot, or Zoho CRM are essential for nurturing leads and closing deals. These sales analytics tools make processes smoother and make sure that no sales opportunities get missed.
Business Intelligence (BI) software
After data collection, you then need a tool for analytics and reporting. BI software, like Klipfolio, allows you to take a deeper look into your data to find actionable insights.
The real power of BI software lies in its ability to turn all your overwhelming sales data into clear, useful information. It helps you spot trends and find areas where you can improve.
Plus, our sales analytics tool helps you keep track of how well your business is doing compared to its goals through customizable dashboards showing your sales KPIs and metrics.
PowerMetrics takes it another level further through its no-code approach, which allows you to create visualizations and dashboards without ad hoc requests. This way, all users are empowered to extract insights that can help your sales team soar.
With BI tools, you get to go beyond basic data analysis. You can use complex techniques like data mining and visualizations to make information more understandable.
Sales forecasting and trends tools
Sales forecasting tools guide you toward future success by using past data and market conditions to predict future sales. Accurate forecasts can also help you plan resources, such as inventory, staffing, and budget.
Matching these resources to what customers need lets you run your business smoothly.
Aside from forecasting, knowing market trends helps you understand what's popular and what customers are looking for. Whether it's seizing a new opportunity or avoiding a drop in sales, you can stay ahead of competitors by adapting quickly to market changes.
How to improve sales using data analytics
Understanding and applying data insights can help you enhance your strategies to boost revenue. Here are four steps you can do to improve sales through your sales data:
Set clear goals
Before diving deep into analytics, you should outline what you want to achieve. Are you looking to increase overall sales or improve the sales of a particular product? Setting clear, measurable goals will help you focus your sales analytics and interpret your data more effectively.
Maximize customer insights
Use sales analytics to dive deep into customer behavior, preferences, and feedback. This rich data lets you personalize your interactions with customers so that you can offer them products they’ll want to buy.
If your sales analytics data shows that customers in a certain region prefer a particular product, tailor your marketing efforts to highlight it to them.
Optimize your sales funnel
Your sales analytics data can help you rank potential customers based on how likely they are to make a purchase. This way, your team can prioritize leads most likely to convert into sales.
You can also conduct a conversion rate analysis and find out why some prospects purchase your products, and others don't. Sales analytics can show you what particular stage they may be losing interest and help you make necessary adjustments.
Use the right tools
The right sales analytics tools can make a significant difference in how you leverage data for your sales.
For instance, PowerMetrics makes it easy for you to create customized dashboards that don’t require coding skills. This way, you can uncover valuable insights based on your initial analysis and share them with your team.
Strengthen your sales strategy
Your sales data offers a wealth of information that can help you optimize every part of your sales process, from lead generation to closing deals.
By staying on top of the right metrics and applying the insights from your analysis, you can enhance your sales performance and capitalize on new opportunities. Ultimately, you can contribute to your business's growth and profitability.
What are the key reasons to build a sales leaderboard?
- Track individual sales performance in real-time
- Track team sales performance in real-time
- Directly compare performance across multiple sales analytics metrics or KPIs
- Use friendly competition to fuel motivation in the sales team
- Create a transparent, data-driven work environment
- Make quick decisions based on the data instead of waiting for end-of-quarter reports
Also see:
The 19 sales KPIs of modern sales teams
Related Articles

5 tips to understand (and organize) your restaurant data
By Saleem Khatri — June 9th, 2026
6 dashboards I use daily to run my SaaS company
By Allan Wille, Co-Founder — April 10th, 2026
Business Metrics vs. KPIs: What’s the Difference?
By Jonathan Taylor — March 13th, 2026
