Product Sales Dashboard
See which products are driving your business forward.
What is a product sales dashboard?
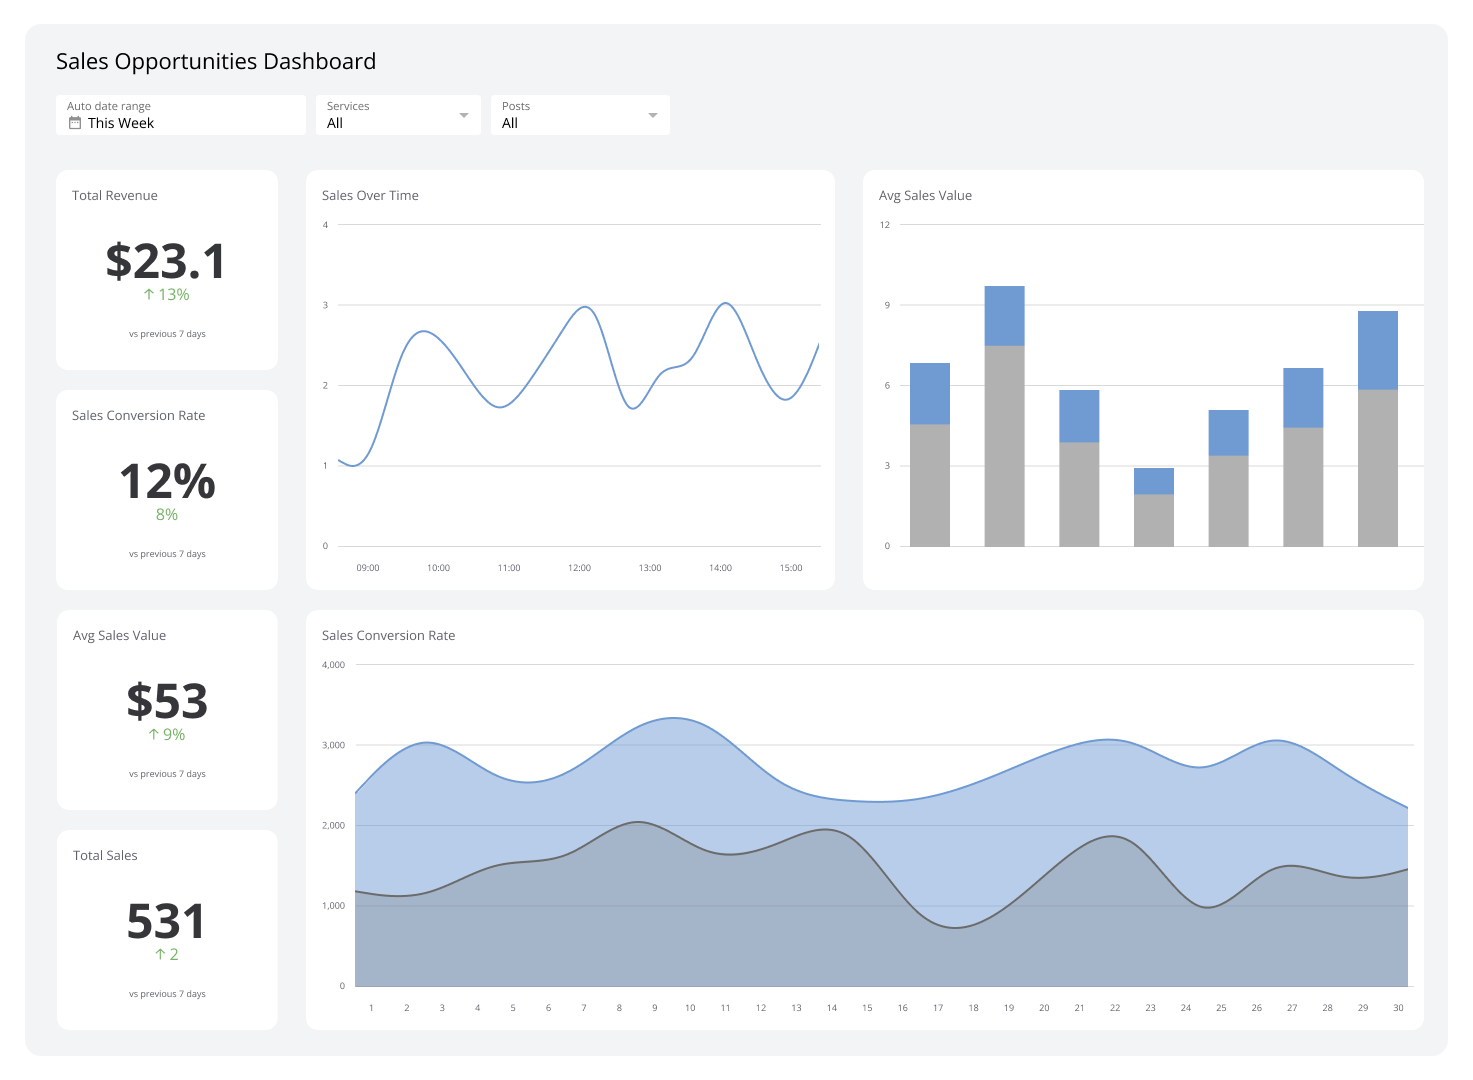
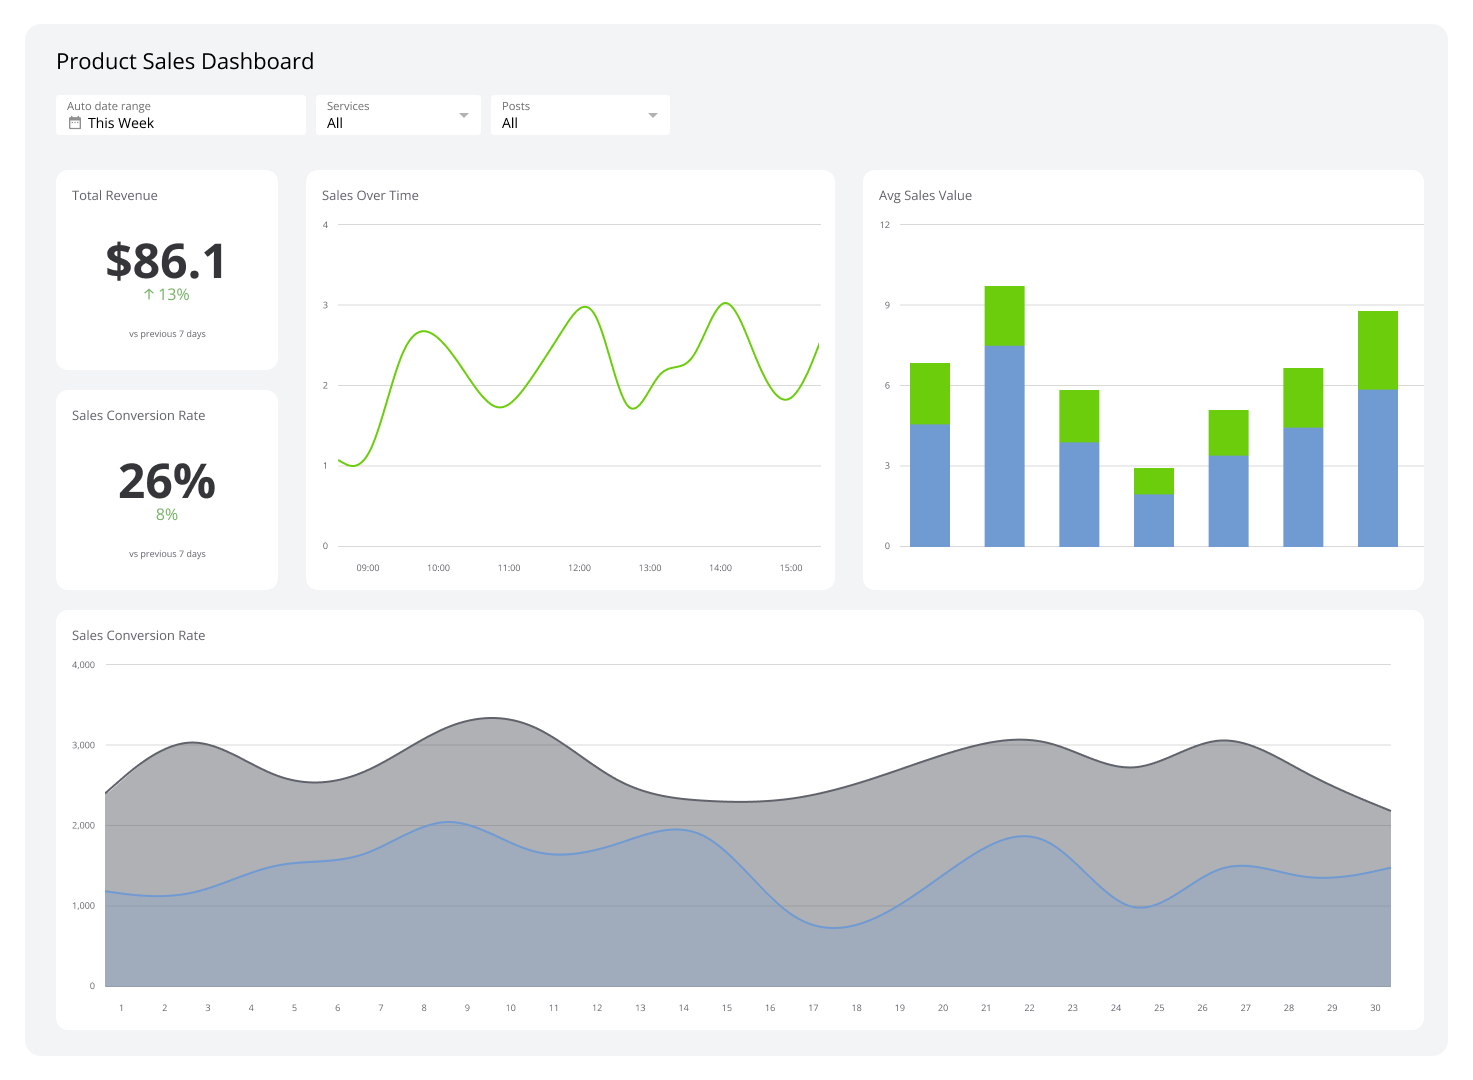
Which of your products are truly driving growth? A product sales dashboard gives you a real-time, visual overview of your product-related sales data — what's selling, where it's selling, and which items are most profitable.
By consolidating metrics like sales volume, revenue per product, and inventory levels into a single interactive view, a sales dashboard helps you move beyond spreadsheets. Track product performance, identify sales trends, and make data-driven decisions to maximize profitability.
Key metrics for your product sales dashboard
An effective product sales dashboard helps you monitor performance from production to final sale. Here are the essential metrics to track:
Revenue per product: See which products are your top sellers and which are underperforming. Focus your marketing and sales efforts where they'll have the biggest impact.
Sales volume by region: Understand geographic performance to identify high-demand areas and untapped markets. This insight supports smarter distribution and inventory decisions.
Profit margin per product: Go beyond top-line revenue to see which products are most profitable. Use this to make strategic decisions about pricing, promotions, and product development.
Inventory levels: Track stock in real time to prevent stockouts on popular items and reduce costs from overstocking slow-moving products.
Stop digging through separate systems for the data you need. Use Klipfolio Klips to build a custom product sales dashboard that connects to all your sales and inventory data — giving you a single source of truth to drive your business forward.
Why a product sales dashboard matters
Without a centralized view of product performance, decisions get made on instinct rather than data. A product sales dashboard removes that guesswork.
When your sales, inventory, and margin data live in separate tools, spotting a trend or catching a problem takes time you don't have. A dashboard surfaces those insights automatically, so your team can act quickly — whether that means reordering stock, adjusting pricing, or doubling down on a high-margin product.
For growing companies managing multiple product lines, this kind of visibility isn't a nice-to-have. It's what keeps operations aligned and revenue growing.
What to look for in a product sales dashboard
Not all dashboards are built the same. When choosing or building one, look for these capabilities:
Real-time data connectivity: Your dashboard should pull live data from your sales platform, ERP, or inventory system — not a spreadsheet you update manually.
Customizable visualizations: Bar charts, trend lines, and heatmaps each tell a different story. Choose a tool that lets you pick the right visual for each metric.
Multi-source integration: Product sales data often lives across several platforms. A strong dashboard connects them all in one place.
Role-based access: Sales managers, executives, and operations leads need different views. Look for granular permissions so each person sees what's relevant to them.
Scheduled reporting: Automated PDF or email reports keep stakeholders informed without requiring them to log in.
Klipfolio Klips supports all of these capabilities, with 130+ data connectors, 30+ visualization types, and flexible distribution options including TV mode, public links, and scheduled email reports.
How to build a product sales dashboard with Klips
Building a product sales dashboard in Klips starts with connecting your data sources. Klips supports direct connections to popular sales platforms, cloud storage, and SQL databases — so you're not starting from scratch.
- Connect your data: Link your sales platform, inventory system, or ERP using one of Klips' 130+ connectors.
- Choose your metrics: Select the KPIs most relevant to your product lines — revenue, margin, volume, and inventory are a strong starting point.
- Build your Klips: Use the drag-and-drop editor and Excel-like formulas to create visualizations for each metric.
- Set your refresh rate: Schedule data refreshes from every minute to every 24 hours, depending on how often your data changes.
- Distribute your dashboard: Share with your team via secure link, embed it in an internal portal, or display it on a TV in your office.
Try Klipfolio Klips free and build your first product sales dashboard today.
At a glance
Focus Area
Product performance tracking, revenue analysis, inventory management, and profitability by product line.
Metrics List
Revenue per product, sales volume by region, profit margin per product, inventory levels.
Reference Rate
Real-time to daily, depending on sales platform and inventory system refresh cadence.
Related Dashboards
View all dashboards