Sales Value Productivity Metric
Measure the average revenue generated by each sales agent on your team.
Track all your Sales KPIs in one place
Sign up for free and start making decisions for your business with confidence.
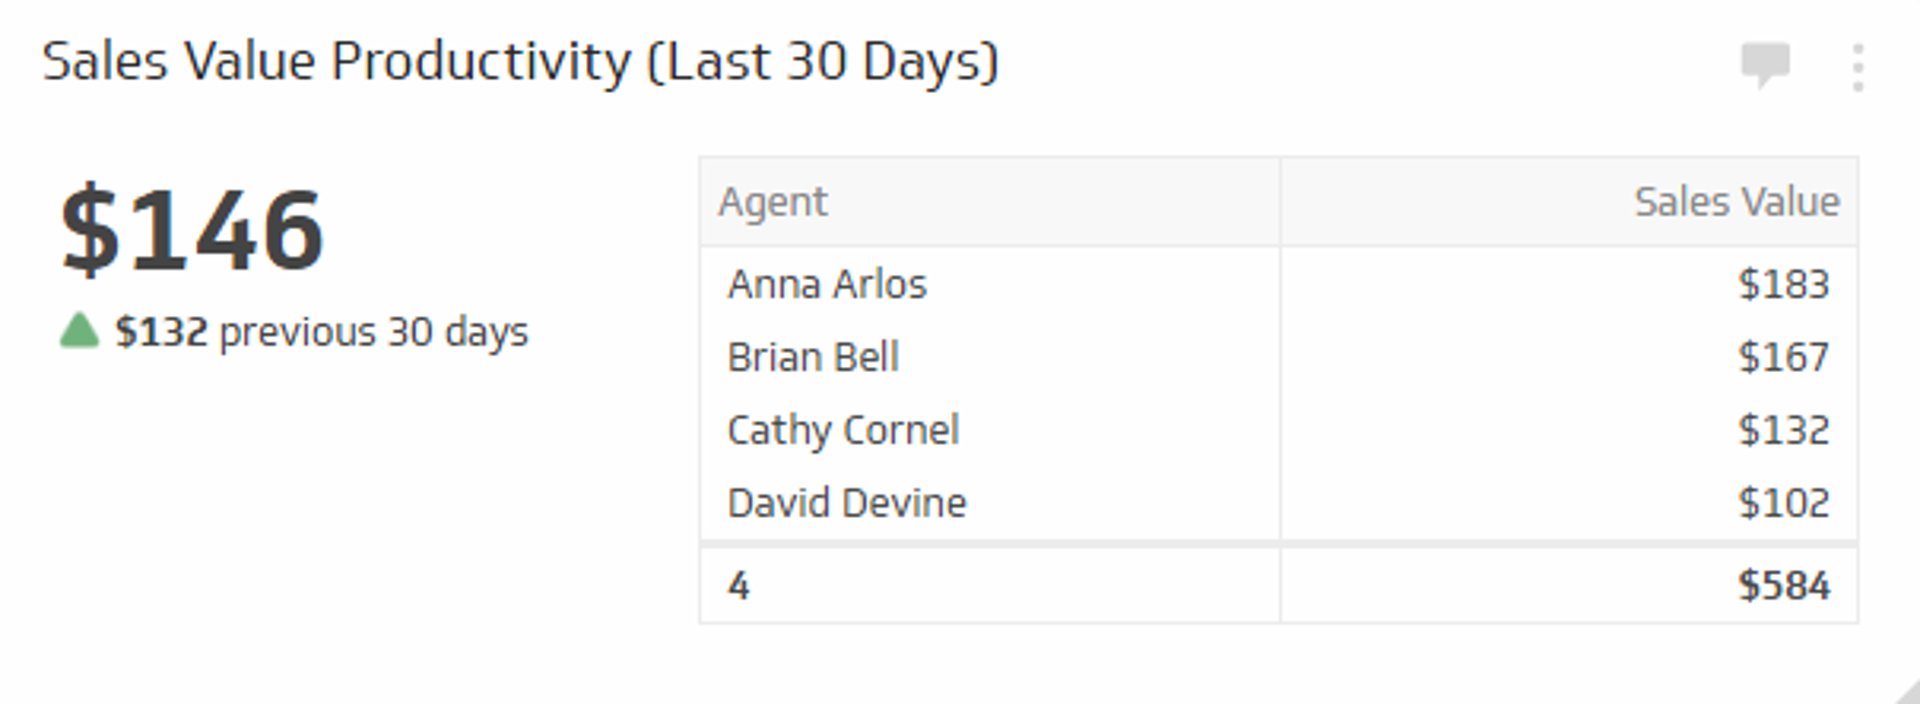
Sales value productivity measures the average revenue generated by each member of your sales team. It's a straightforward indicator of how effectively your sales agents convert opportunities into revenue.
Understanding this metric helps you evaluate individual and team performance, identify training needs, and set realistic sales targets. When tracked consistently, it reveals whether your sales efforts are becoming more or less efficient over time.
What is sales value productivity?
Sales value productivity is the total sales revenue divided by the number of sales agents. It shows you the average dollar amount each agent brings in during a specific period.
Formula: Total sales revenue / Total number of sales agents
Why sales value productivity matters
Sales agents are among your biggest operational investments. Tracking their productivity ensures that investment translates into meaningful revenue. This metric helps you:
- Benchmark performance: Compare individual agents against team averages to spot top performers and those who need support.
- Justify headcount: Determine whether adding or reducing sales staff makes financial sense based on revenue per agent.
- Set realistic targets: Establish achievable quotas grounded in actual team productivity data.
- Identify training gaps: When productivity dips, it often signals coaching or skill-development needs.
- Forecast revenue: Project future sales based on consistent productivity trends.
How to calculate sales value productivity
The calculation is simple, but the insight is valuable.
Step 1: Add up all revenue generated by your sales team for a specific period (monthly, quarterly, or annually).
Step 2: Count the total number of sales agents during that same period.
Step 3: Divide total revenue by the number of agents.
Example: If your sales team generated $600,000 in revenue last month and you have 5 agents, your sales value productivity is $120,000 per agent per month.
Sales value productivity vs. related metrics
Sales value productivity works best alongside other metrics. Here's how it differs from similar measures:
- Sales quota attainment: Tracks whether individual agents hit their targets; productivity measures average output across the team.
- Revenue per transaction: Focuses on deal size; productivity focuses on total output per person.
- Win rate: Measures the percentage of closed deals; productivity measures the dollar value generated.
- Average customer lifetime value: Projects long-term customer worth; productivity measures immediate agent output.
Typical targets and benchmarks
Sales value productivity varies widely by industry, product complexity, and sales model. However, here are general guidelines:
- SaaS companies: $150,000–$300,000 per agent annually (depending on deal size and sales cycle).
- Professional services: $200,000–$500,000 per agent annually.
- Retail or transactional sales: $50,000–$150,000 per agent annually.
- Enterprise sales: $500,000+ per agent annually (longer cycles, larger deals).
Your target should reflect your business model, market conditions, and growth stage. A common starting benchmark is $120,000 per agent per month, but adjust based on your actual data and industry standards.
How to improve sales value productivity
If your productivity metric is below target, consider these strategies:
Optimize your sales process Streamline steps from lead qualification to close. Remove bottlenecks that slow deals or lose prospects.
Invest in training and coaching Regular skill development—especially in objection handling, discovery, and closing techniques—directly boosts agent output.
Refine your target market Focus your team on high-value prospects and accounts. Better-fit leads close faster and at higher values.
Provide better tools and data Sales automation platforms, CRM systems, and real-time dashboards help agents work smarter and close deals faster.
Adjust compensation and incentives Align commission structures with your revenue goals. Higher-performing agents often respond to meaningful financial rewards.
Reduce administrative burden Automate routine tasks (data entry, follow-ups, scheduling) so agents spend more time selling.
Monitor and act on feedback Regular one-on-ones and performance reviews help you catch issues early and provide timely support.
Tracking sales value productivity with dashboards
Manual spreadsheets make it hard to track productivity in real time. A dashboard approach offers several advantages:
- Real-time visibility: See productivity updates as deals close, not weeks later.
- Automated calculations: Reduce errors and save time on manual updates.
- Visual trends: Charts and graphs reveal patterns (seasonal dips, ramp periods, growth trajectories).
- Comparative analysis: Quickly compare agents, teams, and time periods side by side.
- Alerts: Set thresholds to flag when productivity drops below target.
Klips dashboards connect directly to your CRM or sales data, pulling revenue and agent counts automatically. This means you always have current, accurate productivity metrics without manual effort.
Key takeaways
- Sales value productivity measures average revenue per sales agent—a direct indicator of team efficiency.
- Calculate it by dividing total revenue by the number of agents for a specific period.
- Use it alongside related metrics (quota attainment, win rate, customer lifetime value) for a complete performance picture.
- Typical targets range from $50,000 to $500,000+ per agent annually, depending on your industry and sales model.
- Improve productivity through better processes, training, targeting, tools, and incentives.
- Dashboard software makes it easy to track and act on productivity trends in real time.