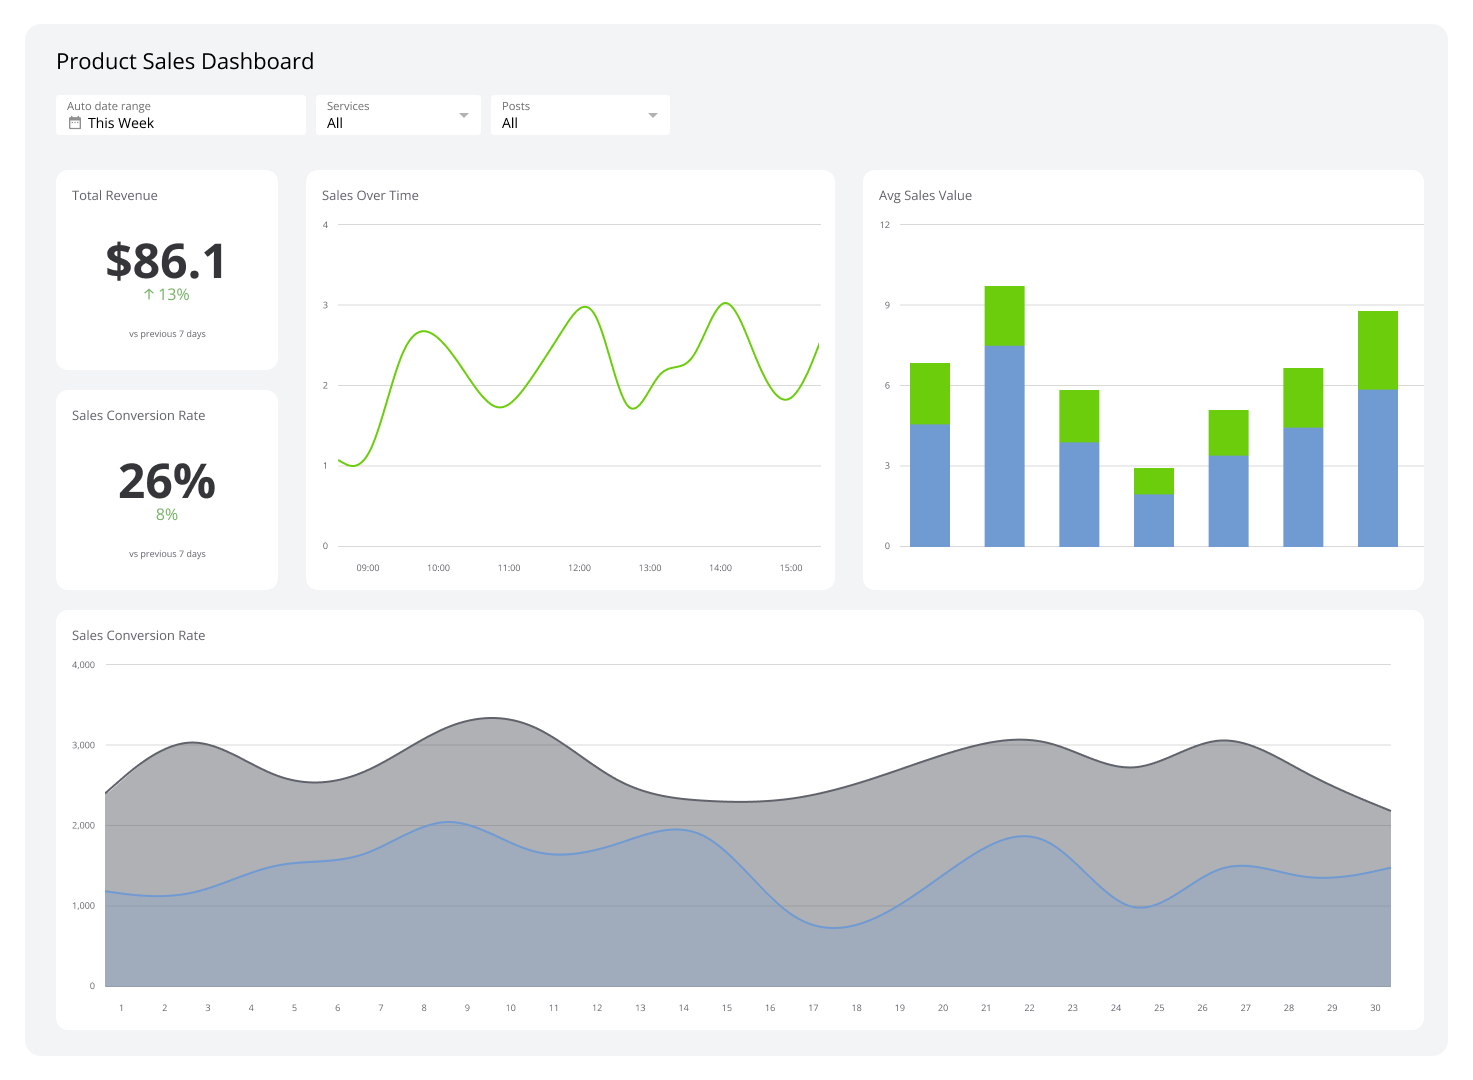
Monthly Sales Dashboard
Track MRR, new accounts, and daily sales in real-time.
What is a Monthly Sales Dashboard?
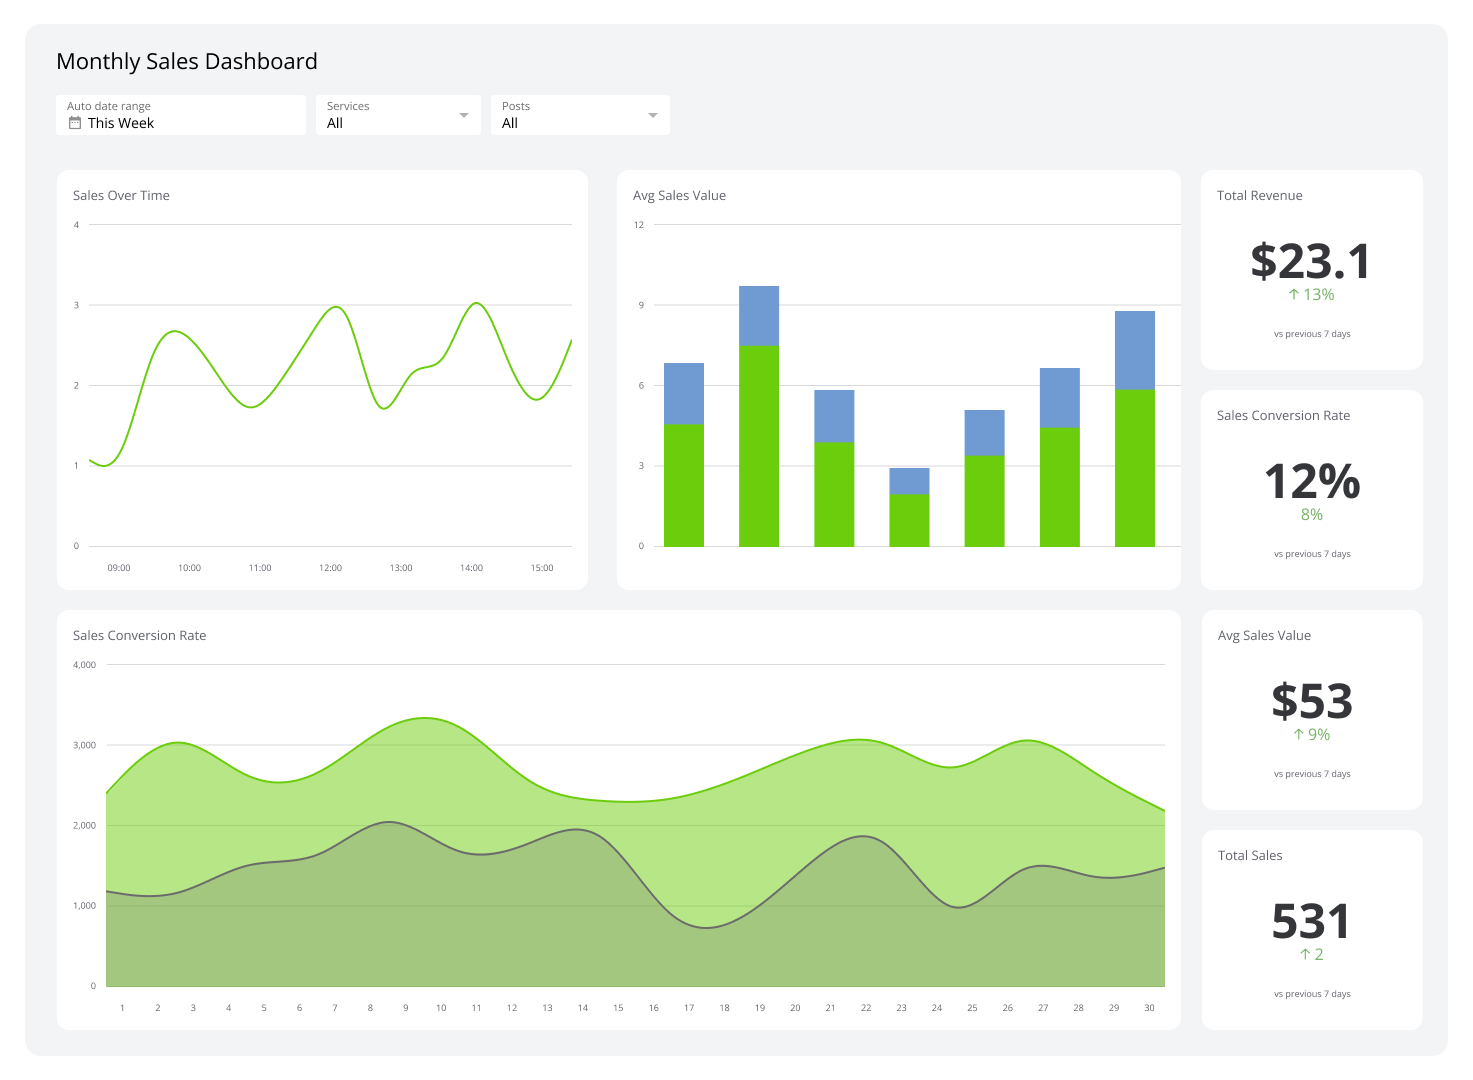
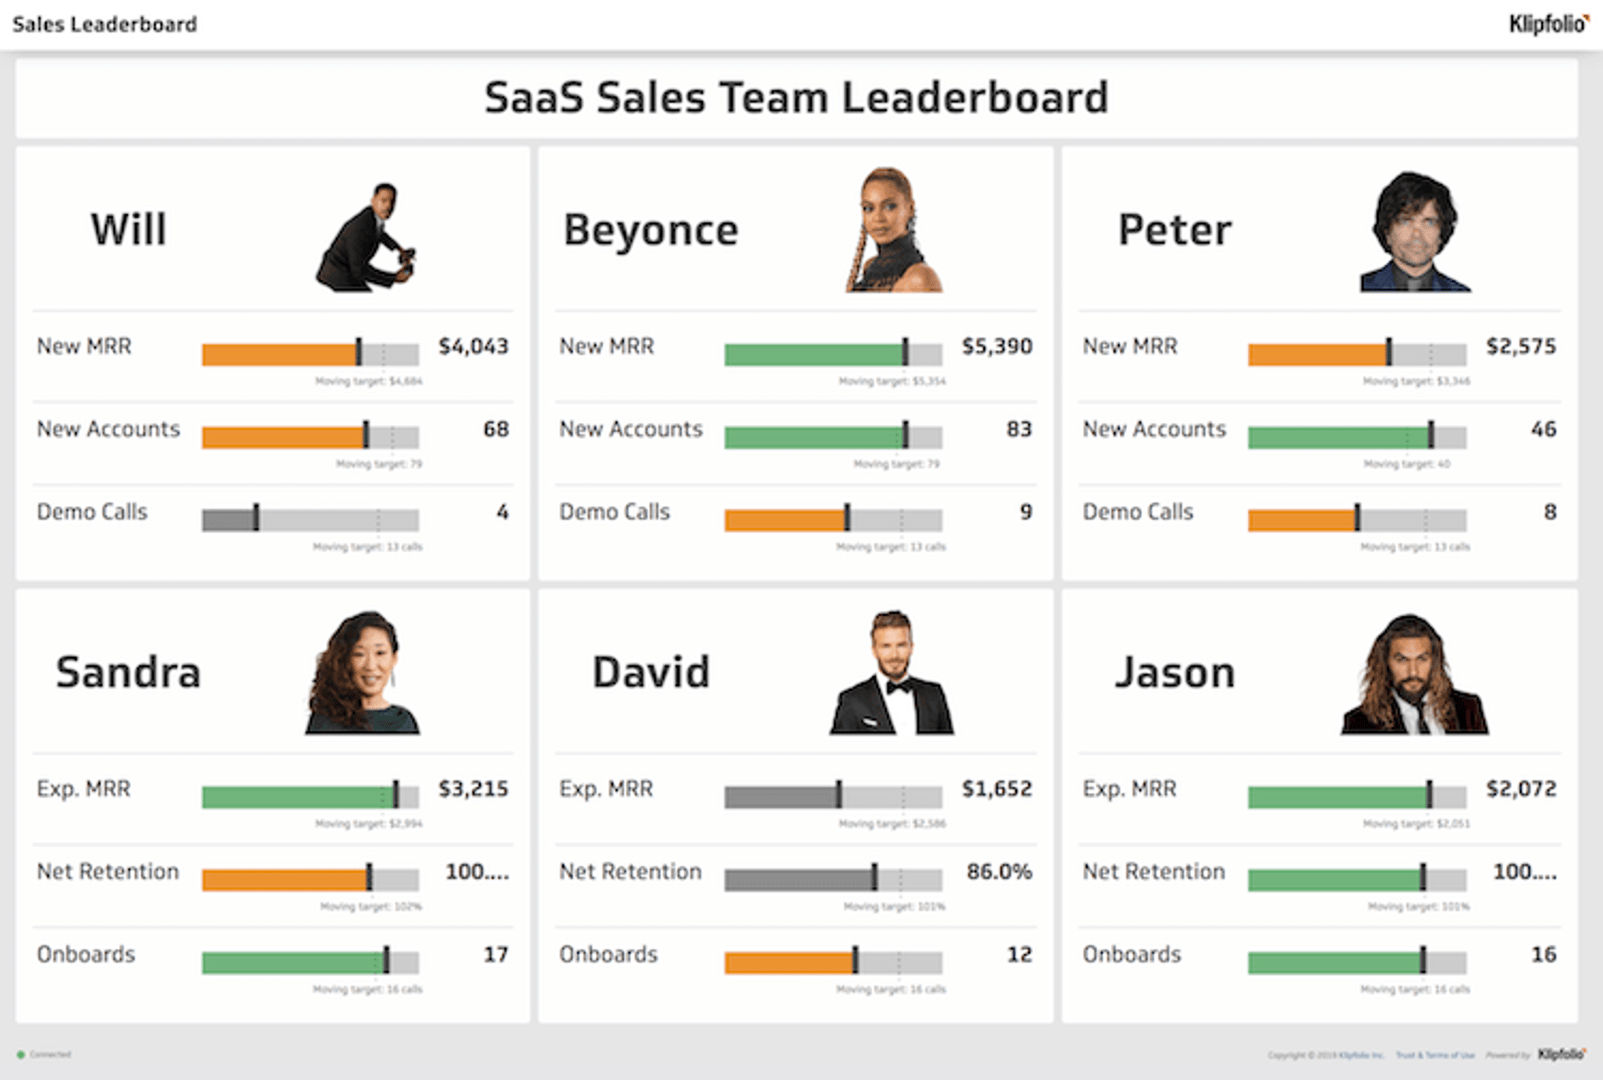
A monthly sales dashboard makes monitoring progress easy and accessible to your entire team. When your sales team has access to the business targets and current performance, it creates transparency and alignment within the department. The team no longer has to rely on weekly status reports from an Excel sheet that has to be updated continuously.
This sales dashboard is a dashboard report that is used by teams to monitor their progress towards sales targets throughout the month. This type of sales dashboard is used to highlight KPIs that are tracked and reported on monthly, including metrics like sales today, new accounts this month, and MRR this month.
Dashboards turn raw data into simple visualizations that make it easier for teams to understand their progress and any areas they may be falling short. A sales dashboard is beneficial for teams who:
- Want to track sales performance in real-time
- Have business goals and targets to report on
- Want to make data-driven decisions
- Want to avoid excel sheets for reporting sales metrics and KPIs
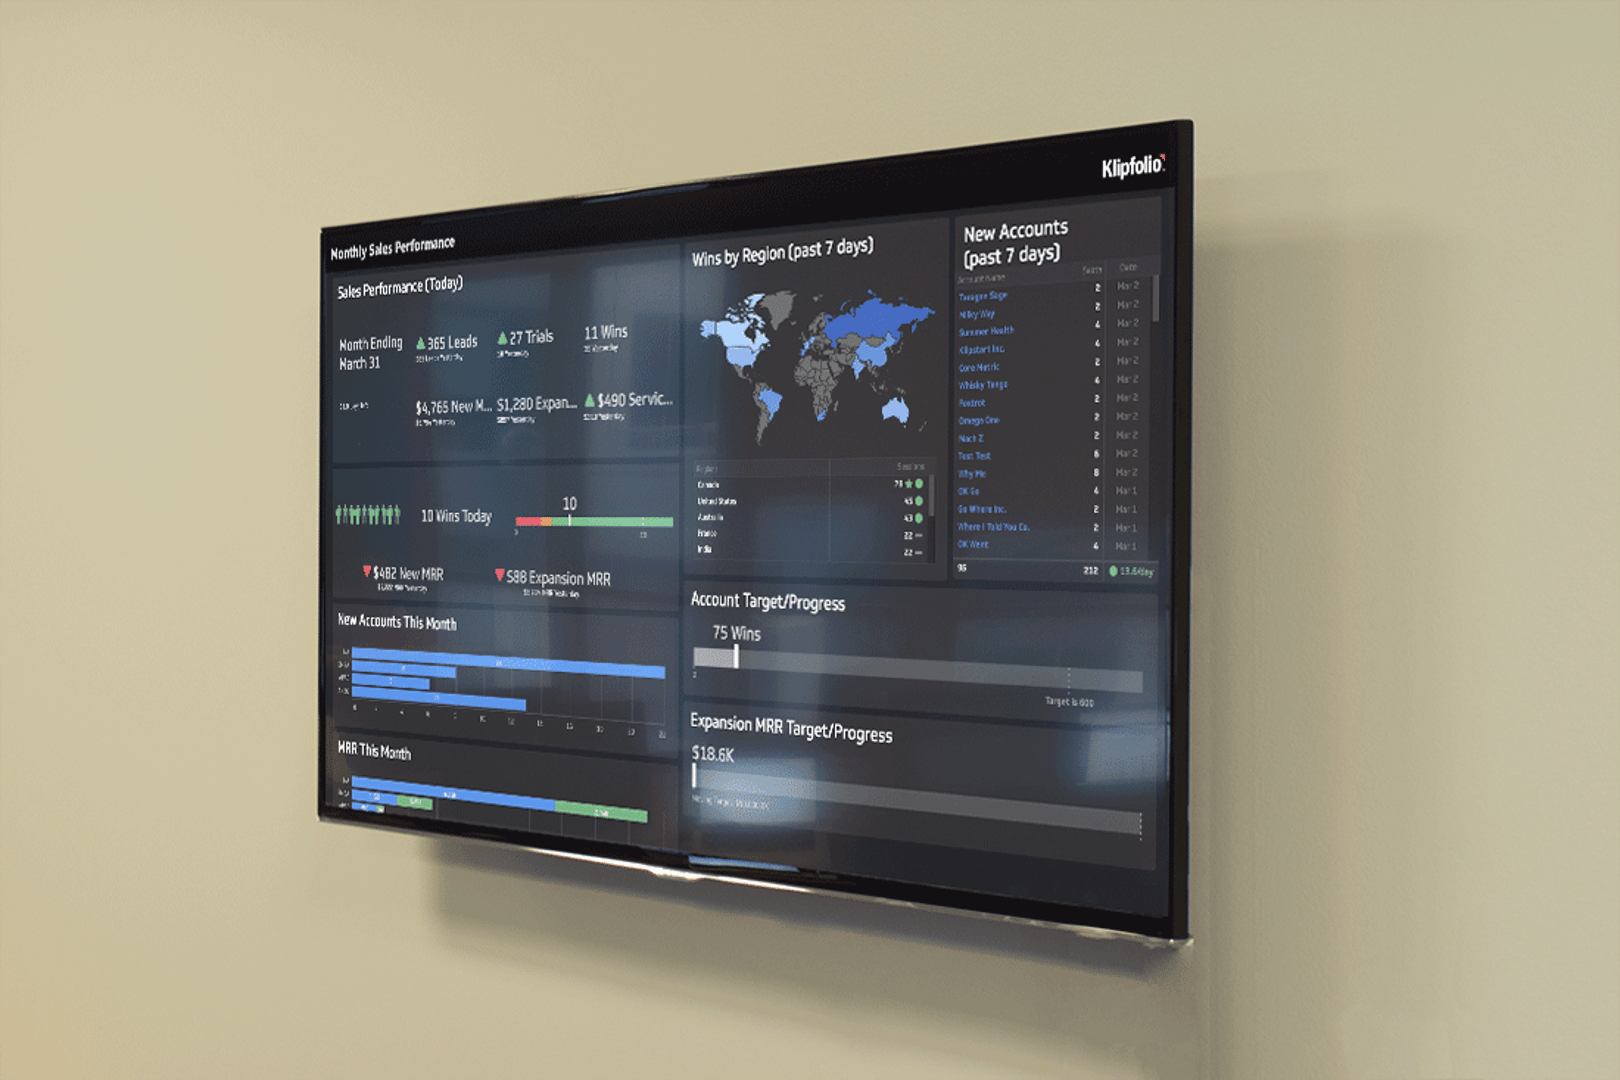
How to build a monthly sales dashboard?
You can create a monthly sales dashboard using data from your CRM and charting those metrics with your business targets. Use these steps to build your own sales dashboard:
- Create a report in your CRM that tracks the sales KPIs you report on each month.
- Create an Excel spreadsheet to track your monthly sales targets for each KPI you want to monitor.
- Use your CRM report and Excel spreadsheet to build data visualizations that compare your monthly performance against your sales targets.
- Make your data accessible to your entire team by displaying your dashboard on a tv monitor in your department.
Examples of sales metrics to add to your dashboard
Since building a sales dashboard is tied so closely to your CRM, we thought it would be helpful to show a few examples of what you can build. Check out these examples:
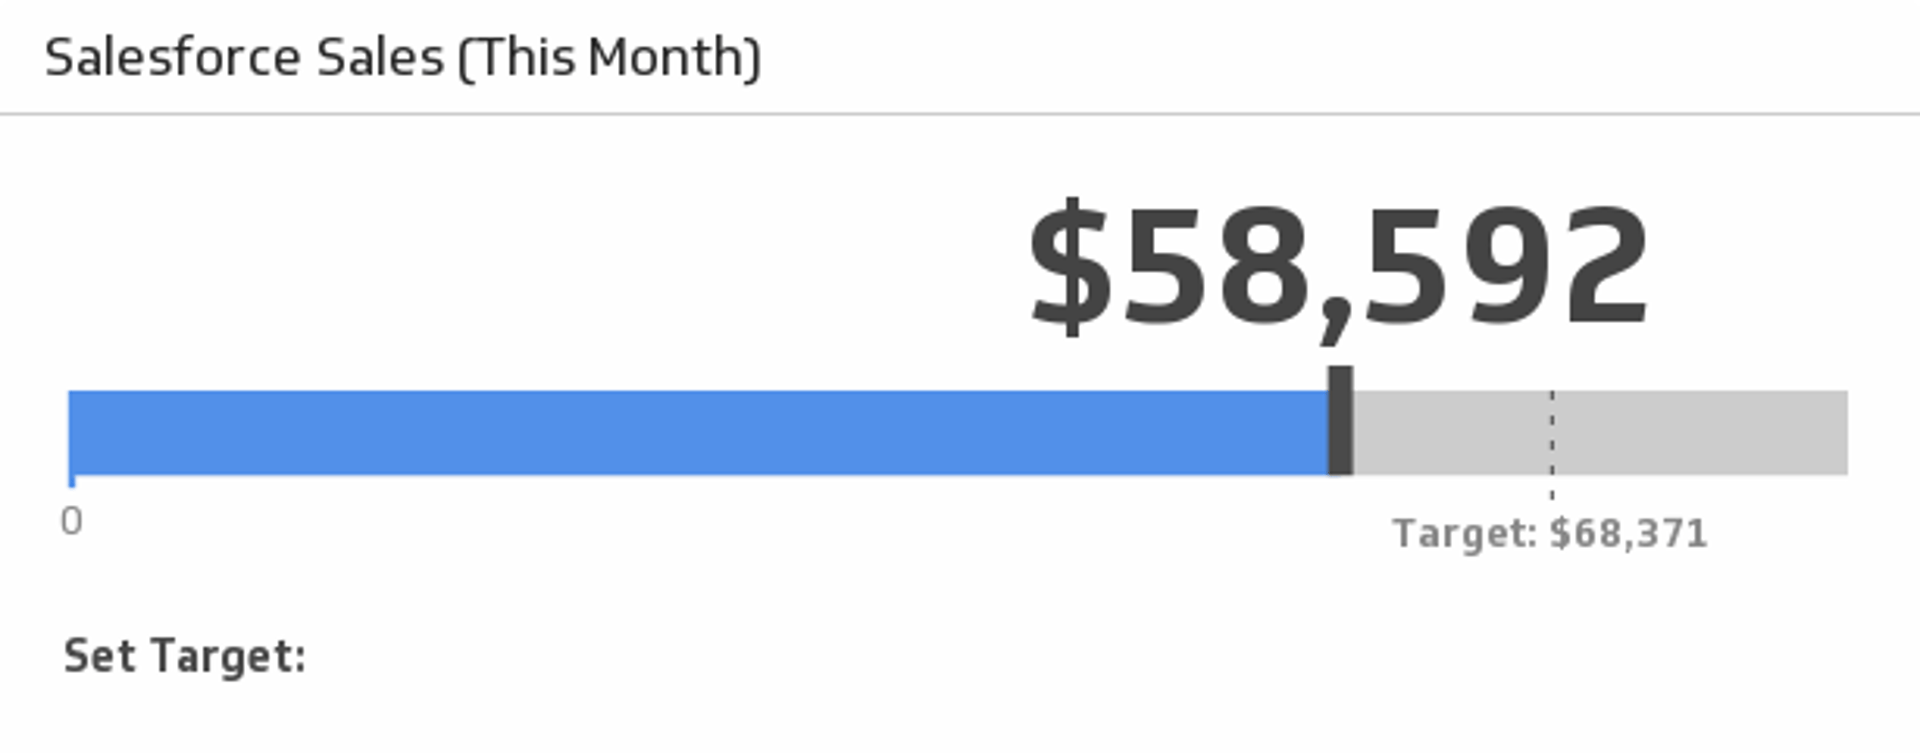
Sales this month
Monitor your sales this month and compare to the average of the last three months.
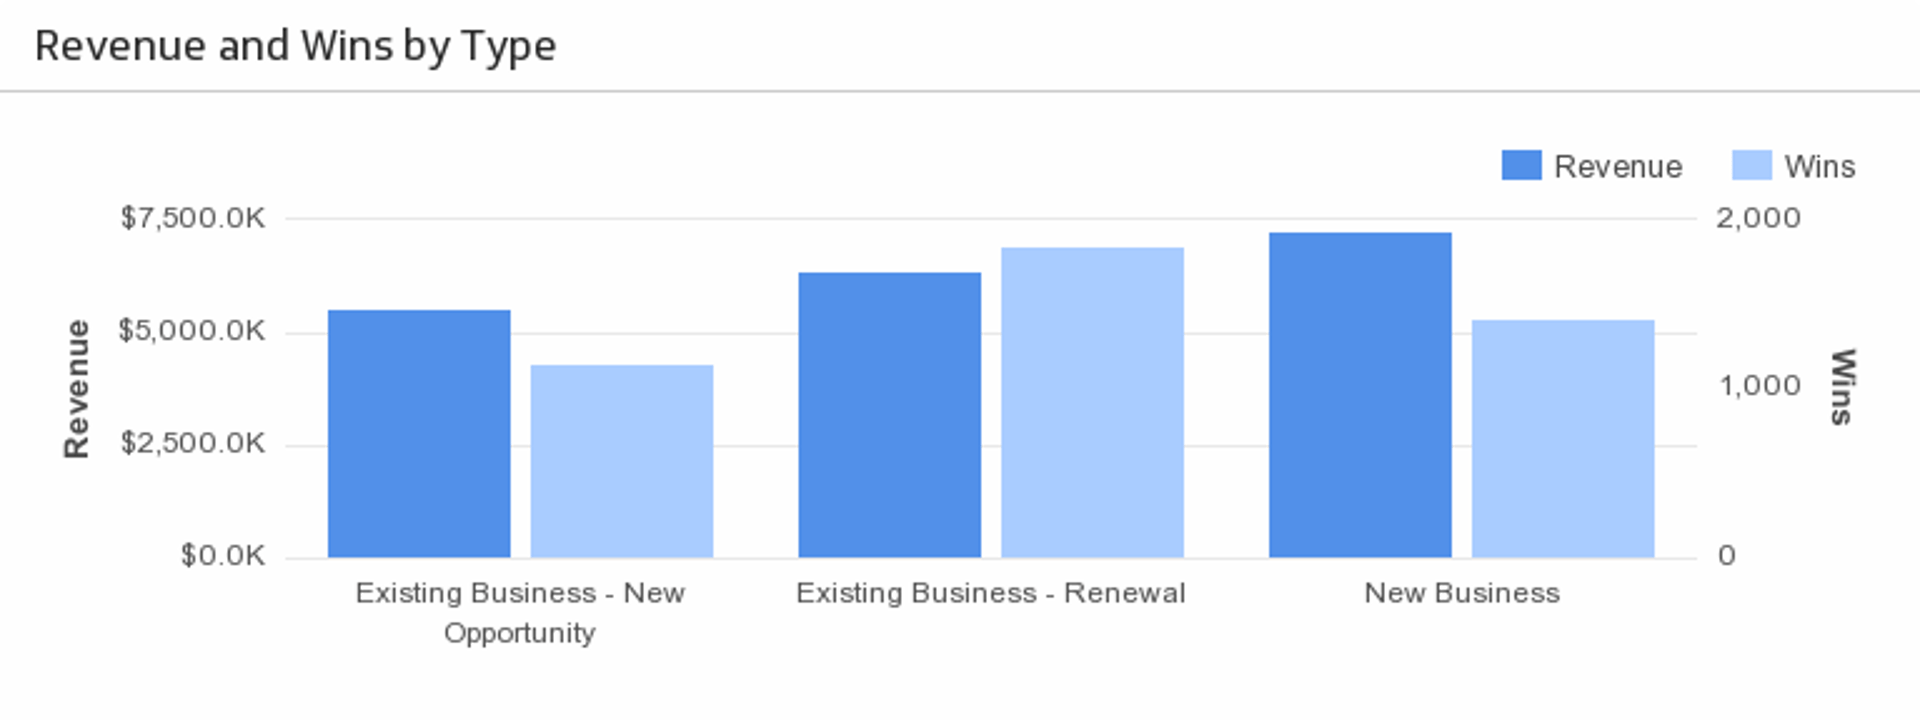
Revenue and wins by type
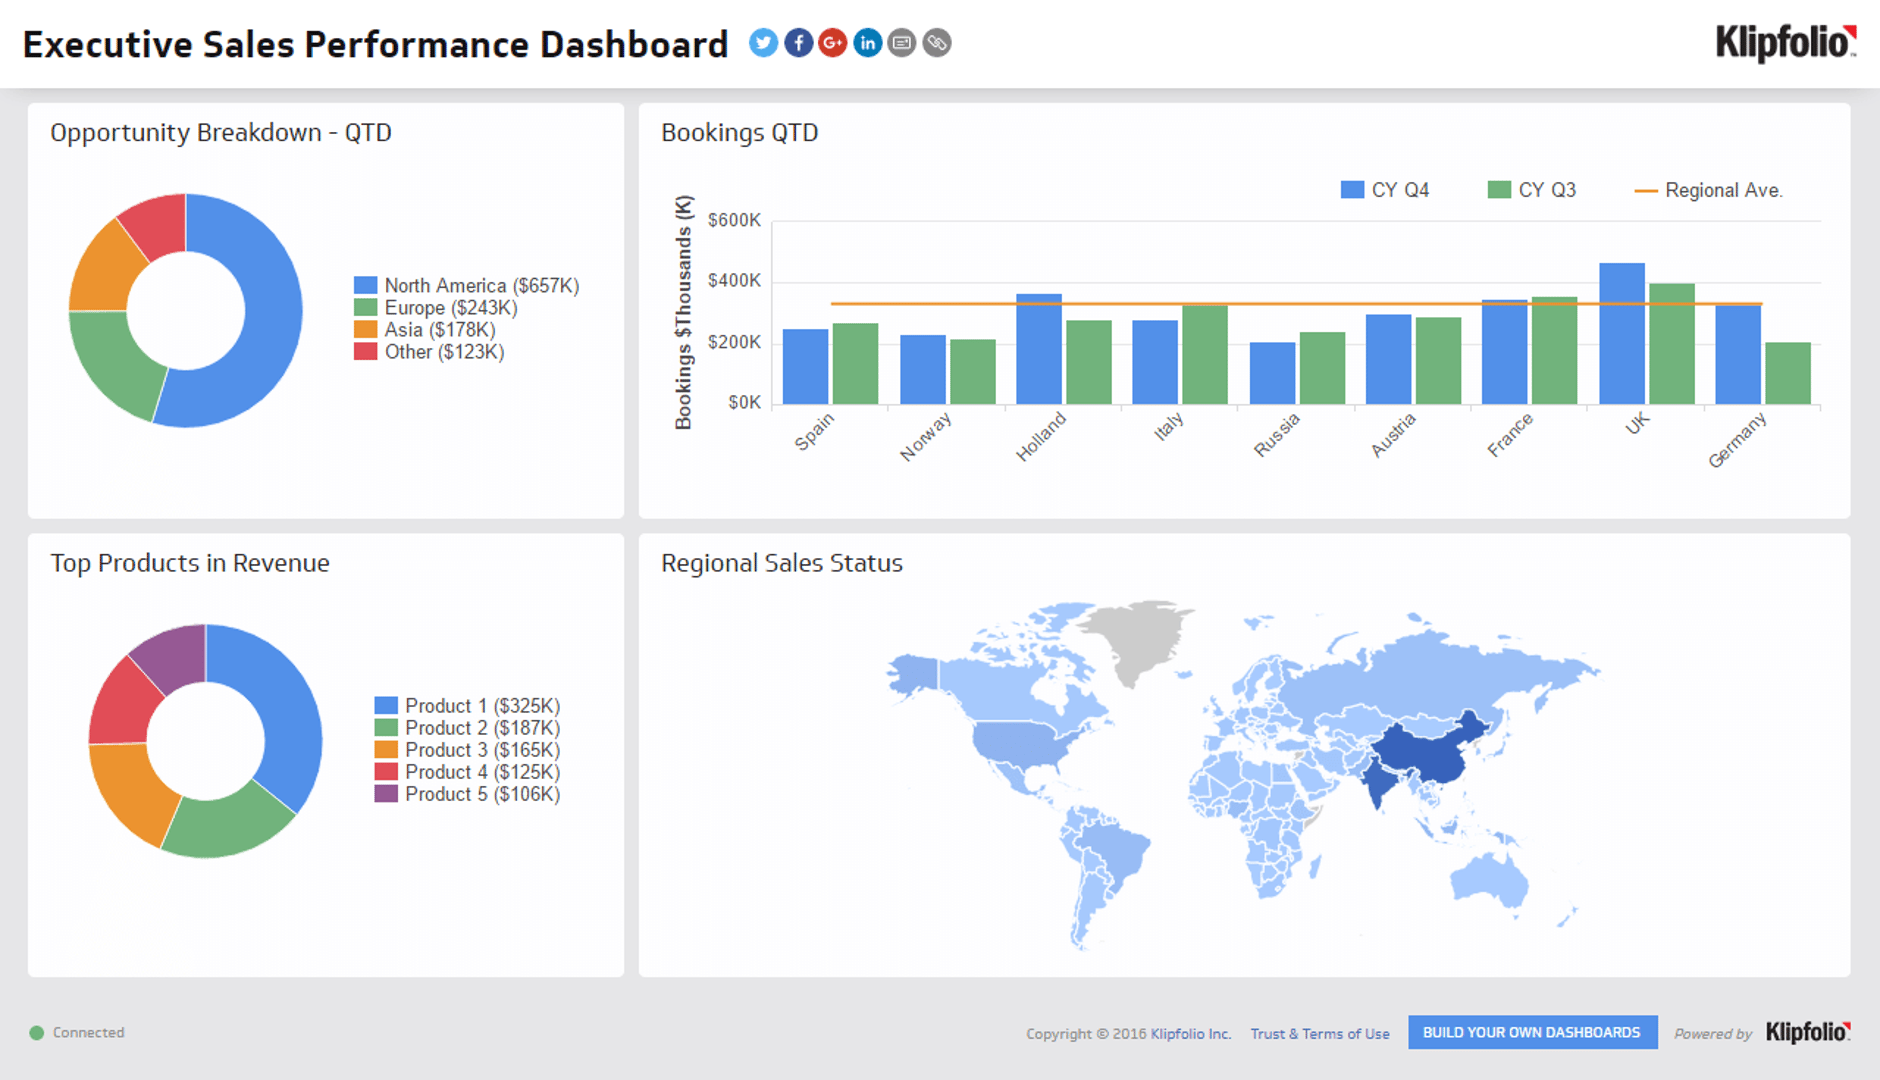
Understand what types of opportunities are bringing in the most revenue.
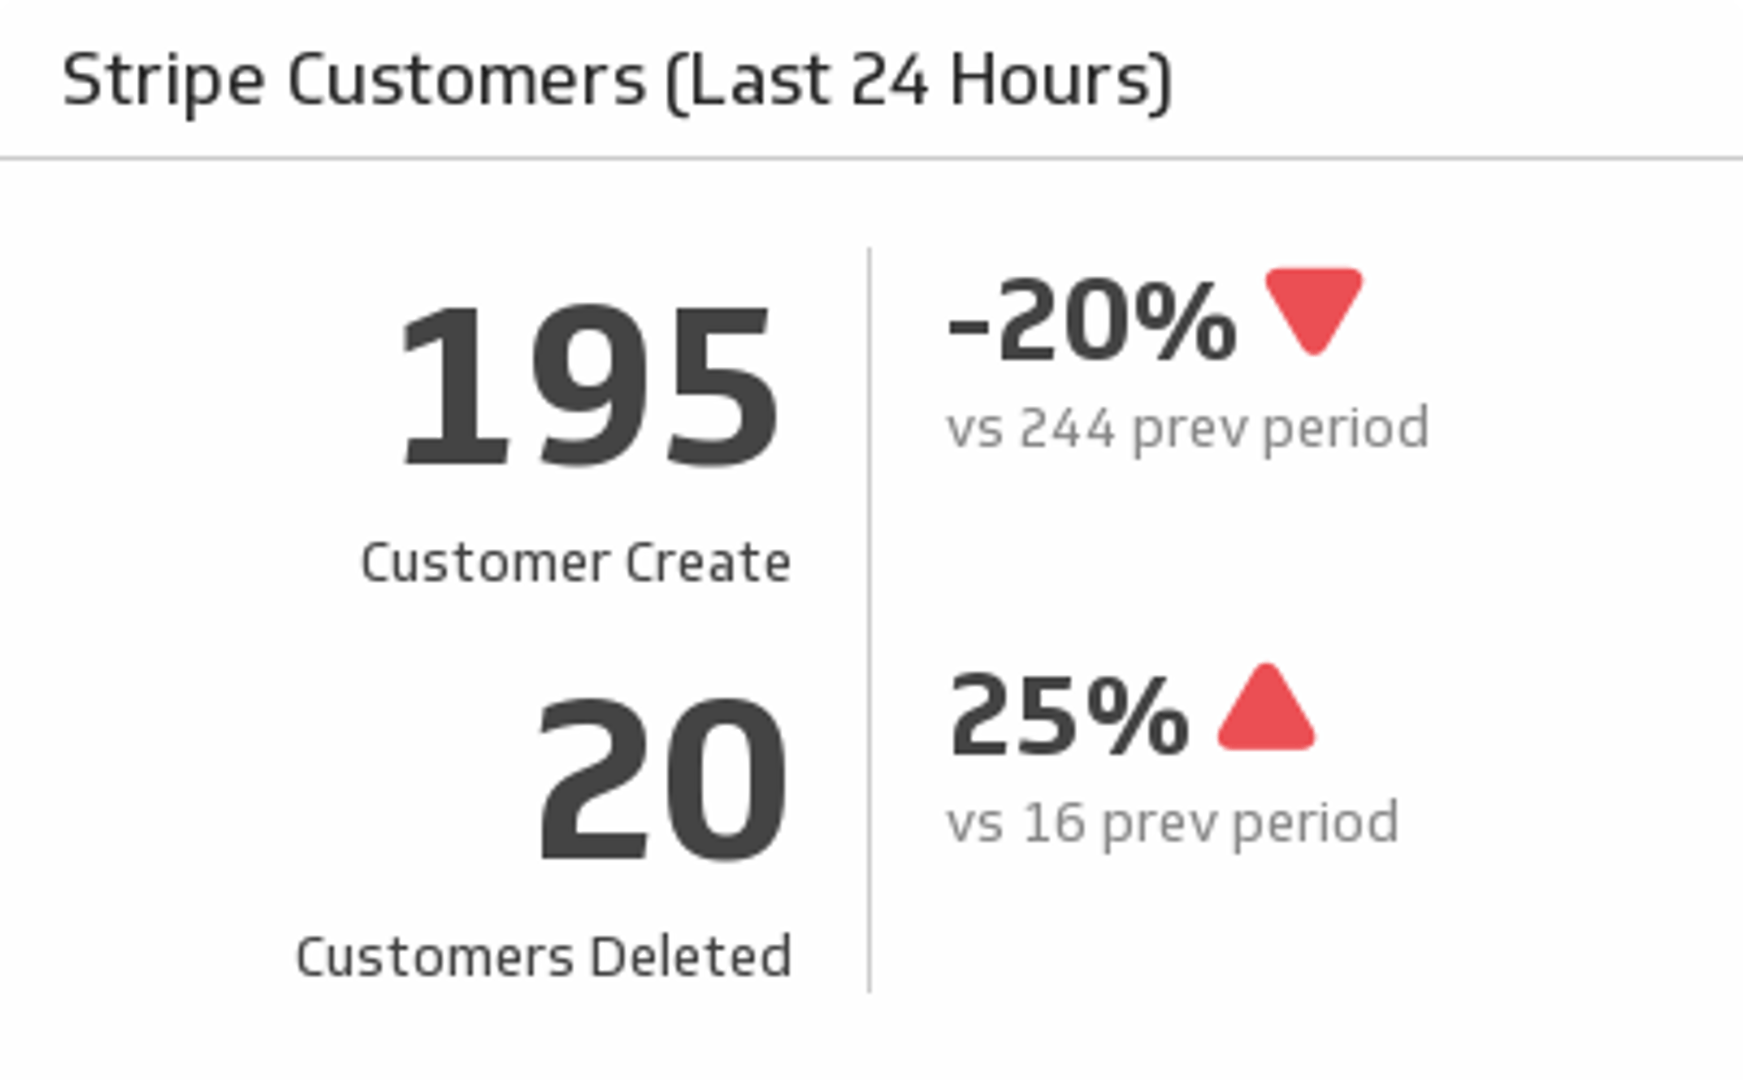
Customers (last 24 hours)
Discover how many Stipe customers you have gained and lost in the past 24 hours and compare it to the previous period.
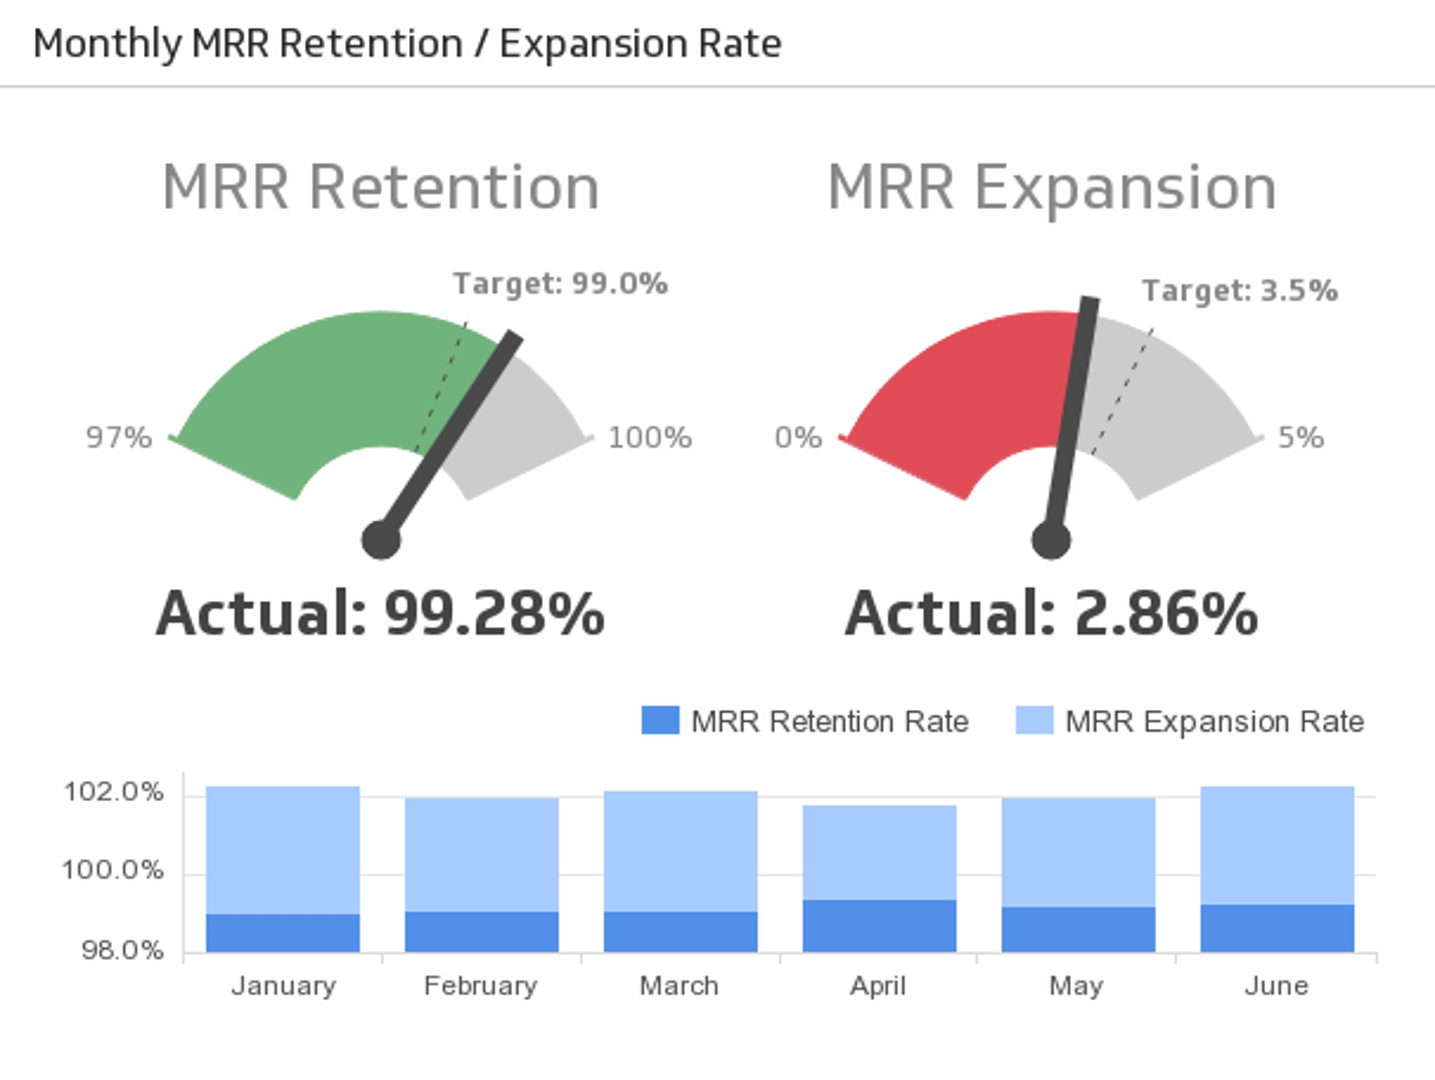
MRR Retention / Expansion rate
Monthly Recurring Revenue (MRR) is a central facet to many businesses. Track how effective your organization is at retaining and growing expected monthly revenue.
At a glance
Metrics List
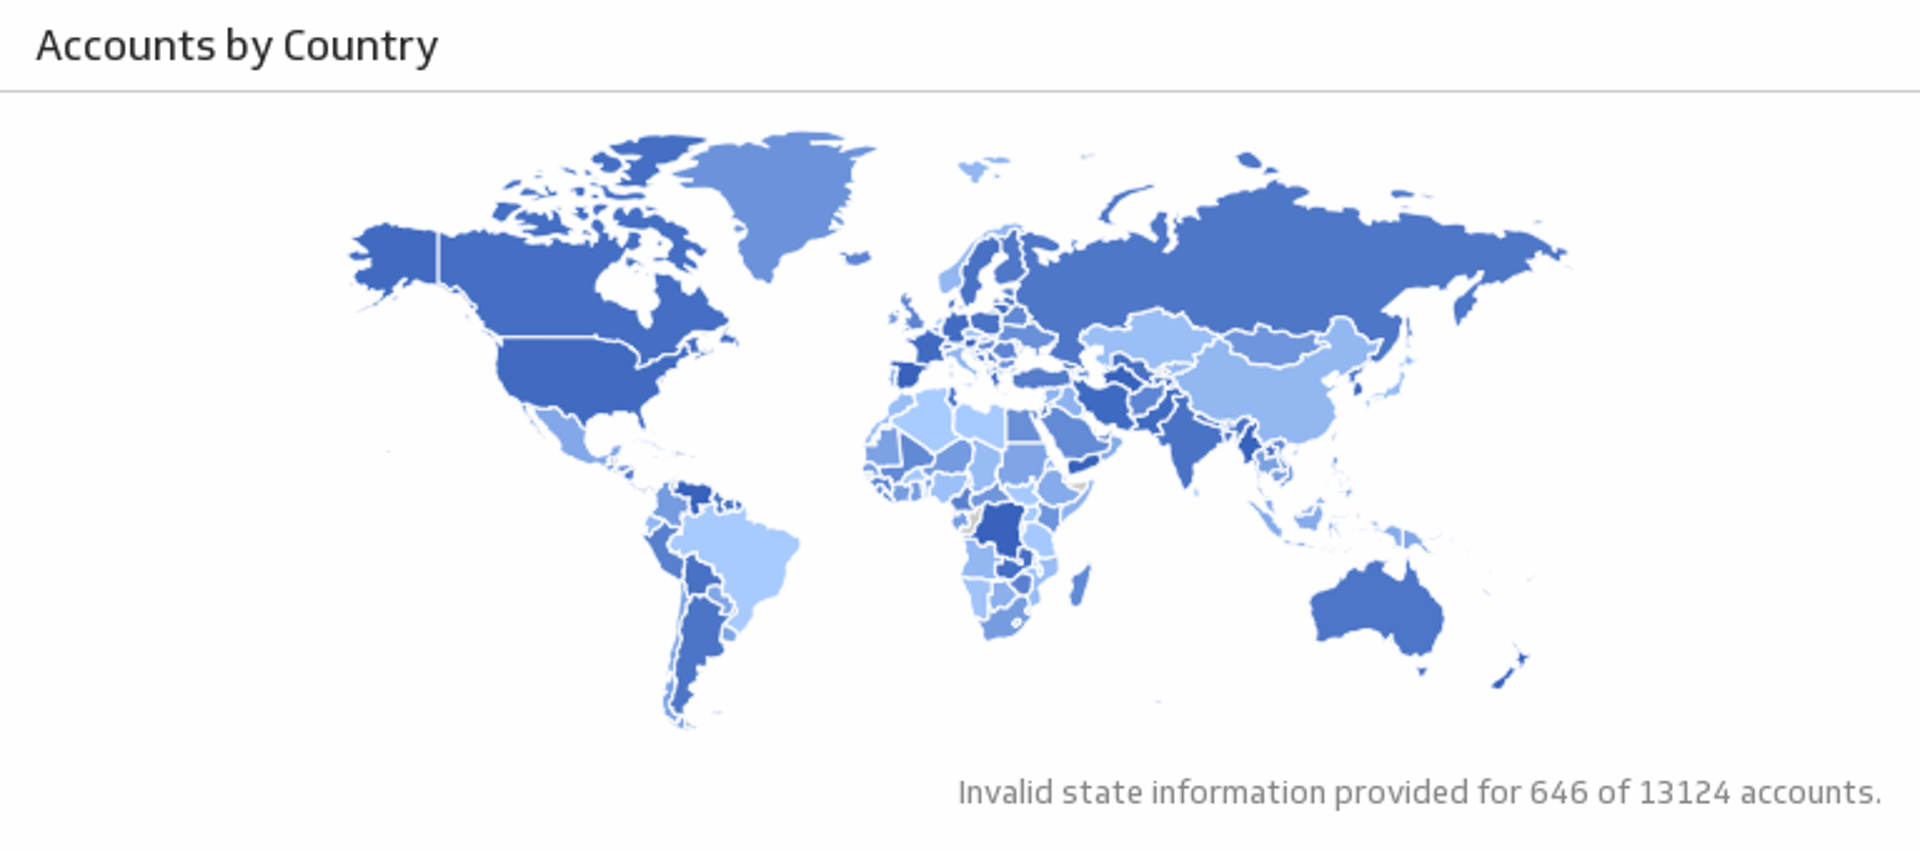
Sales by region, sales by day, new accounts, new MRR, expansion MRR, retention
Related Dashboards
View all dashboards
