Gross Profit Margin
Measures the percentage of revenue remaining after subtracting the cost of goods sold, before operating expenses.
Gross Profit Margin
What is Gross Profit Margin?
Gross Profit Margin is the percentage of revenue that remains after subtracting the cost of goods sold (COGS), before operating expenses are deducted.
It shows how efficiently your business turns sales into profit at the production level. Keep in mind that Gross Profit Margin is not a complete picture of overall profitability — for that, refer to Net Profit Margin.
Gross Profit Margin formula
Gross Profit Margin = (Gross Profit / Revenue) × 100
Where:
Gross Profit is total revenue minus the cost of goods sold (COGS).
Revenue is the total income generated from the sale of goods or services before any expenses are deducted.
The result shows the proportion of each dollar earned that remains after covering production costs. Both gross profit and Total Revenue are found on the income statement.
Gross Profit Margin examples
The following examples show how to apply the formula across different business types.
Example 1: Clothing retailer
Revenue: $1,000,000
Cost of Goods Sold: $600,000
Gross Profit Margin = (($1,000,000 - $600,000) / $1,000,000) × 100 = 40%
For every dollar of revenue, the retailer retains $0.40 as gross profit.
Example 2: Software company
Revenue: $2,500,000
Cost of Goods Sold: $1,000,000
Gross Profit Margin = (($2,500,000 - $1,000,000) / $2,500,000) × 100 = 60%
For every dollar of revenue, the software company retains $0.60 as gross profit. Software businesses typically carry higher margins because their COGS — primarily development and hosting costs — are lower relative to revenue than physical goods.
Why Gross Profit Margin matters
Gross Profit Margin tells you whether your core business model is financially sound before overhead enters the picture. A declining margin signals rising production costs, pricing pressure, or an unfavourable product mix — all issues that compound quickly if left unchecked.
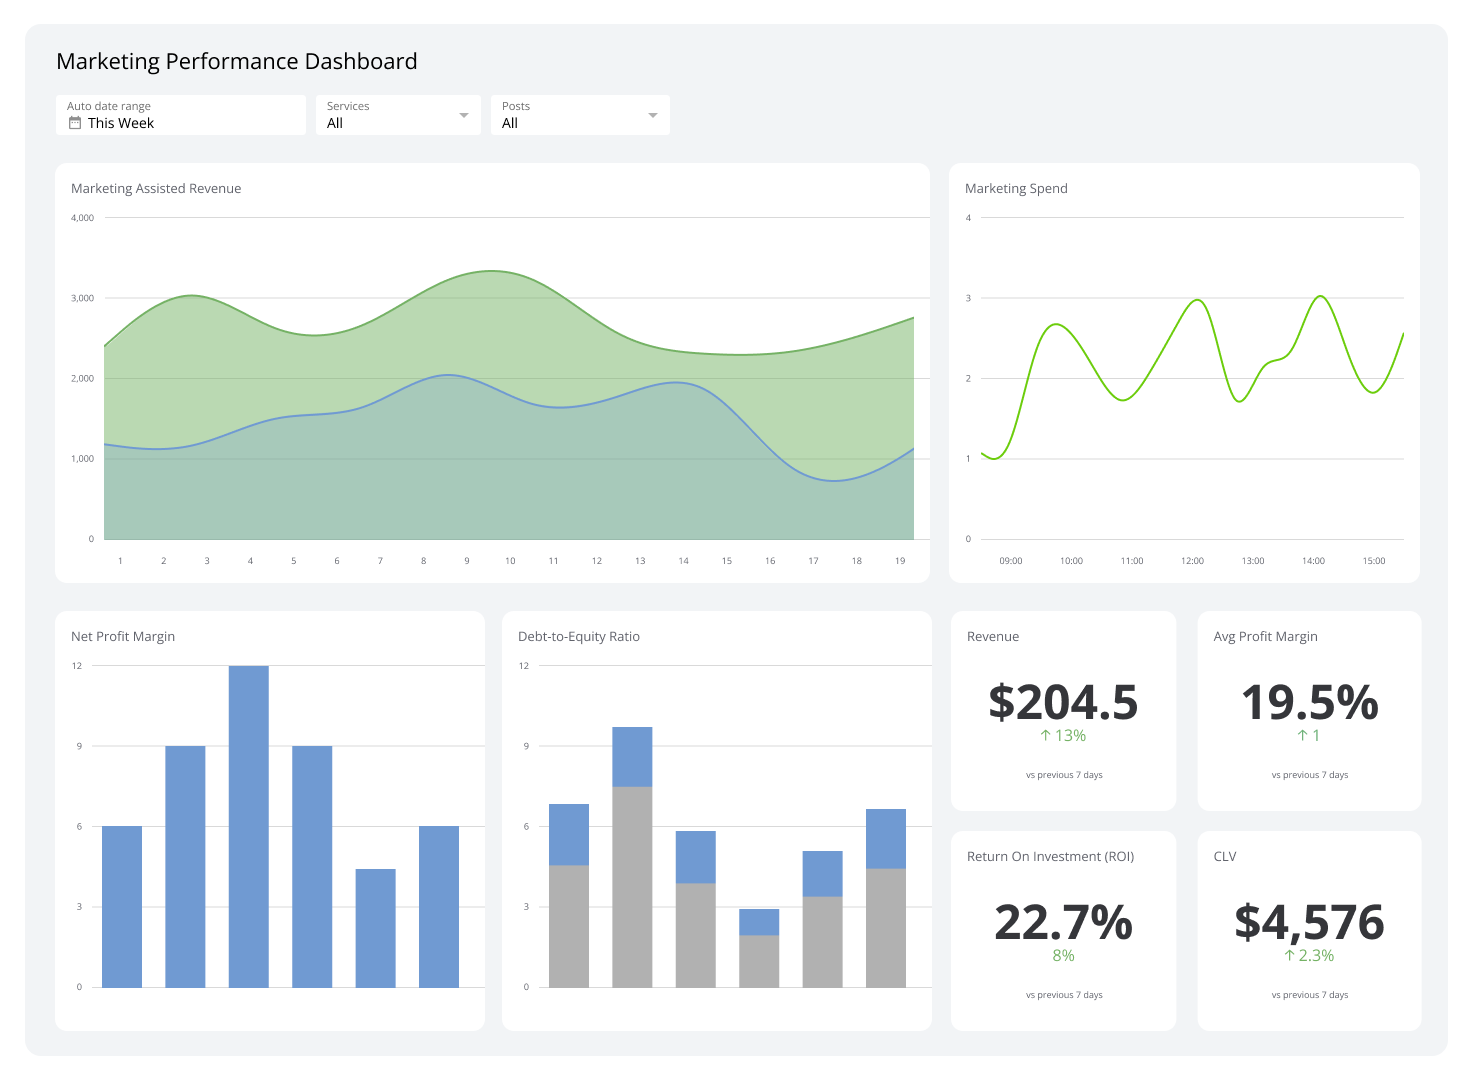
Tracking this number over time means you know when something shifts, not after the quarter closes. You can make confident decisions about pricing, sourcing, and product mix because you're working from a number you trust, not one someone pulled together at the last minute. Monitoring Gross Profit Margin on a financial dashboard alongside related financial KPI examples like Net Profit Margin gives your team a consistent, real-time view of financial health — without anyone having to chase numbers or paste figures into a spreadsheet.
What is a good Gross Profit Margin?
Benchmarks vary significantly by industry. Retail businesses often operate in the 20–50% range, while software and professional services companies frequently exceed 60–70%. The most useful comparison is against your own historical performance and direct competitors, not a universal standard.
If your margin is shrinking quarter over quarter, that's the signal worth acting on — regardless of where it sits relative to an industry average.