Net Profit Margin
Measures how much profit your business generates for every dollar of revenue earned.
Net Profit Margin
What is Net Profit Margin?
Net Profit Margin measures how much profit a business generates for every dollar of revenue earned.
This financial KPI reflects the overall profitability of your business and informs both long- and short-term financial decisions. A strong Net Profit Margin signals that your business controls costs well relative to revenue. A weak margin points to areas where expenses are eroding earnings, and tells you it's time to act.
See also: Gross Profit Margin
Net Profit Margin formula
Net Profit Margin is calculated by dividing net income by total revenue:
Net Profit Margin = Net Income / Total Revenue
Both figures appear on your income statement. Net income is what remains after all expenses, taxes, and interest have been subtracted from total revenue.
Example: If your business earns $500,000 in revenue and reports $75,000 in net income, your Net Profit Margin is 15%.
$75,000 / $500,000 = 0.15 (15%)
Why Net Profit Margin matters
Net Profit Margin tells you more than just whether your business is profitable. It shows how efficiently your business converts revenue into actual profit after accounting for every cost, from operating expenses to taxes.
Knowing your margin means you can make confident decisions about pricing, hiring, and investment, without having to wait for someone to pull the numbers together. Here is why this KPI deserves a place on your financial dashboard:
- Profitability benchmarking: Compare your margin against industry peers to understand where you stand competitively and where you have room to improve.
- Pricing decisions: A declining margin often signals that pricing has not kept pace with rising costs, giving you a clear reason to act.
- Investor confidence: Lenders and investors use Net Profit Margin to evaluate financial health and sustainability before committing capital.
- Cost control: Tracking margin over time surfaces expense trends before they become serious problems.
What is a good Net Profit Margin?
A "good" Net Profit Margin varies significantly by industry. Retail businesses often operate on margins below 5%, while software companies may achieve margins above 20%. The most meaningful benchmark is your own historical trend and your industry average.
Consistently improving your margin over time, even incrementally, signals healthy financial management and gives leadership a reliable foundation for forward-looking decisions.
Create custom dashboards for you and your team.
Get started with KlipsHow to track Net Profit Margin
Manually calculating Net Profit Margin each reporting period is error-prone and time-consuming. It also means your numbers are already out of date by the time they reach the people who need them.
A real-time financial dashboard pulls data directly from your accounting or ERP system, so your margin is always current and visible to the right people without anyone having to chase it down. Instead of pasting figures into a spreadsheet or explaining your financials to an AI tool from scratch each month, you have one reliable number you can trust and act on.
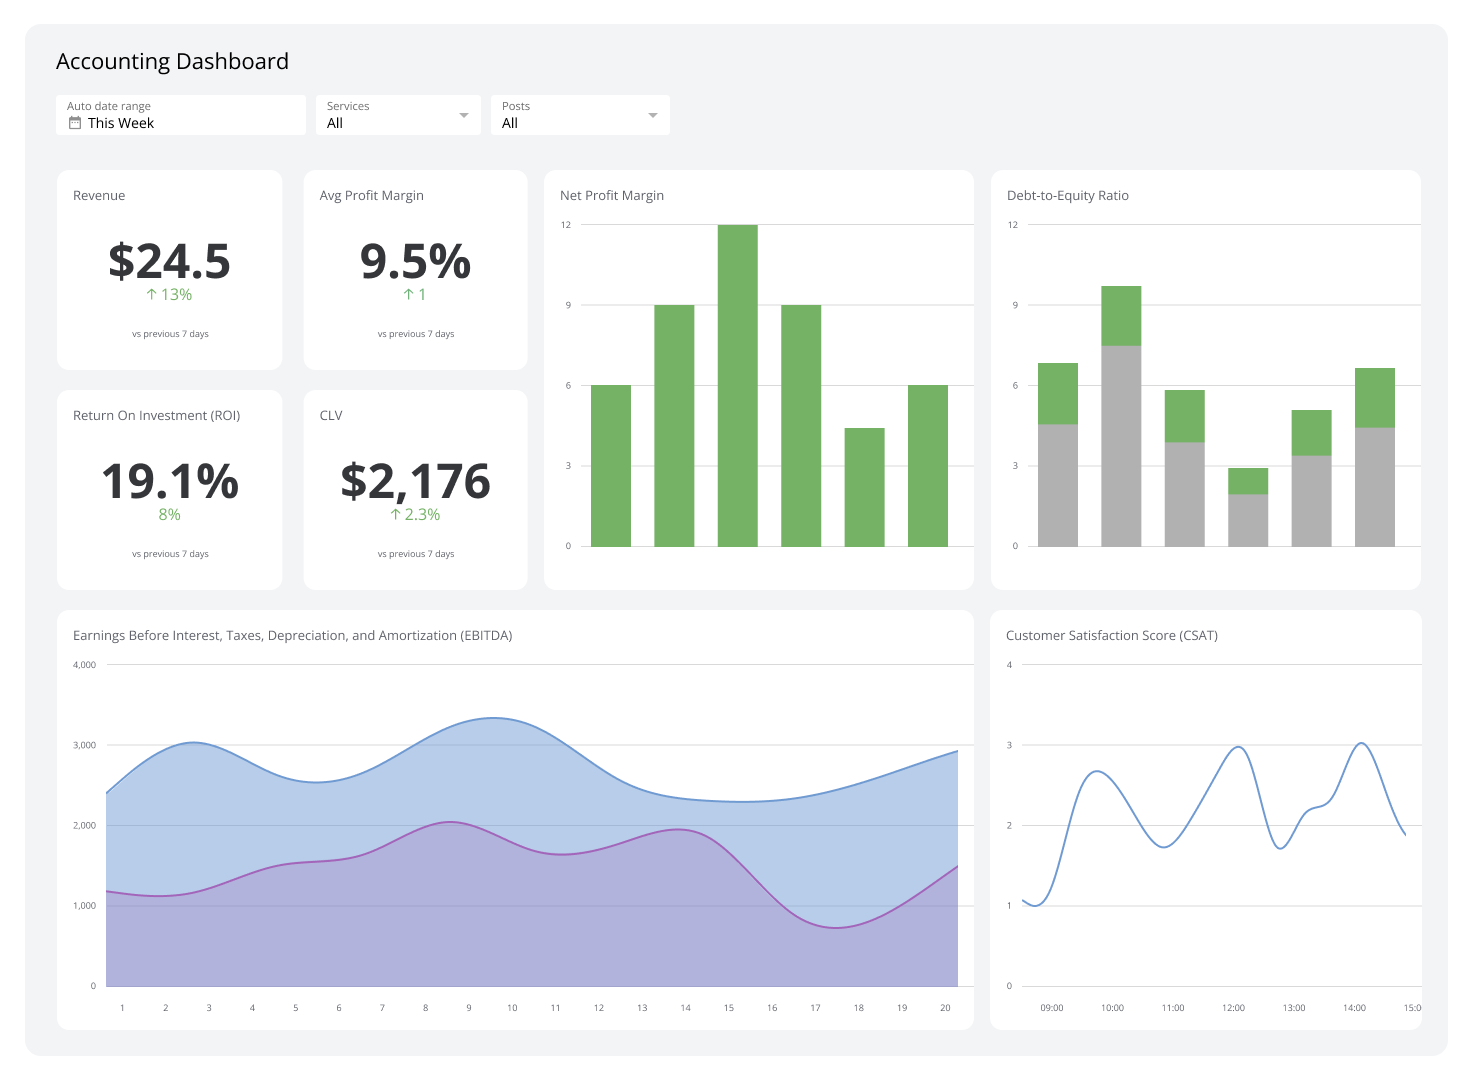
Klips connects to 130+ data sources and lets you build customized financial dashboards that display Net Profit Margin alongside related KPIs like Gross Profit Margin, Revenue, and Net Income. Your team gets a complete picture of financial performance at a glance, and you spend less time gathering data and more time making decisions.