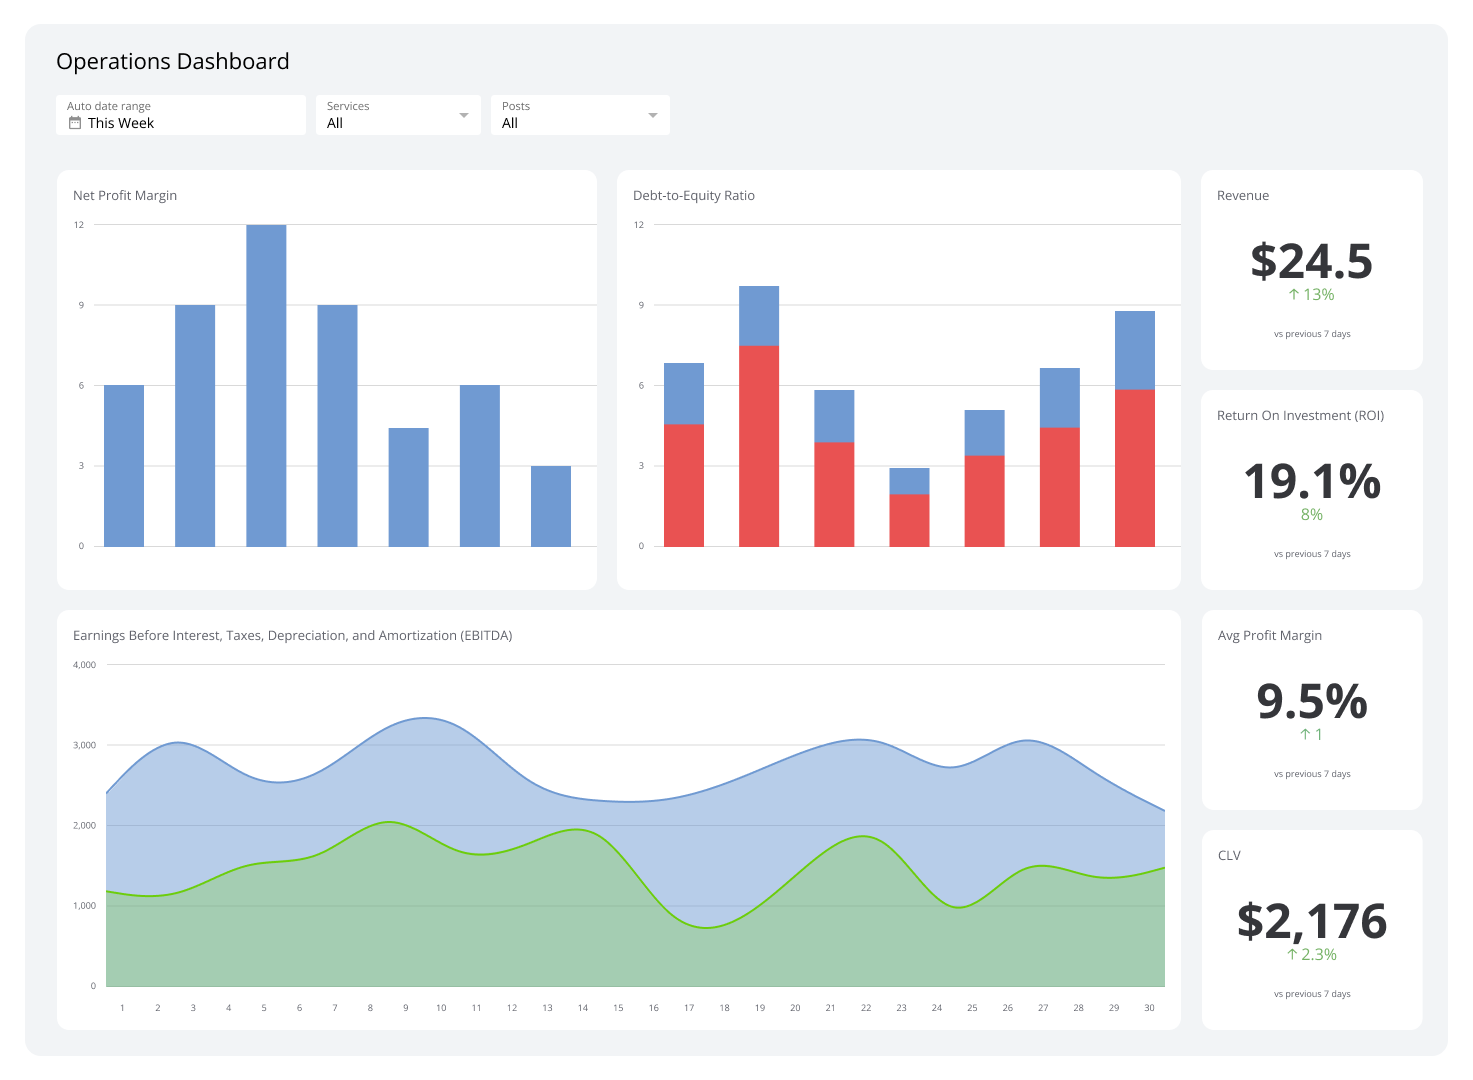
Product Performance Dashboard
See product KPIs in one view so you can make faster, smarter calls.

What is a Product Performance Dashboard?
A Product Performance Dashboard is a single view of your most important product data: sales, margins, return rates, and customer feedback, updated automatically so you always know where things stand.
Think of it as a live report card for your products. Instead of chasing numbers across spreadsheets, app exports, and email threads, you see what's working, what isn't, and where to act.
Why a Product Performance Dashboard matters
Most leaders don't lack product data. They lack a clear, consistent picture of it. Numbers exist in your e-commerce platform, your inventory system, your CRM, but getting to them takes time, and by the time a report lands, the moment to act has passed.
A Product Performance Dashboard changes that. The numbers are there when you need them, pulled automatically, consistent across your team, and organized around the decisions that matter.
Here's what that clarity makes possible:
- Faster decisions: When Sales, margins, and return rates are visible in real time, you don't need to wait for a weekly summary to know whether a product line is on track.
- Consistent numbers: Everyone sees the same data from the same source. No more conflicting figures between the operations team's spreadsheet and the finance report.
- Early warning signals: A spike in return rates or a drop in Customer Lifetime Value shows up before it becomes a costly problem.
- Efficiency: Bottlenecks in production or fulfilment become visible, so you can act before they affect the customer.
Who benefits most from a Product Performance Dashboard?
Leaders and managers at growing companies. If you're accountable for a product line, a category, or a team, this dashboard hands you the clarity you need without requiring you to build or maintain reports yourself.
- Founders and executives: Watch high-level KPIs like Monthly Recurring Revenue, gross margin, and Customer Lifetime Value without waiting for someone to pull a number.
- Product managers: Track feature adoption, engagement, and customer feedback to shape the roadmap with confidence.
- Marketing and sales leaders: Monitor campaign ROI, sales velocity, and Customer Acquisition Cost by product to sharpen your strategy.
Key metrics to track on a Product Performance Dashboard
The right metrics depend on your business model, but a strong Product Performance Dashboard focuses on the numbers that tell you whether a product is healthy and where it needs attention.
Common metrics include:
- Revenue by product: Total sales for each product or category, compared against target and prior periods.
- Gross margin: Revenue minus cost of goods sold, expressed as a percentage. The clearest signal of product profitability.
- Return rate: The percentage of units returned. A rising return rate often signals a quality or expectation issue before it shows up in reviews.
- Customer Acquisition Cost (CAC): What it costs to bring in a customer for a given product. Rising CAC without a matching rise in margin is a warning sign.
- Customer Lifetime Value (CLV): The total revenue a customer generates over time. Paired with CAC, it tells you whether a product is building a sustainable business.
- Units sold and inventory turnover: How quickly product moves. Slow turnover ties up cash; fast turnover with stockouts means missed revenue.
- Customer satisfaction and review scores: Qualitative signals that surface problems before they appear in the financial data.
Product Performance Dashboard examples
Different roles need different views. Below are the most common types and what each one is built to answer.
Create custom dashboards for you and your team.
Get started with KlipsProduct sales dashboard
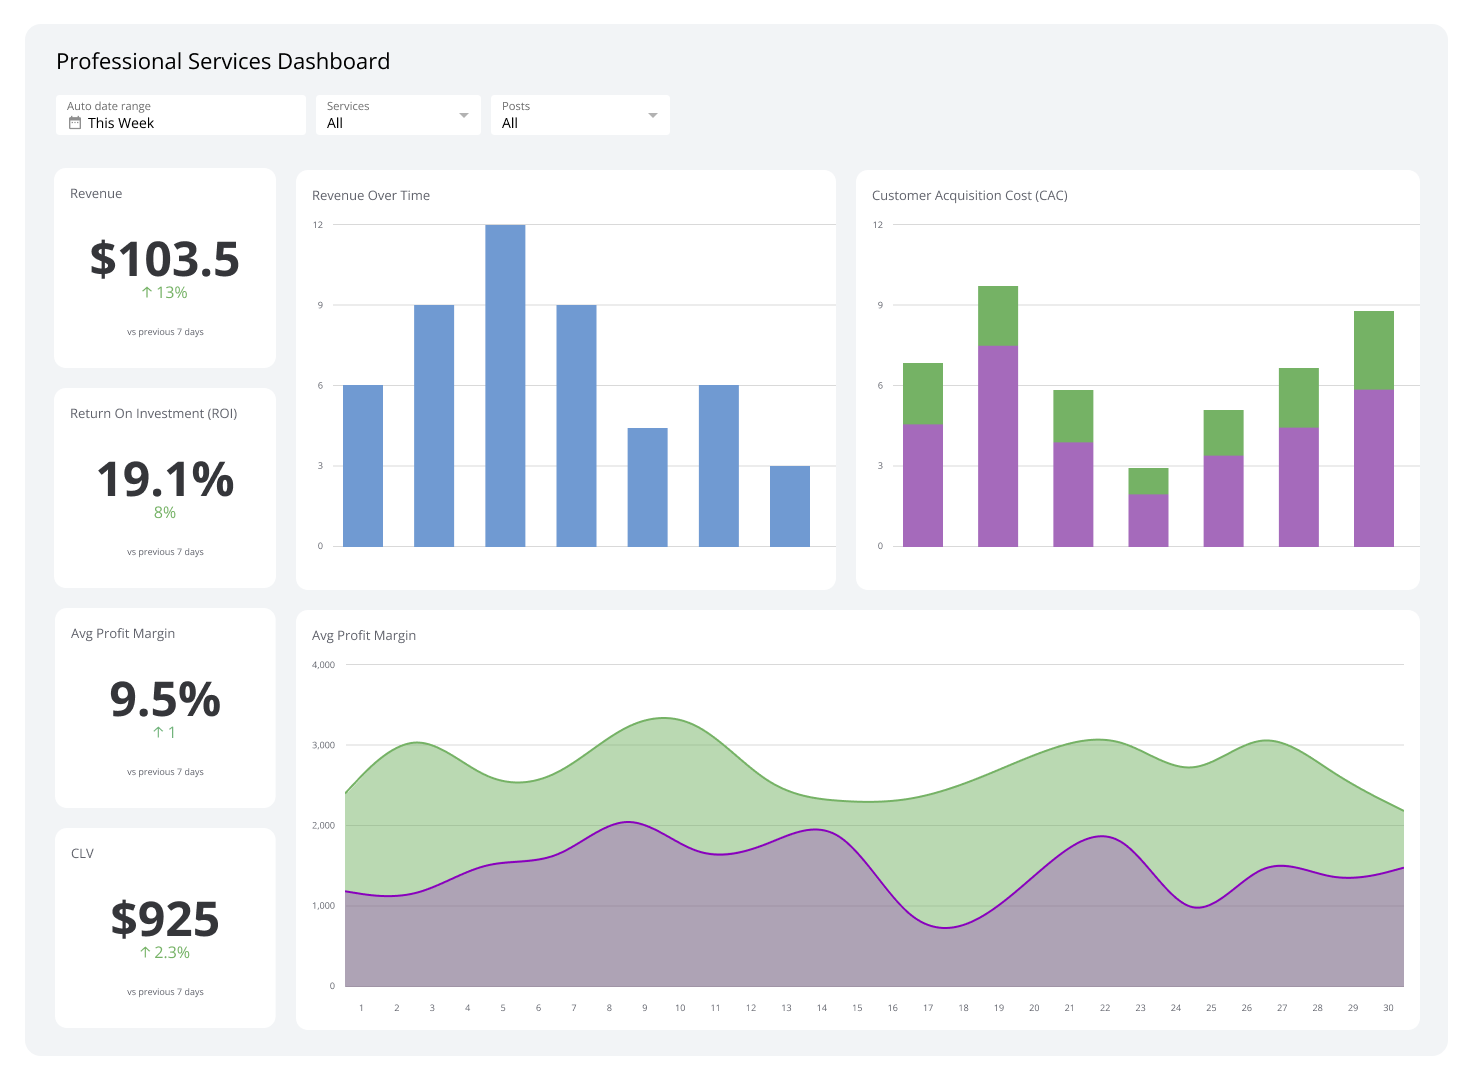
The Product Sales Dashboard tracks revenue, units sold, and Average Order Value by product, category, and time period. It's the view you open to know whether this month is running ahead of or behind last month, and which products are driving the difference.
Product profitability dashboard
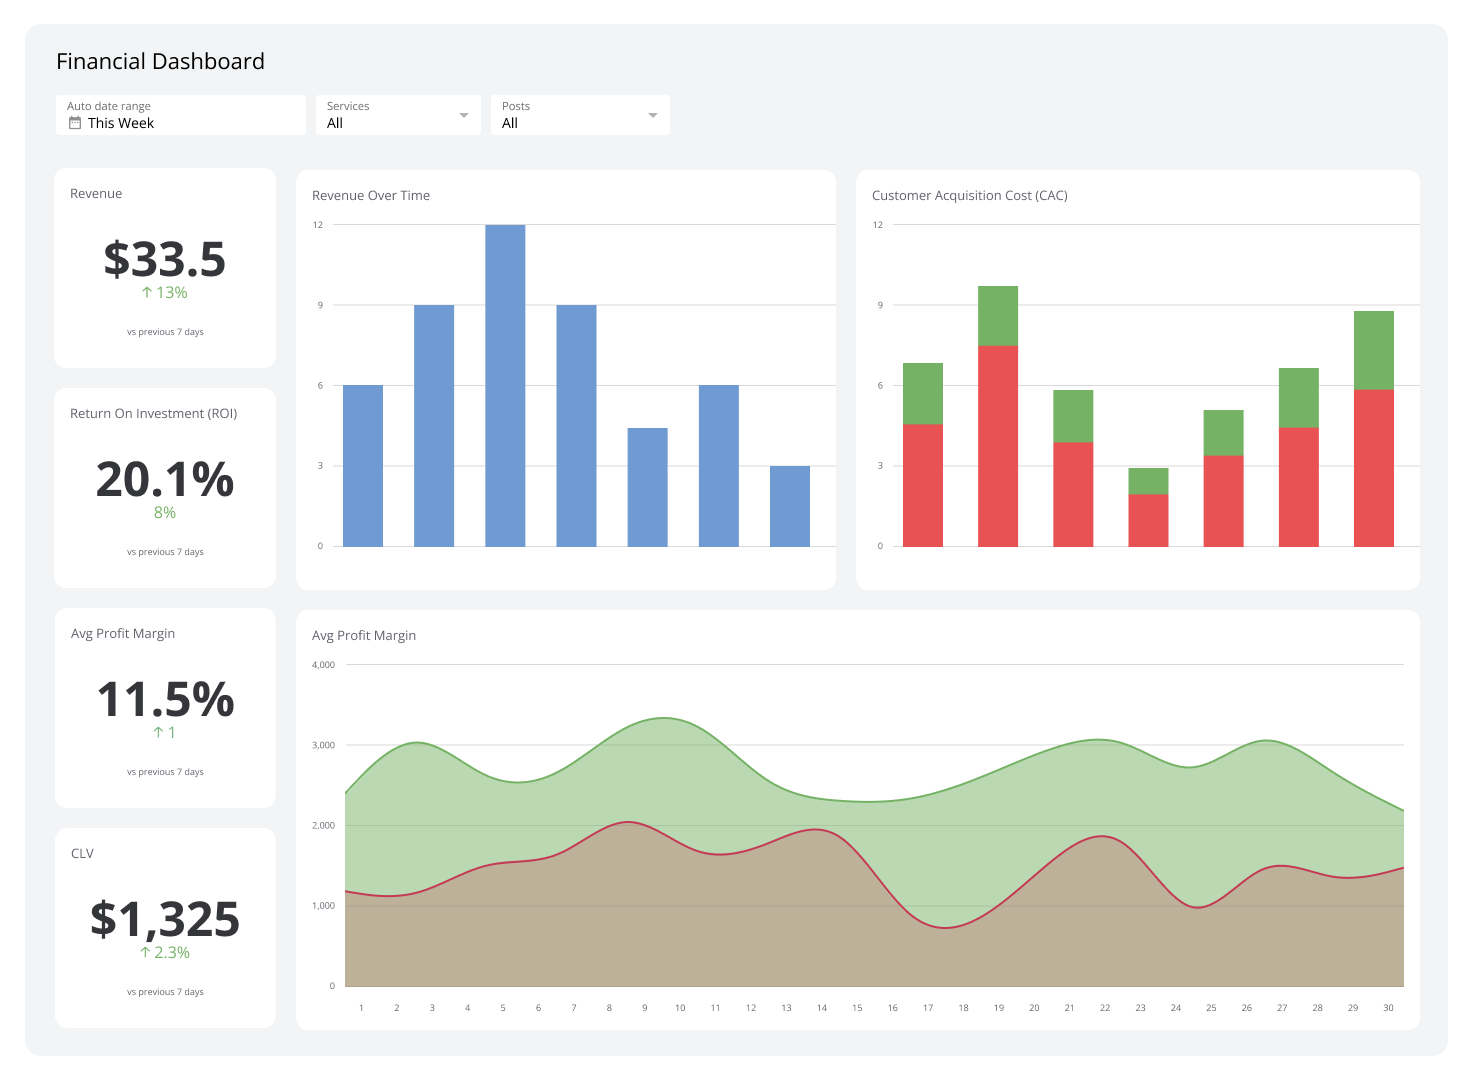
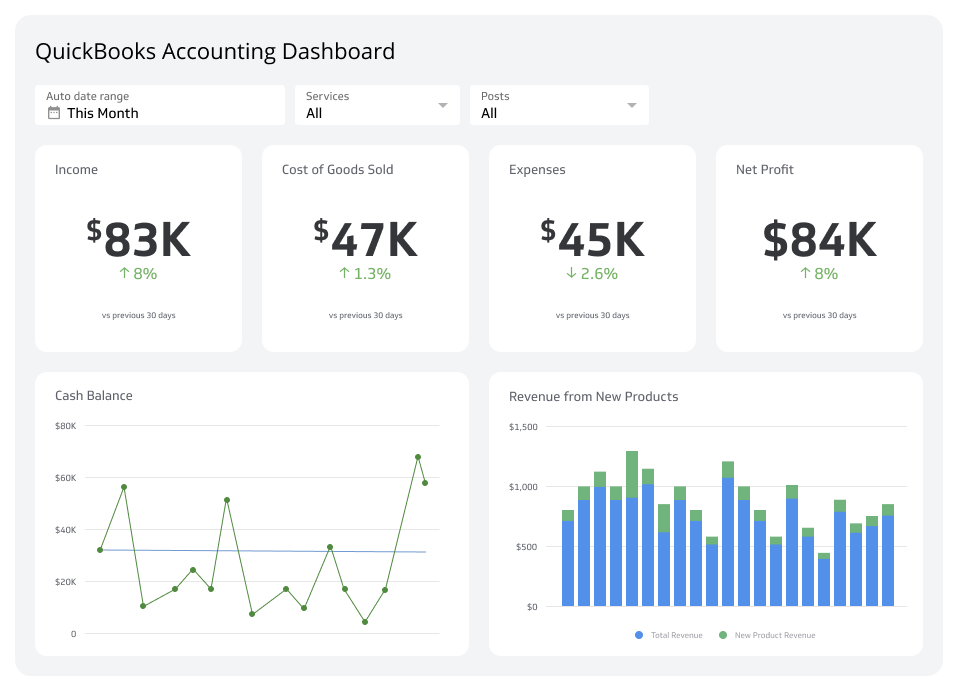
The Product Profitability Dashboard puts gross margin, cost of goods, and net revenue side by side across your product catalogue. It answers the question that revenue alone can't: which products are actually worth selling?
Inventory performance dashboard
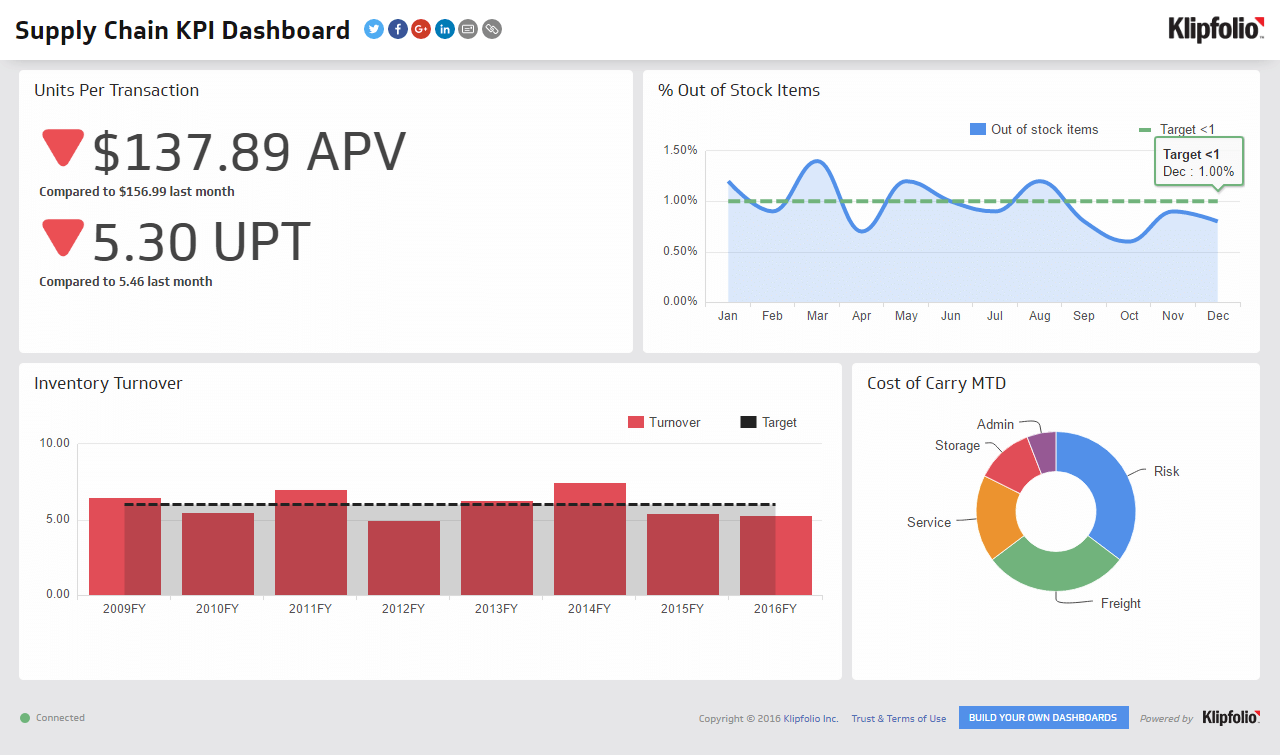
The Inventory Performance Dashboard tracks stock levels, turnover rates, and fulfilment times. It surfaces the products that are tying up capital or running out before you can reorder, so you can make smarter purchasing decisions.
Customer feedback dashboard
The Customer Feedback Dashboard aggregates review scores, return rates, and support ticket volume by product. When a product starts generating complaints, this view catches it early, before it compounds into a reputation or margin problem.
What makes a Product Performance Dashboard effective
A dashboard your team doesn't trust is just a report nobody reads. The difference between one that drives decisions and one that collects dust comes down to a few things.
The data is reliable. If the numbers don't match what your team sees in their own tools, they'll ignore the dashboard and go back to their own spreadsheets. Automatic data pulls from your actual sources, without manual exports or copy-paste, is the foundation.
It shows the right metrics. More metrics isn't better. A dashboard cluttered with every available data point makes it harder to know what to act on. Start with the eight to ten numbers that most directly reflect product health.
It updates automatically. A dashboard you have to manually refresh isn't a dashboard. It's a report. Automatic refreshes mean the numbers reflect what's happening now, not what was true yesterday.
It's visible to the right people. A dashboard buried in a browser tab doesn't drive alignment. The most effective Product Performance Dashboards are shared across the team, displayed on screens, sent as scheduled reports, or embedded where your team already works.
How Klips powers your Product Performance Dashboard
Klips connects to 130+ data sources, including Shopify, QuickBooks, HubSpot, and your inventory and fulfilment tools, so your dashboard pulls live data automatically. You don't need a data team to build it or keep it running.
Klips gives you:
- 130+ connectors to bring in data from your sales, inventory, marketing, and finance tools without manual exports.
- Excel-like formulas to calculate the metrics that matter to your products, not just the defaults your platforms provide.
- Flexible distribution to share dashboards with your team via email, TV mode, embedded views, or scheduled reports, so the right people always have the right numbers.
- Granular permissions to control who sees what, whether you're sharing with a product team, an executive, or a client.
The result is a Product Performance Dashboard your team actually uses, because the numbers are there, they're right, and they don't require anyone to go digging.
Try Klips free and see your product performance in one place.