

Summary - Metrics are a forcing function to unify business decisions. When metrics are shared and consumed across the business, you establish a reporting structure and framework that everyone turns to as a single source of truth for business decisions.
When you hear the word metrics, what is the first thing that comes to mind? Is it a system of measurement? Is it building blocks? Is it overwhelming-amounts-of-business-data?
In a business context, metrics are a forcing function to unify business decisions. Many companies report on business metrics in an ad-hoc or siloed approach. But your metrics, when shared and consumed across the business, help you establish a reporting structure and framework so that everyone can turn to a single source of truth for business decisions.
This starter guide to metrics is meant to be your one-stop-shop for all of your metrics questions. In this guide, I’ll cover:
- What are metrics?
- How do you use metrics?
- How do I know which metrics to track?
- What are the components of a metric?
- Where do you track all of these metrics?
Let’s get started.
What are metrics?
Whether you’re tracking critical business metrics or your move minutes on your Apple Watch, we’re inundated with metrics and data across our personal and professional lives every day.
Metrics are indicators: performance, success (or failure, but I’m a glass-half-full type of gal), productivity and areas for improvement.
Metrics as a concept are one-size-fits-all—everyone should track metrics. Where metrics diverge is that the set of metrics you track depends on your unique position or goals, and what stage you’re at in reaching them.
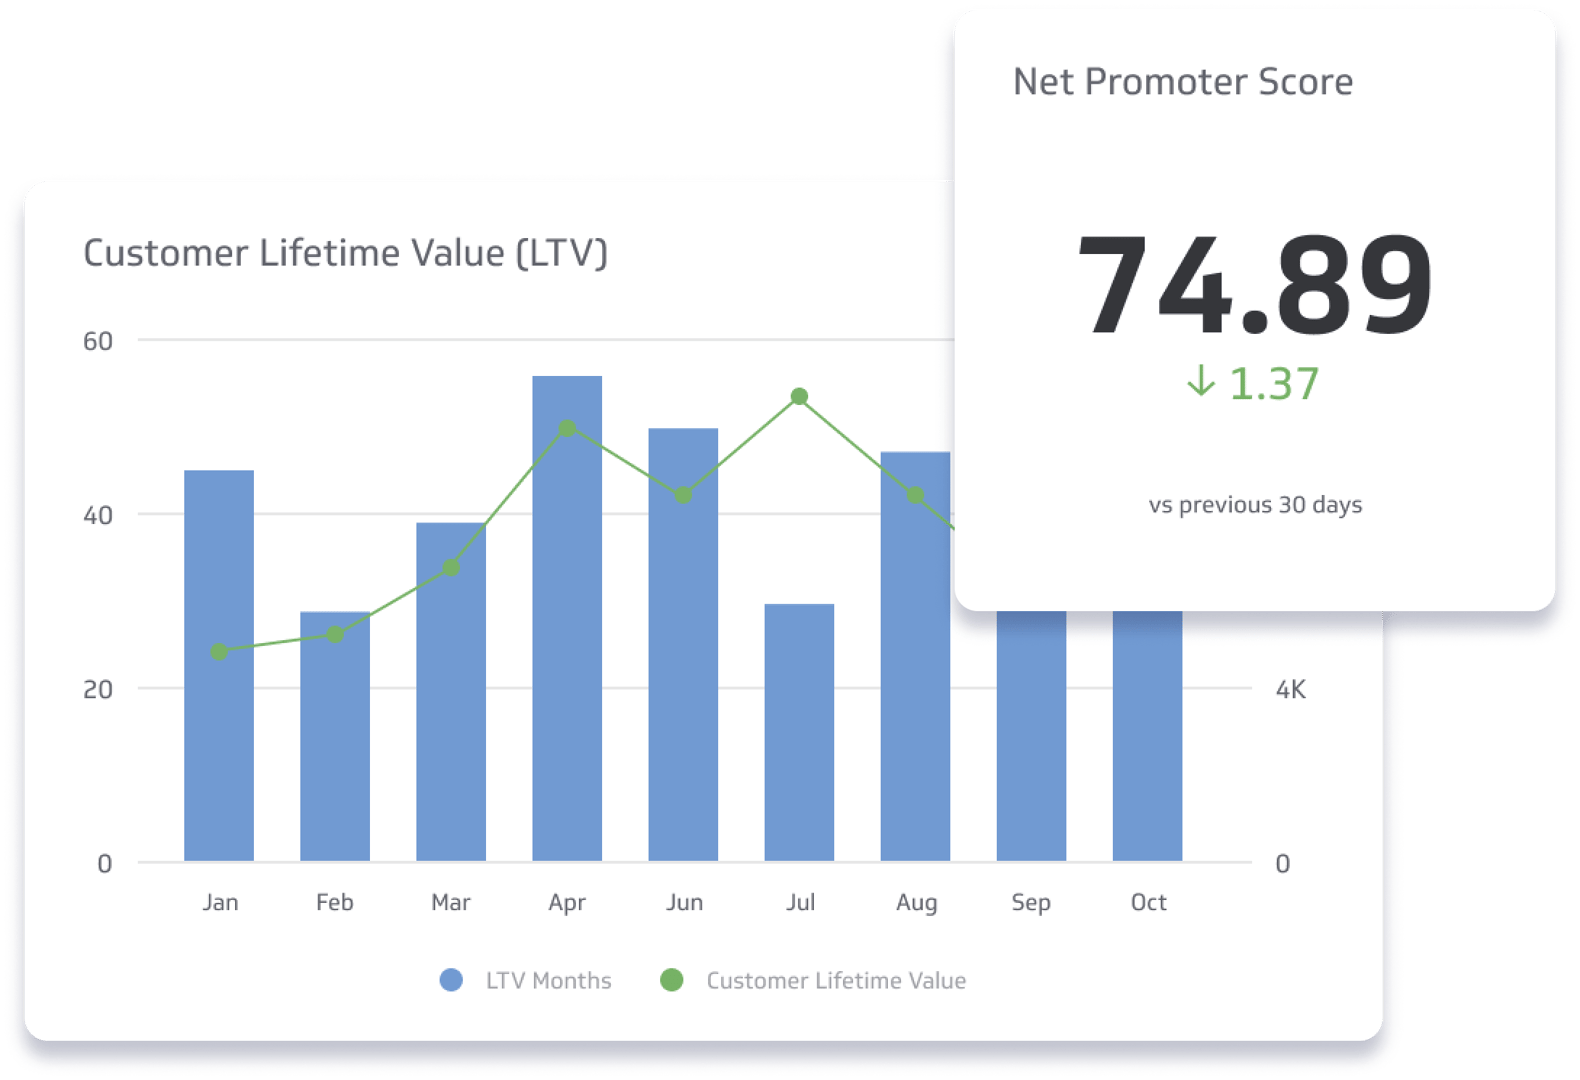
For example, a high-level SaaS executive may focus on monthly recurring revenue (MRR) or customer lifetime value (LTV) and a marketing manager may focus on customer conversion rate or marketing qualified leads (MQLs).
What’s the difference between a metric and a KPI?
You may have heard people use metrics and KPIs interchangeably, but there are differences that are worth touching on.
- KPIs have to have a target and a timeframe
- Metrics are the units of measurement used in KPIs
- All KPIs have a metric associated with them
- Metrics can measure anything for general improvement and performance
- KPIs are metrics with targets and timelines that inspire immediate action
For a deep dive on KPIs, here’s a great resource.
How do you use metrics?
Now that we have an understanding of what metrics are, let’s consider how we use metrics. You can use metrics across any part of your business as a quantifiable way to gauge performance.
At their core, metrics transform your raw data (numbers in a spreadsheet) into something consumable that can be understood by everyone. Most metrics require data calculations and formulas to create the output.
To be used effectively, metrics need to be standardized. For example, if you have a metric that displays data during a 30 day time period, it’s important that your next metric also has the same time period associated with it. Why? If you think of metrics like building blocks, when you combine a standardized set of metrics together, you can build a rich analytics and reporting system.
Cross-functionally, metrics:
- Act as a system or record and single source of truth for your business
- Foster a data-driven culture that encourages informed and controlled decision-making
- Drive strategic and tactical decisions with data
How do I know which metrics to track?
The metrics you track will depend on your business objectives, role, and KPIs. Everyone in your business should be tracking metrics, whether it’s independently or departmentally.
Not sure where to start? Here are the top 5 metrics for each department.
Finance
Finance teams work closely with your most important business data. Measure the right metrics to guide your growth and achieve company milestones.
Here are 5 finance metrics to track:
Marketing
Marketing is a data-driven practice. Between email campaigns, search and display ads, and content creation and distribution, there is no shortage of available data.
Here are 5 marketing metrics to track:
Sales
Sales teams are busy talking to prospects and closing deals. But like many others, they’re using data to guide their decisions and determine their next course of action.
Here are 5 sales metrics to track:
Product Management
Product managers and their teams want to deliver a differentiated product that addresses market needs and represents a viable business opportunity. A key part of the role is measuring the metrics that support the product, and company’s, overall goals and strategy.
Here are 5 product management metrics to track:
What are the components of a metric?
Metrics are objects and are system agnostic. If you think of metrics like building blocks, you can start to stack them together to tell the full story of your business in a system that works for you.
Of course, we recommend PowerMetrics. When you add your metrics to a dashboard tool like PowerMetrics, you are exposed to a number of components that enhance the reporting and analysis you can do.
So, what are the components of a metric?
Your Data
You can’t create a metric with the required data. You can automate data retrieval from a database, cloud drive, API, or connect to a spreadsheet. When you automate your data retrieval, it means your metrics are always showing current data that you can use for analysis or decision-making.
Visualizations
Once you’ve transformed your data into a metric, you can turn it into a data visualization for easy consumption. While metrics can be transformed into almost any data visualization, it’s important to select the right data visualization style to get the insights you’re looking for. (Check out the Starter Guide to Data Visualizations for more on this!)
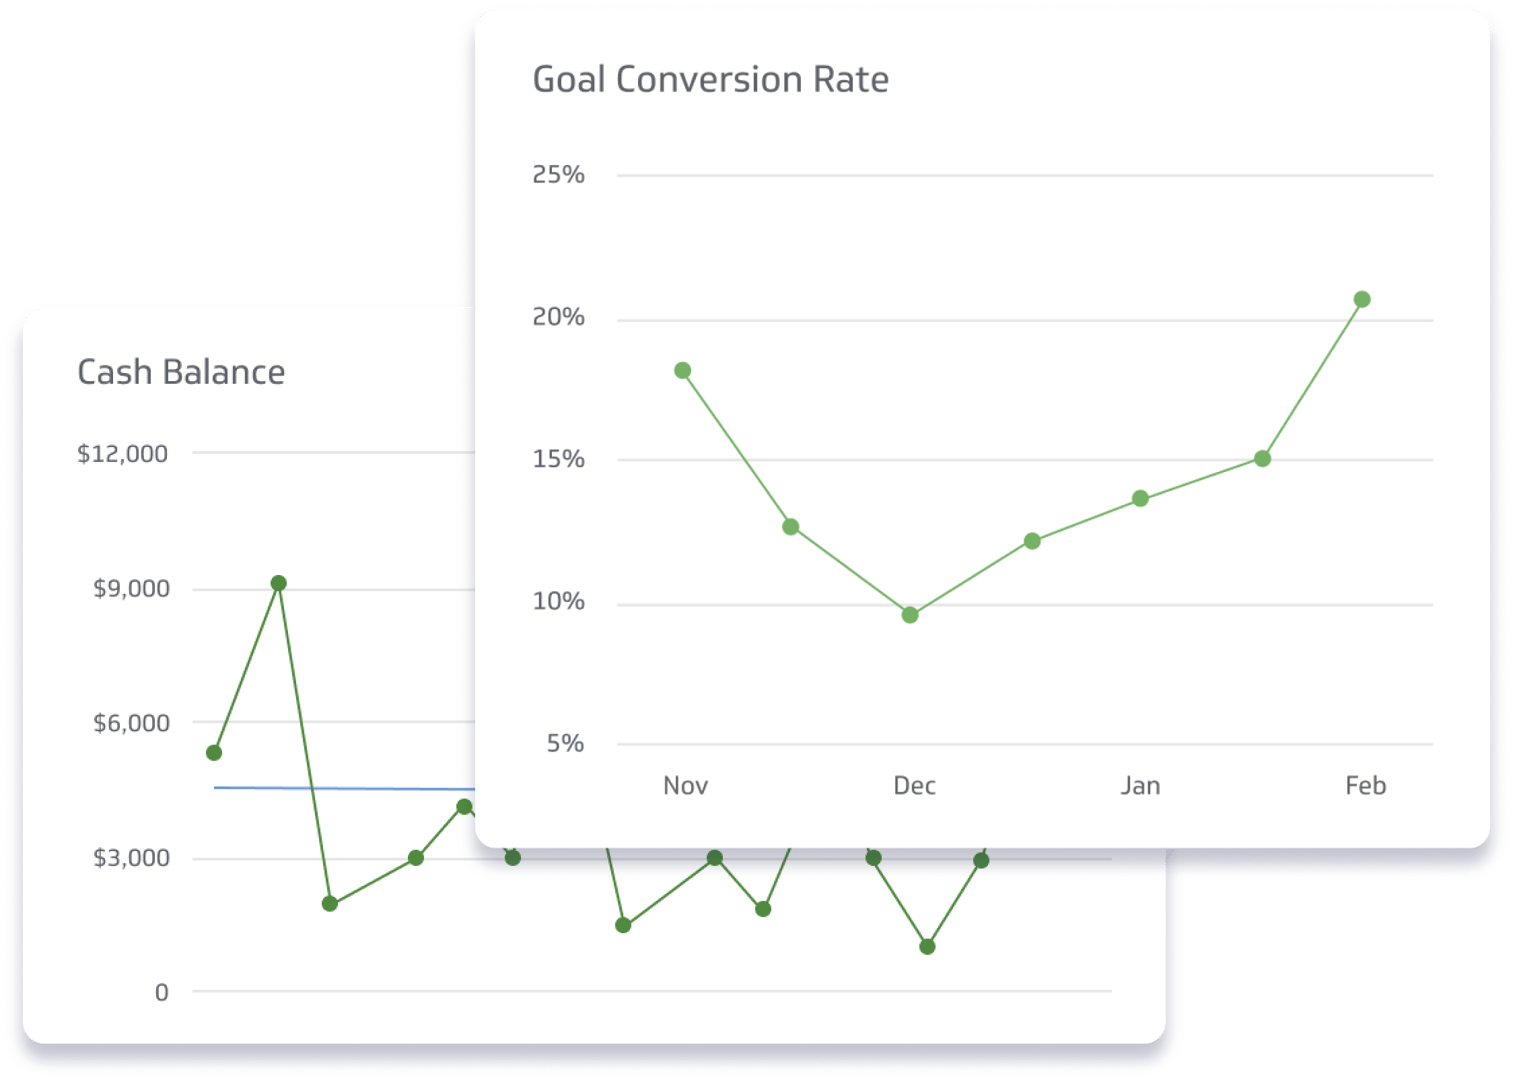
For example, you can use a line chart to track trends like MRR over time versus a donut chart to see revenue distribution by industry.
Data History
Data changes over time, and those changes are what help you identify trends. When you create a metric, rich data history enables you to do quick comparisons across time periods. And, when you standardize all metrics across a common timeframe, it allows for easy comparison and further data discovery, like creating calculated metrics.
Goals and Notifications
No one ever hit a target in a spreadsheet! When you create a metric you can add a goal. Goals give metrics context for you and your team.
There are two goal types available in PowerMetrics: recurring and threshold. Recurring goals track your progress towards a target based on a time period. Threshold goals show you how close you are to achieving your goals.
Goals act as an alert system so you know if your metrics are trending up or down and can solve a business problem in real time.
Dashboards and Reports
Now that you’ve got a rich library of metrics, you can bring them all together to create dashboards and reports. Dashboards give you the power to share insights and show the story of your data. There are key points to keep in mind when you design a dashboard to ensure they are effective and your entire team finds value and insights in each. Check out the guide to dashboard design for more tips and tricks!
How do you track all of these metrics?
There’s a tool for that! Data in a spreadsheet can only take you so far. So once you transform that data into metrics, you start to piece your story together. Where your story finds its beginning, middle, and end, is when you put your metrics on a dashboard.
PowerMetrics is the BI tool for this. With the ability to get started with instant metrics and dive deeper with custom and calculated metrics, PowerMetrics enables you to build the metrics you and your business need to make better decisions -- and then put them on a dashboard.
Related Articles

5 tips to understand (and organize) your restaurant data
By Saleem Khatri — June 9th, 2026
10 Cloud BI Dashboard Tools for Small Businesses in 2026

6 dashboards I use daily to run my SaaS company
By Allan Wille, Co-Founder — April 10th, 2026
