
Summary - Data requires cleansing, normalization, and standardization to be business user ready. And those business users – executives, directors, managers, and individual contributors – aren’t after ‘data,’ they are after insights. PowerMetrics takes a "metrics-first" approach to data and reporting. One of the benefits of this approach is to be able to easily perform calculations by combining metrics. This article will walk you through the process of creating calculated metrics in PowerMetrics.
Data can be messy. Sometimes, a simple question results in a complex, winding path – along the way, we lose sight of the answer we are seeking. Data scientists are known to joke that 80% of their time is spent cleaning data and 20% of their time complaining about data cleansing.
There is truth to that statement. Data requires cleansing, normalization, and standardization to be business user ready. And those business users – executives, directors, managers, and individual contributors – aren’t after ‘data.’ They are after insights.
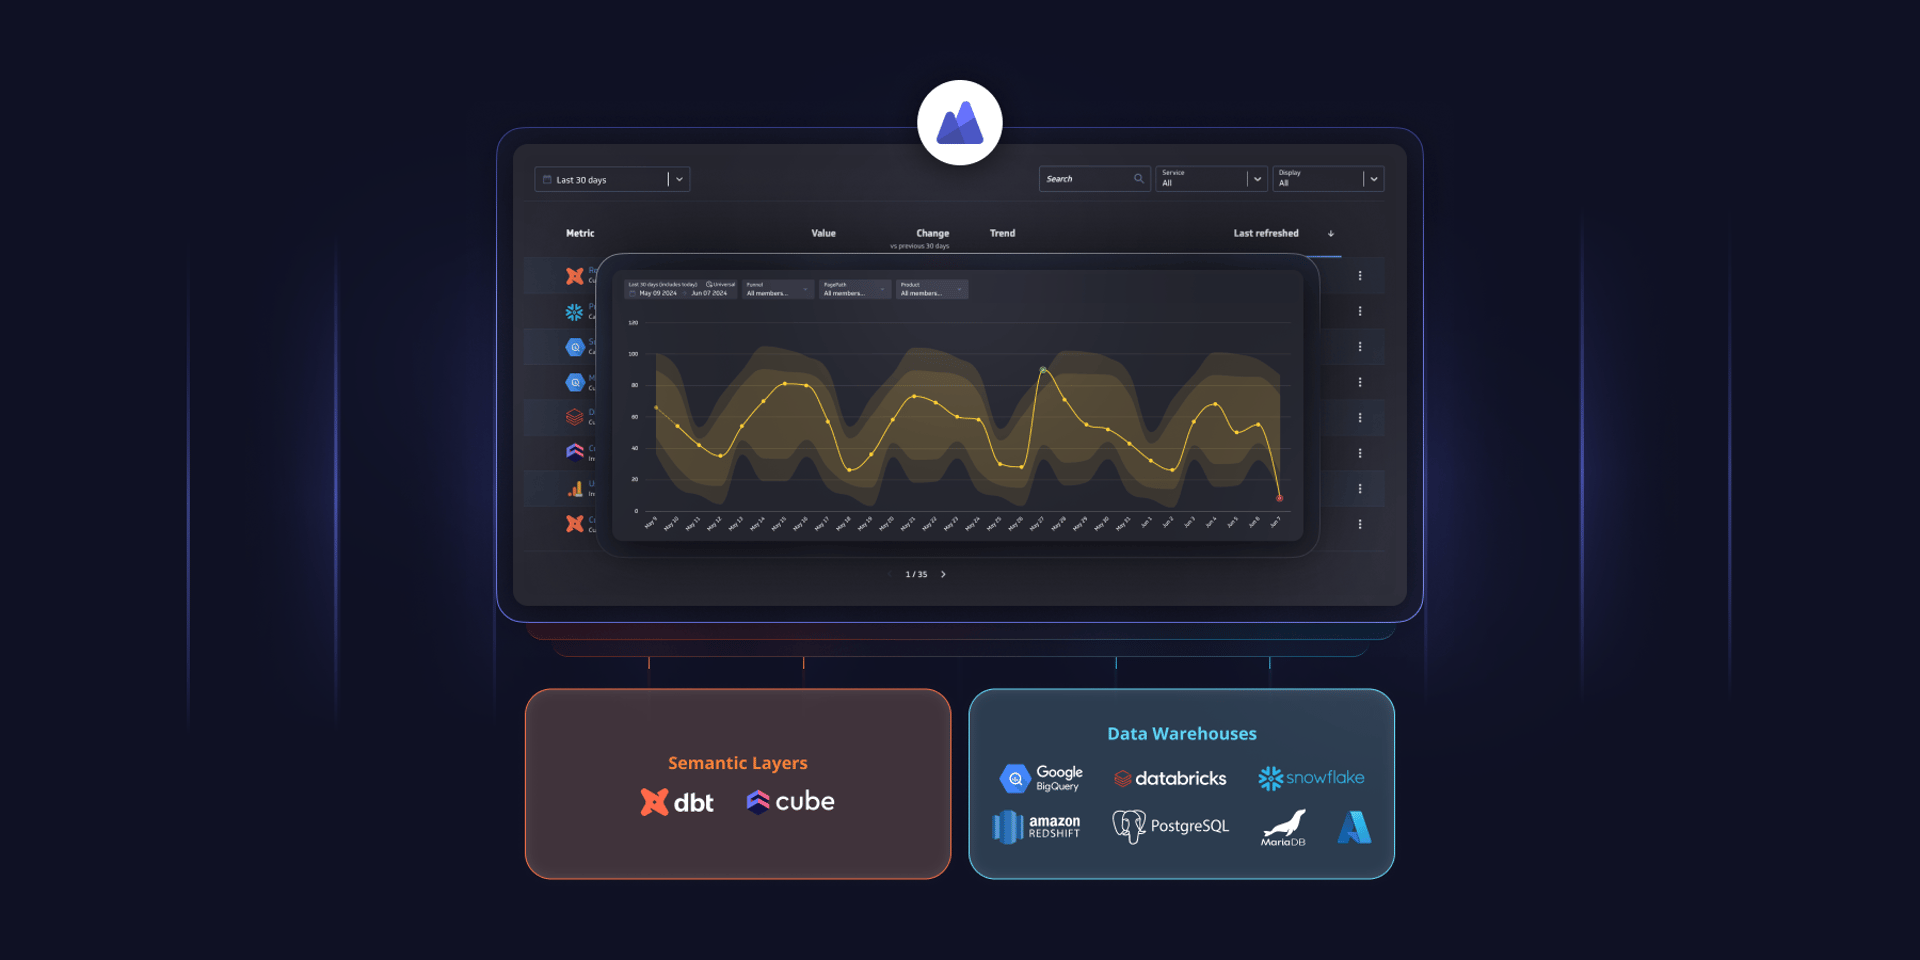
PowerMetrics takes a "metrics-first" approach to data and reporting. All metrics in PowerMetrics are standardized objects and uniformly formatted. As an example, all metrics have the ability to store data history even if the underlying data source doesn't provide any historical data. This allows for apples-to-apples comparison regardless of the underlying shape of the data source itself.
For example, when you extract Instagram Followers from the Instagram Business API, it is returned as a current value without a date range. The API doesn’t provide historical context. When you create an Instagram Business Followers metric in PowerMetrics, we ingest that data and use data history to store that value over time. We start storing your Instagram Followers' data history the day you create your metric.
If the data history is available by default from a service, PowerMetrics makes the most of that data and displays your history based on what is available from your data source.
Data history allows you to compare two metrics over the same time period or create calculated metrics.
Metrics are building blocks
Metrics are building blocks for your analytics. Each metric is built using a data source, but a data source can take many different forms. This is where the value of standardized metrics comes into play. When your metrics are standardized, they will ‘play well with others’, so to speak.
You might run into this in your day-to-day business reporting. Some of the most important metrics you’ll monitor use multiple metrics in a calculation. For example, you need to have your Customer Acquisition Cost (CAC) and Lifetime Value (LTV) in order to calculate your CAC:LTV ratio. In marketing, almost all your key conversion ratios are calculated using metrics derived from different services – such as using Google Analytics and HubSpot data to calculate your Session to Lead conversion rate.
While the shape of the data itself changes over time, our approach uses a dynamic, standardized model to update, store, and compare your data. This means that the underlying data in your metrics, regardless of the data source, work together to give you the insights you need to make better business decisions.
Let’s take a deeper look at calculated metrics in PowerMetrics.
Creating calculated metrics in PowerMetrics
To create a calculated metric, you first need to create individual metrics in your PowerMetrics account. If you’re not sure where to start, check out MetricHQ and browse the services which currently support instant metrics. All you need to get started with instant metrics is your login credentials and a few minutes to decide what to track.
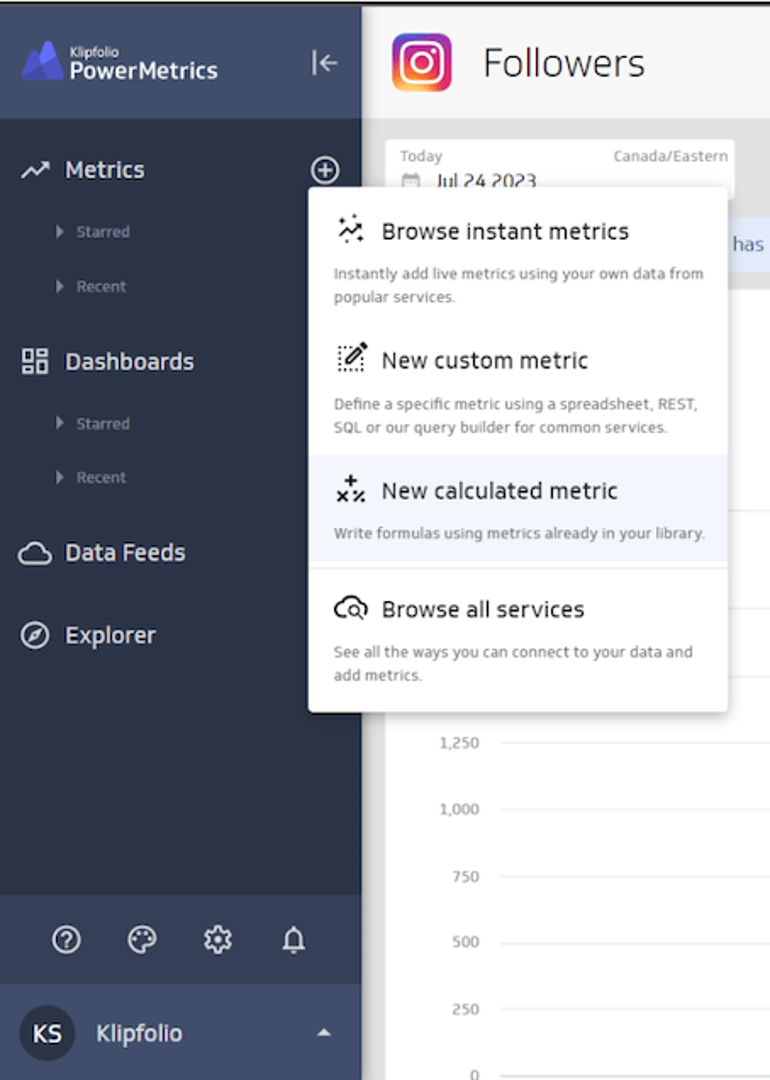
The process of creating a calculated metric is simple and straightforward. To start, In the left navigation sidebar click the + button beside Metrics and select New calculated metric.
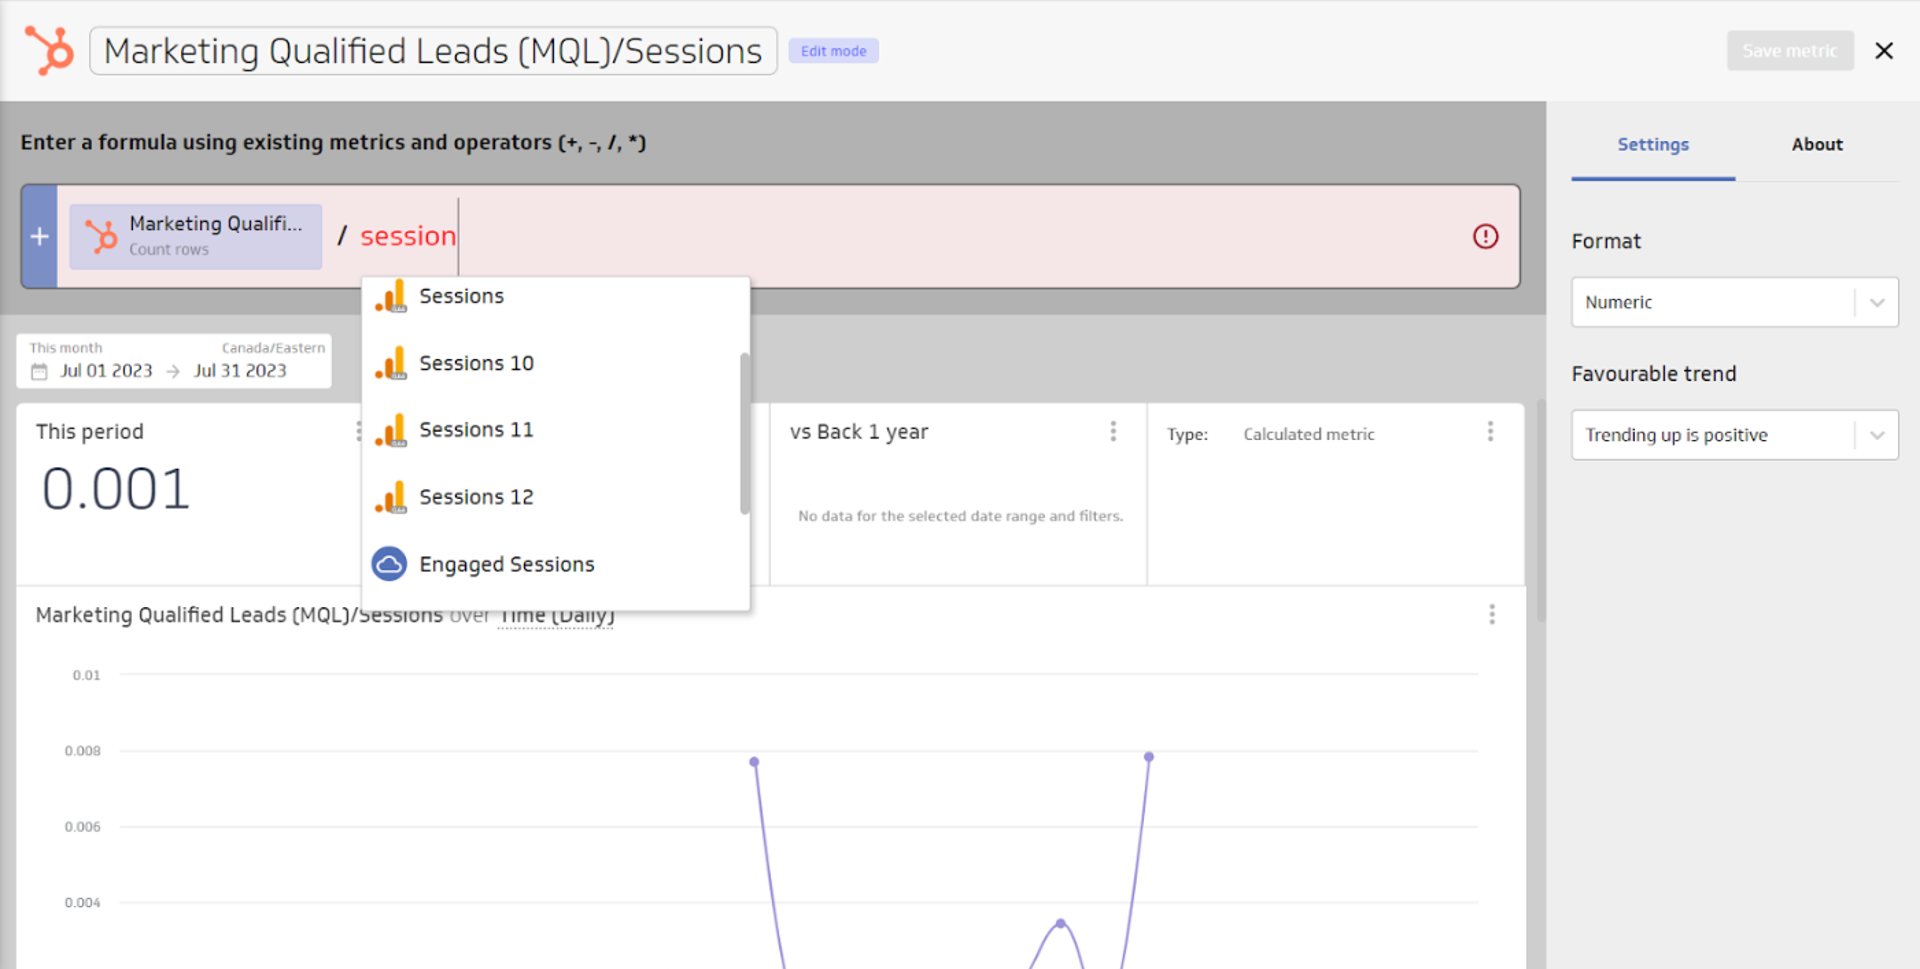
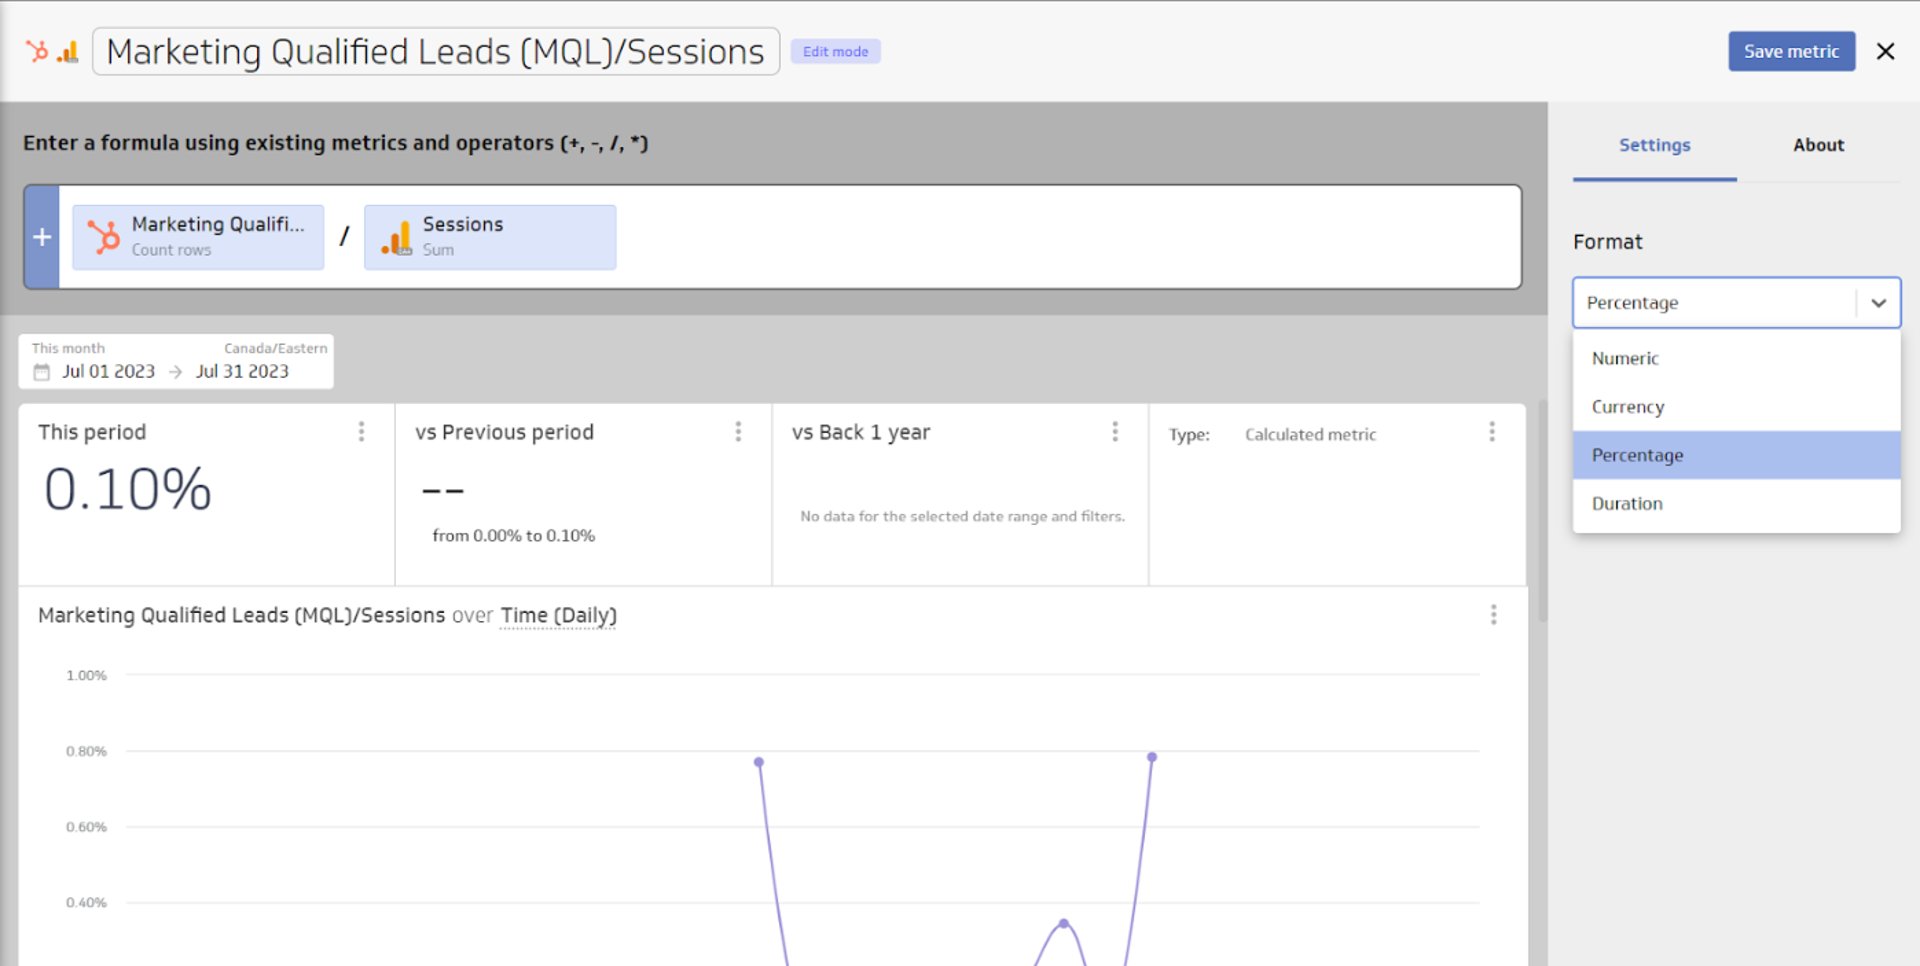
Next, you will be brought to the formula screen, where you will be able to select a metric you have already created. In this example, I’m building a Sessions to MQL conversion rate.
What’s worth noting is that you can choose to filter data in the metric by dimension. In the image below, you could exclude (Other) Sessions or only include Organic Sessions. Common dimensions are included by default and available for exploration in the Metric Explore view. No coding or joins are required.
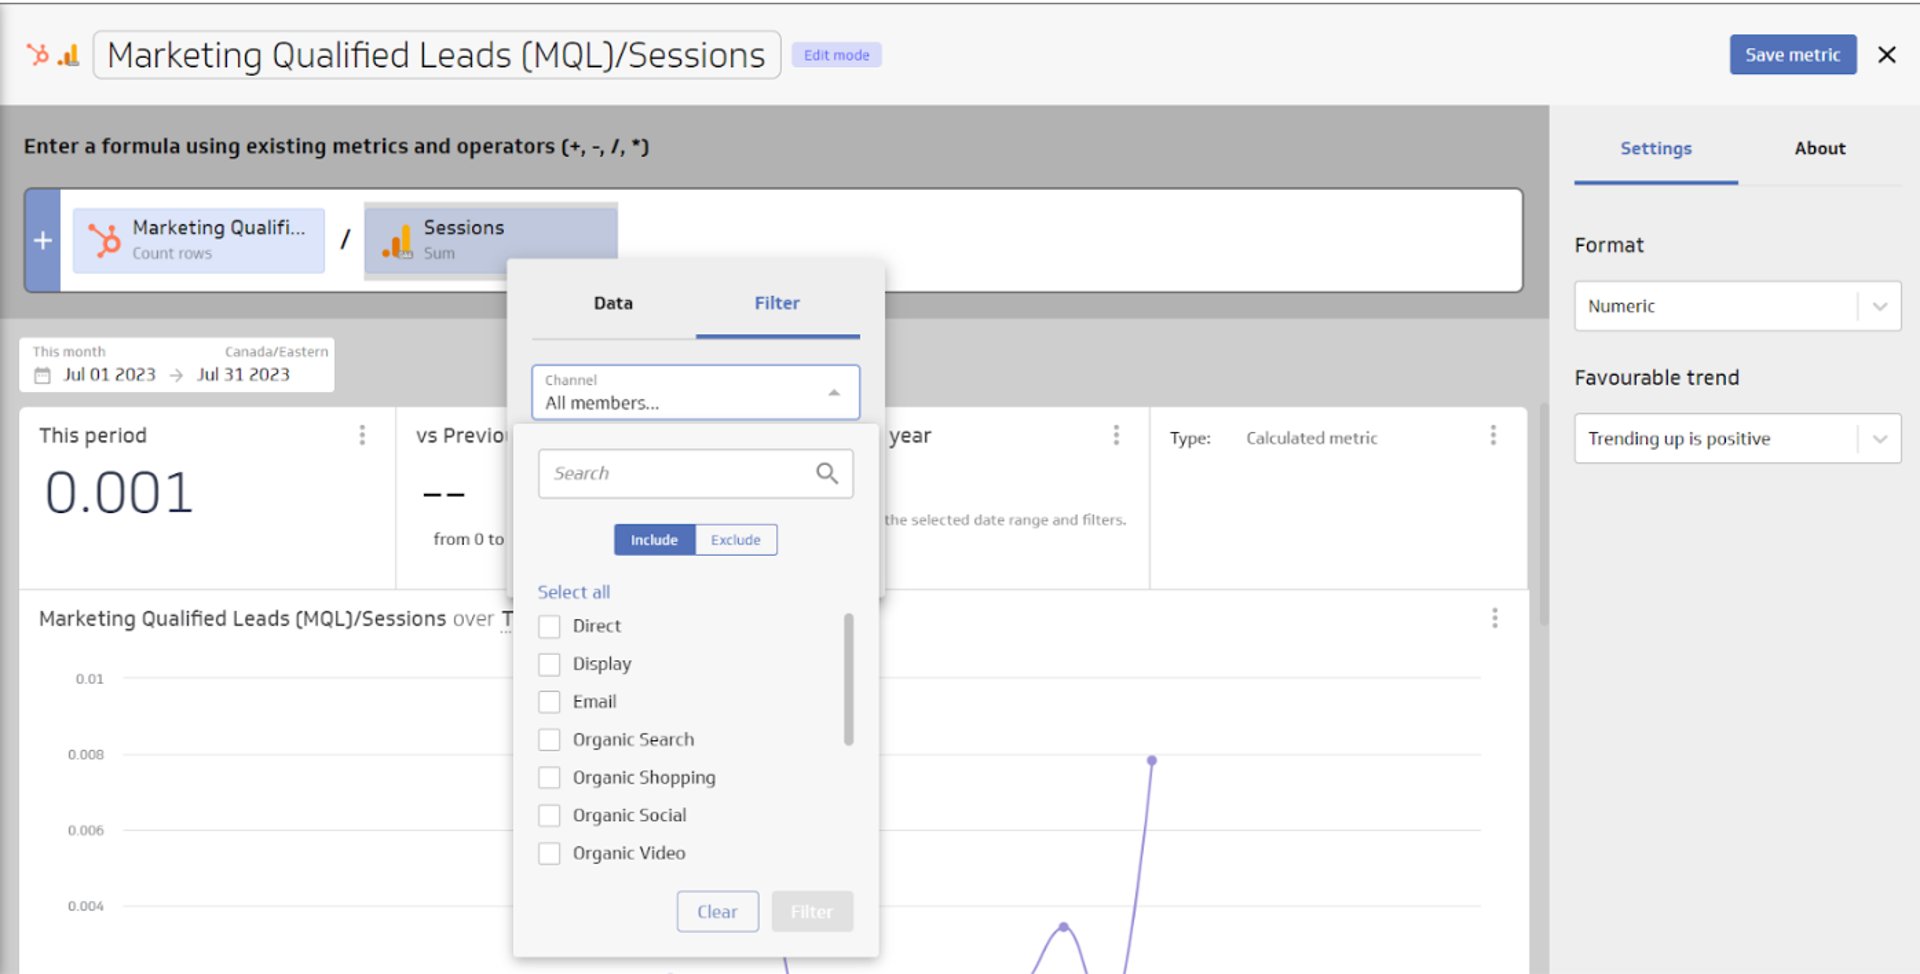
You will also need to select your display options to ensure the metric is properly rendered. In my example, I want to display the value as a percentage.
Operators for calculated metrics
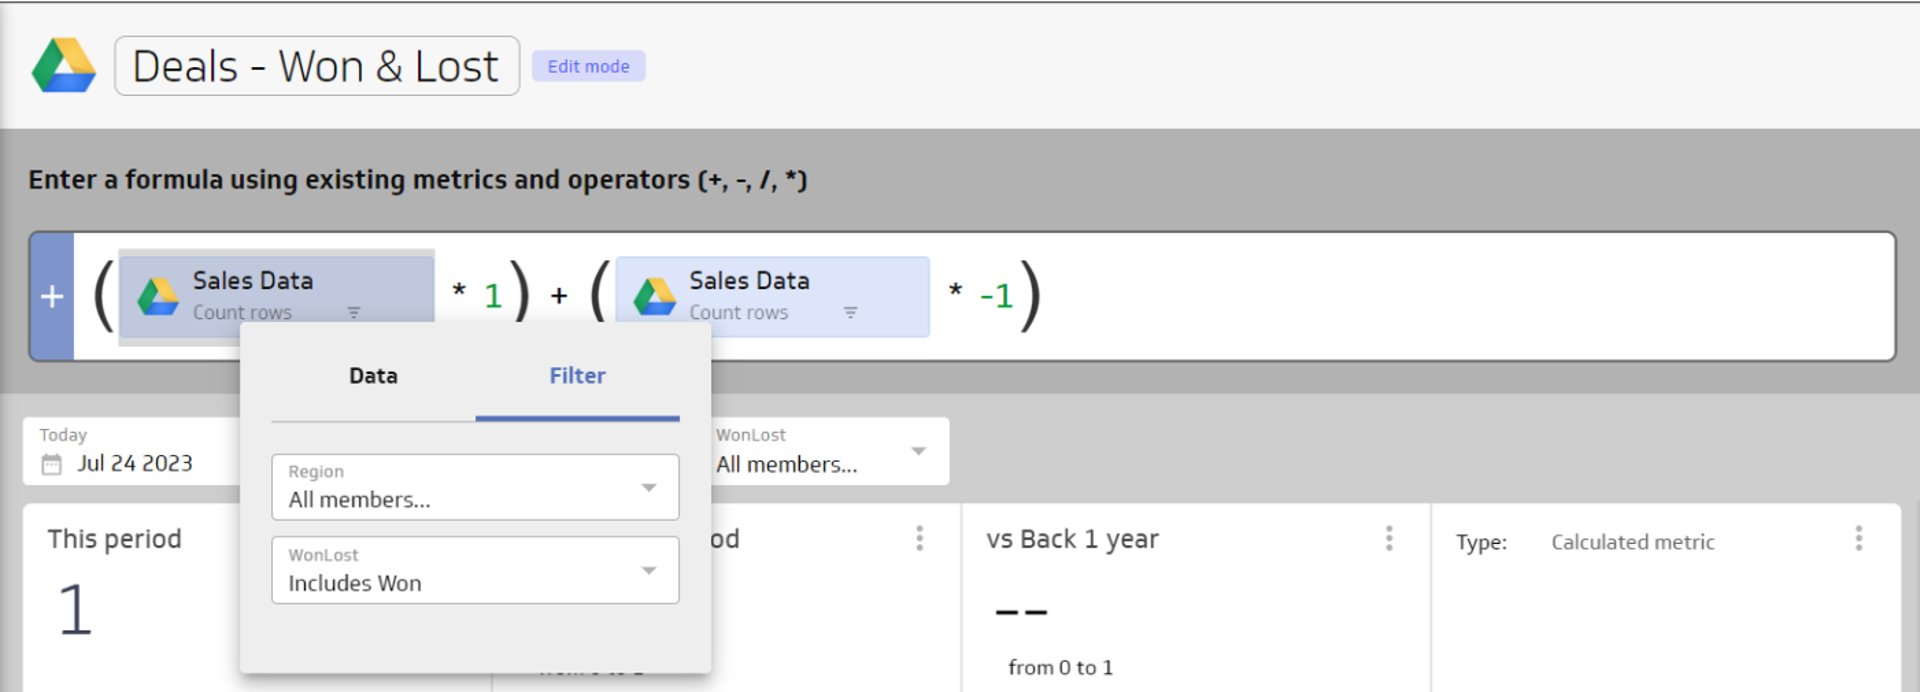
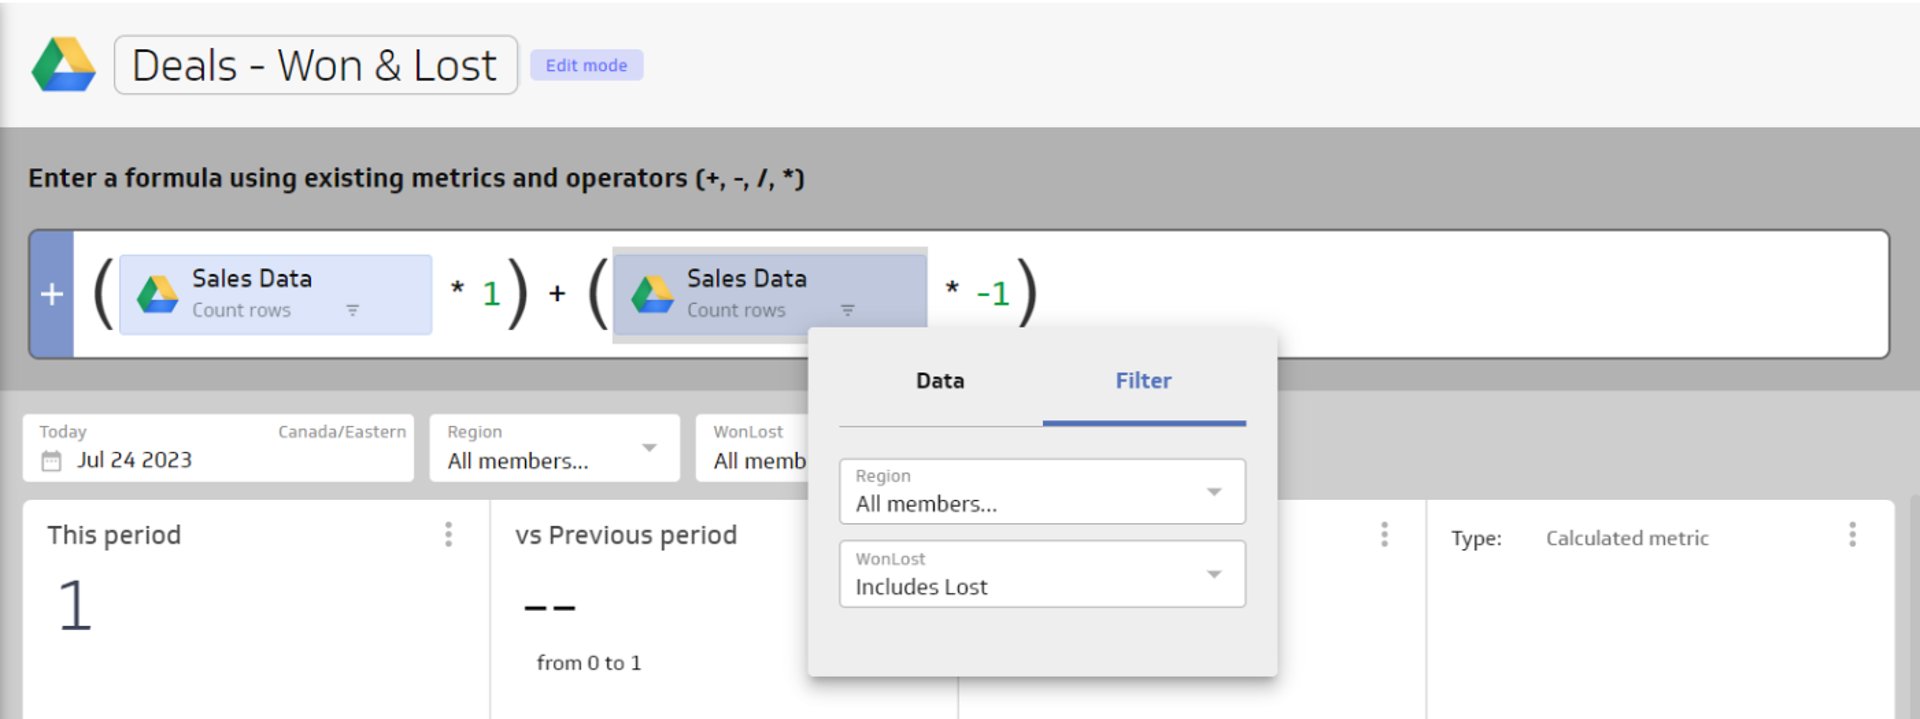
When you create calculated metrics you can use operators and parentheses in your formula. BEDMAS rules apply and can help you to precisely calculate metrics.
You can also insert numeric values into the formula to offset value or to work in conjunction with how your metrics are set up. For example, if you want to display positive values that have a negative context, such as won and lost deals.
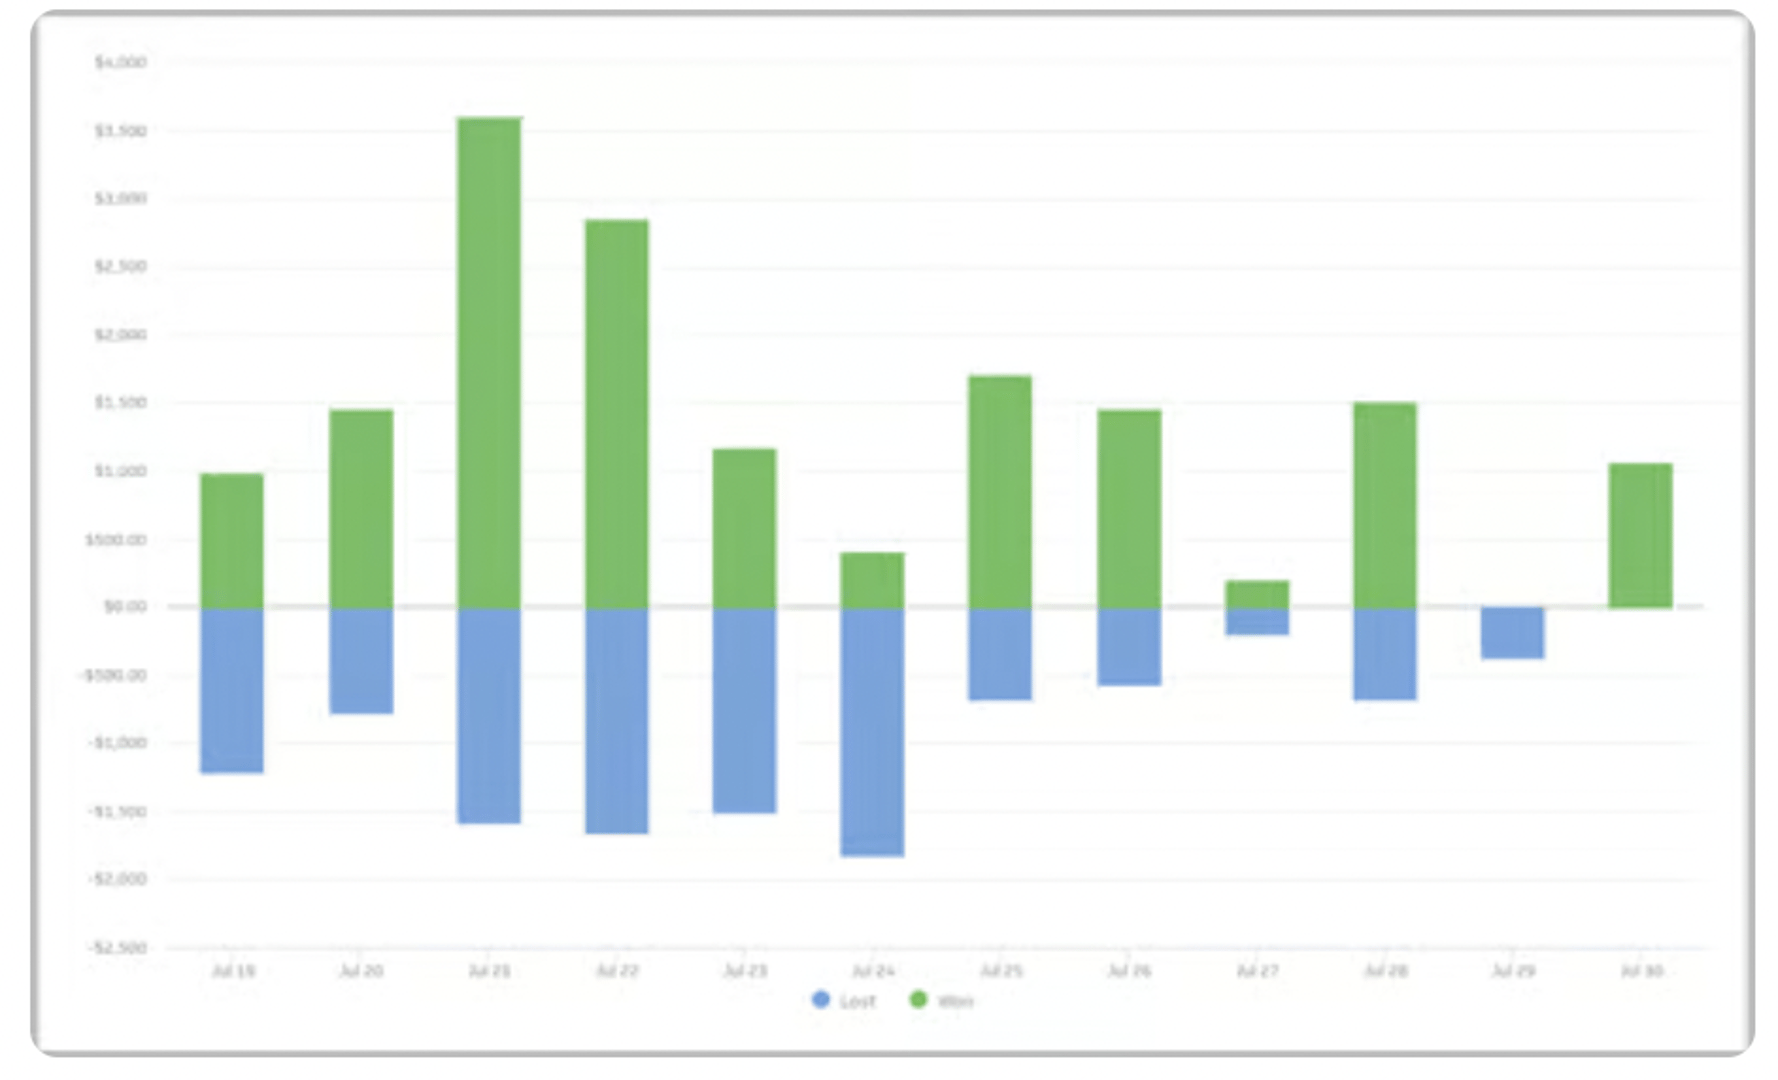
The resulting data visualization is precise and helpful for the entire team, and it tells a story.
Calculated metrics give you precision and control
Since all metrics are created using the same system, it’s possible to create a calculated metric from any metric in your PowerMetrics account. Any data history you have stored up in your metric will be included in the calculation and shown in the data visualization view. Common dimensions in your metrics will also be available for filtering and segmentation, inviting everyone in your team to perform deeper analysis.
The metrics-based approach unlocks capabilities that would otherwise require coding or configuration. Our hope is that it will give you the precision and control you need to make better decisions without having to delve too deep into complex data analysis. Want to learn more about this feature? Our support documentation provides everything you need to be successful. Check out the documentation.
Related Articles

2025 BI and Analytics Trends for Small and Mid-Sized Businesses
By Allan Wille, Co-Founder — December 18th, 2024
Case Study: How Media Propulsion Laboratory improved client analytics with the PowerMetrics – BigQuery integration
By Cathrin Schneider — September 12th, 2024
Metrics provide rich context for better AI: Introducing the new PowerMetrics AI experience
By David Mennie — June 21st, 2024