Email Website Traffic Metrics Metric
Increase your goal conversion rates with the right email website traffic data.
Track all your Email Marketing KPIs in one place
Sign up for free and start making decisions for your business with confidence.
Why Monitor Email Website Traffic Metrics?
Email marketing is one of the top performing marketing tools for digital marketers, bringing in qualified leads and significant Return On Marketing Investment (ROMI). Quality email content drives traffic to your website, and with the right call-to-actions and compelling pages, email marketing can significantly increase goal conversion rates.
Monitoring email website traffic gives digital marketers insight into how their email campaigns and lists are performing, which content is the most popular with prospects, and how they can improve upon their content to bring in more traffic and qualified users.
How to Monitor the Right Email Website Traffic Metrics?
There are a number of metrics available for digital marketers to choose from, but some are more useful than others. As with all marketing metrics, email website traffic metrics need to be actionable, insightful, and easy-to-read and analyze. Here are the top metrics for monitoring email website traffic.
Email Website Traffic metrics
Email Traffic Performance
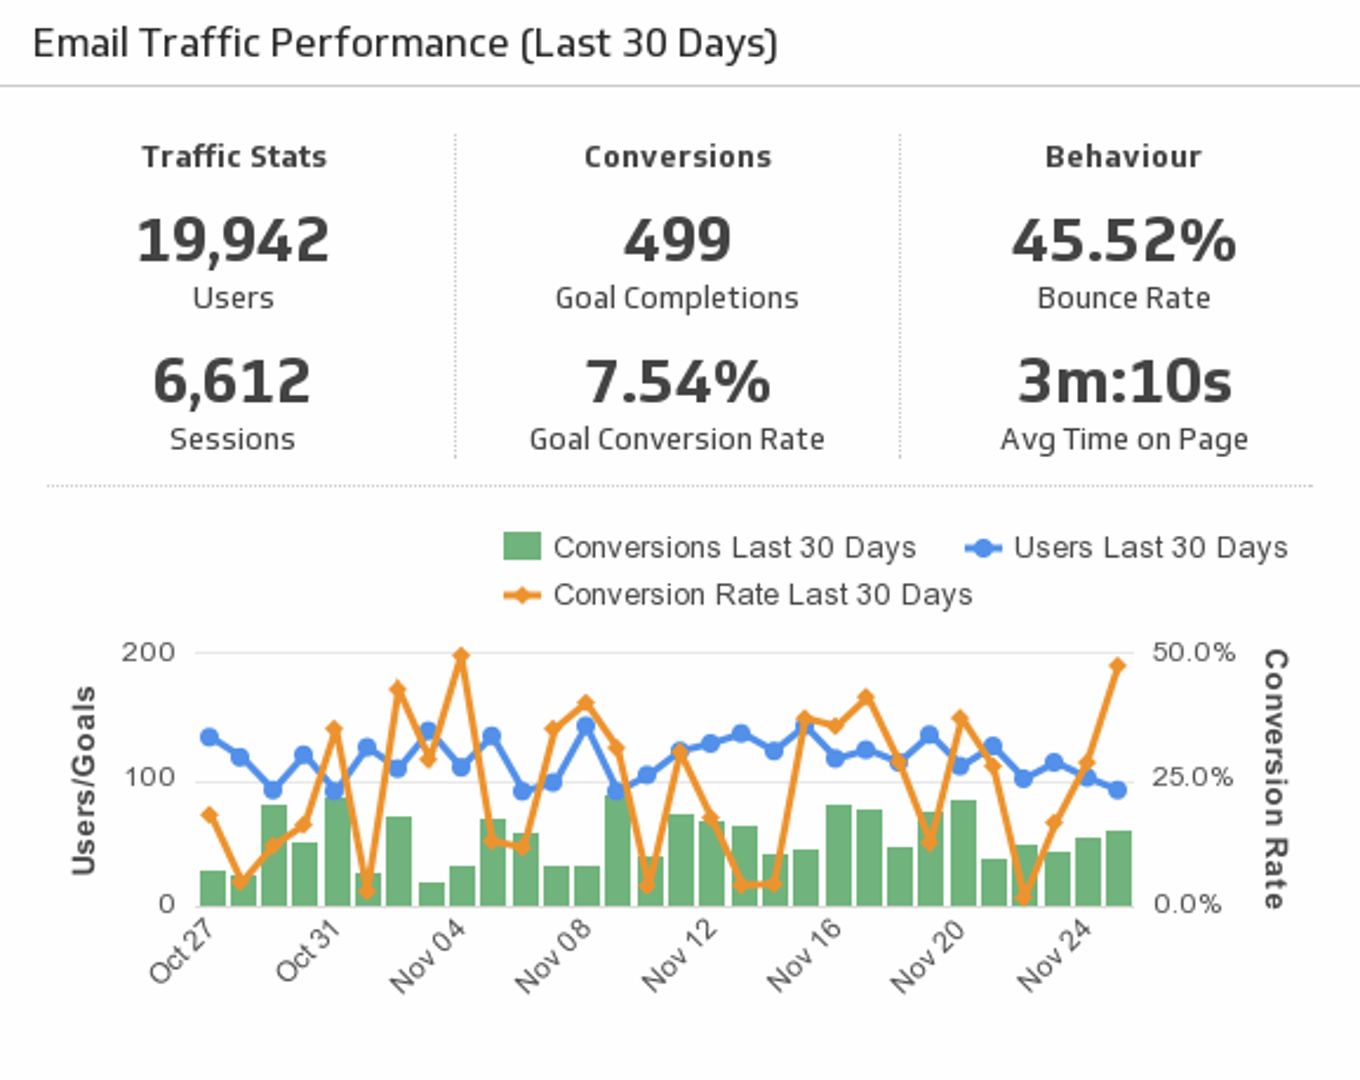
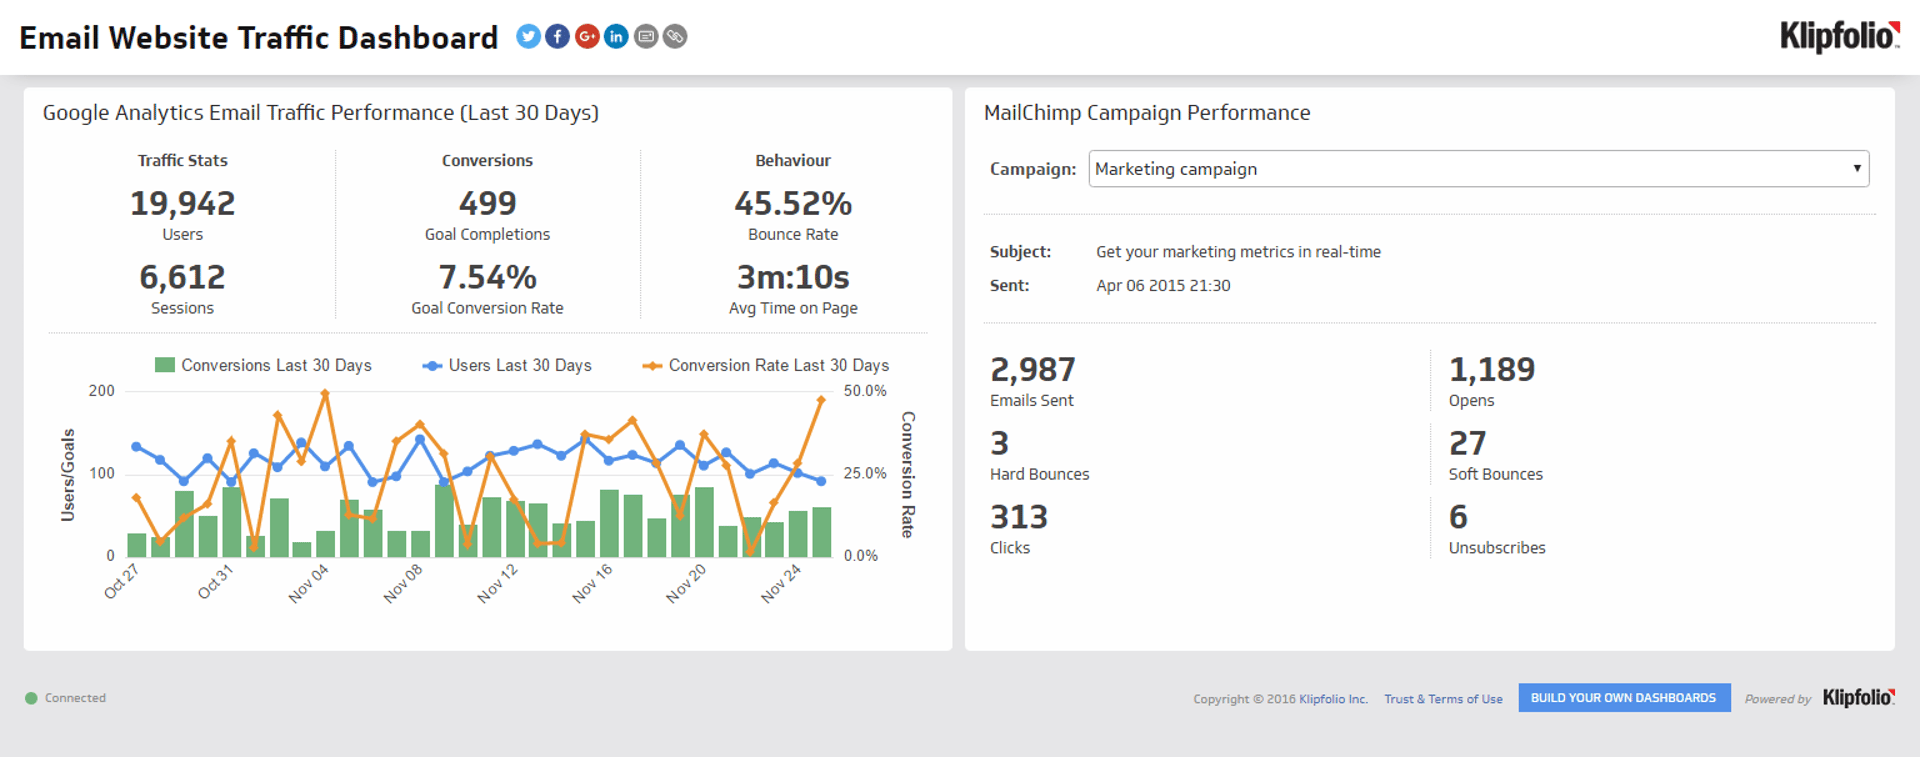
This metric displays the most important data that digital marketers need to effectively monitor their email traffic performance. Tracking traffic statistics, conversions, and user behaviour alongside a clear visual comparison between key data points allow marketers to quickly assess their traffic performance and make improvements.
Email Traffic Performance Key Terms
Traffic Stats: This section in the metric displays the number of users reached through email marketing, and the number of instances that the email content was interacted with (either opening the email, clicking a link on the email, replying to a prompt on the email, etc.)
Conversions: This section of the metric monitors goal completions and conversion rates. A goal can be anything from getting a user downloading a piece of content to clicking on another page on your website.
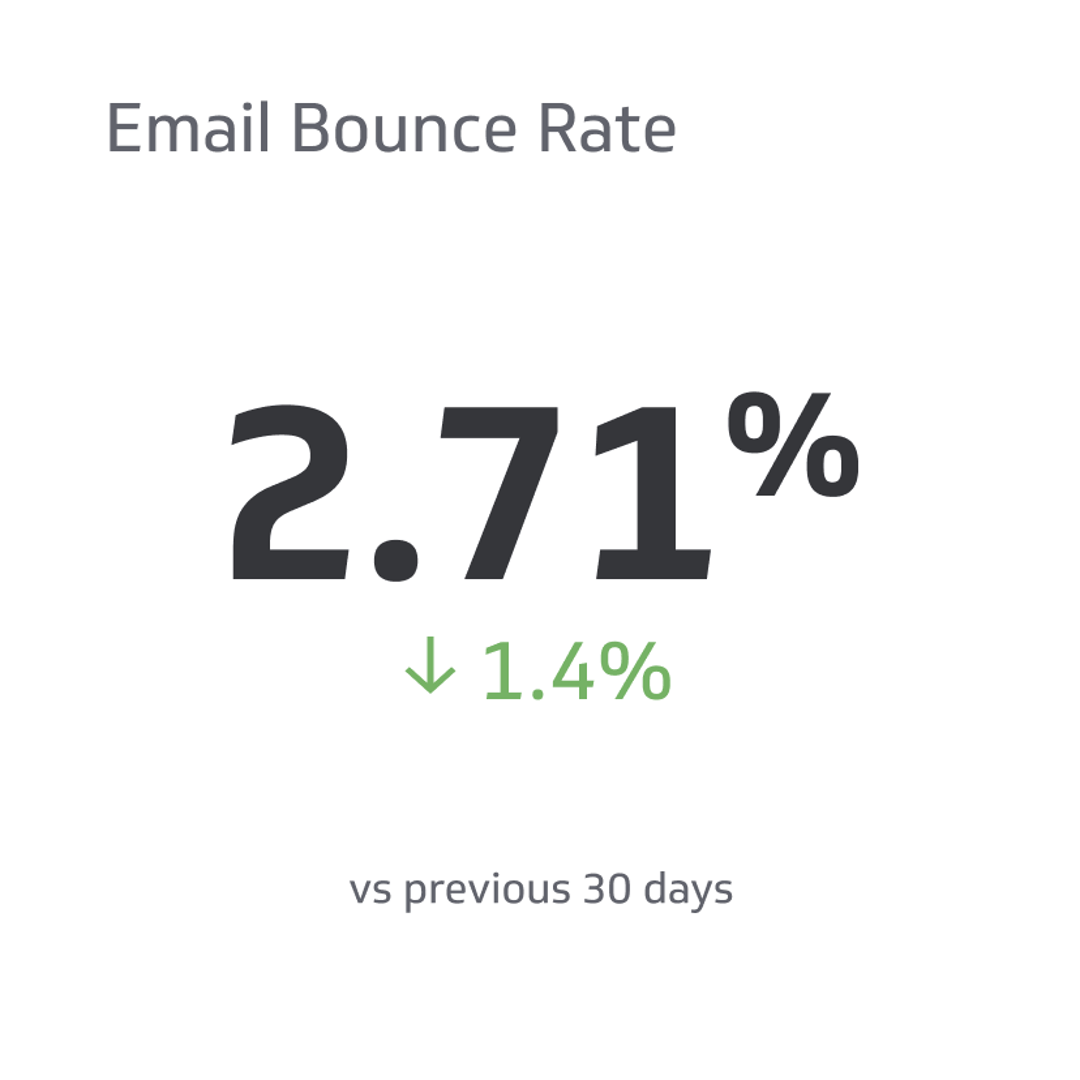
Behaviour: This section tracks how leads interact with your content, specifically, how long users stay on your page, and the overall percentage of bounces.
Bounce Rate: A soft bounce occurs when an email that was sent to a user bounces back because that user’s mailbox is full or the server was down. A hard bounce occurs when the email address the email is being sent to is either invalid or does not exist.
These examples were all built with Campaign Monitoring. Learn more: Google Analytics Dashboard
Campaign Performance
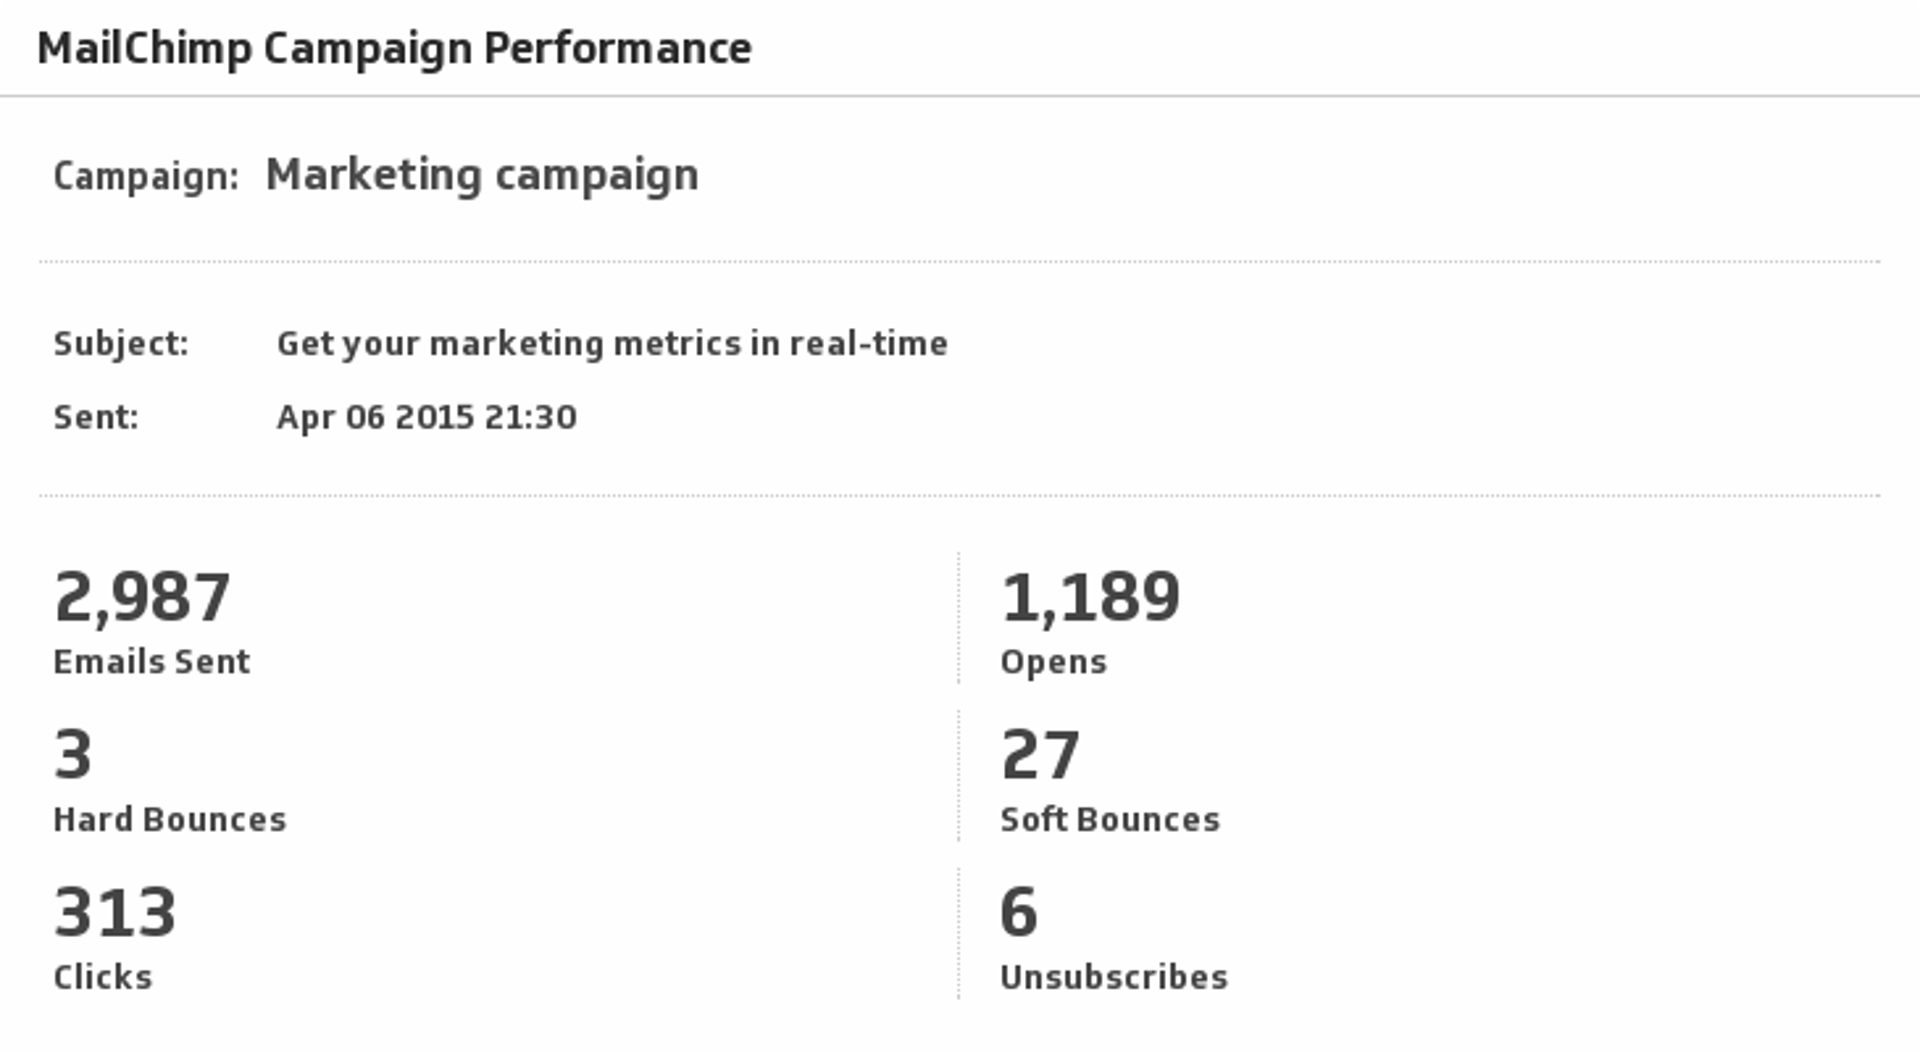
This metric is a great way to evaluate the effectiveness of an email campaign and whether to improve on the email and landing pages related to it, to build similar email campaigns, or to discontinue the campaign all together.
Why this metric?
The MailChimp Campaign Performance metric gives digital marketers insight into the performance of each of their email marketing campaigns. The metric provides important information for measuring and comparing success; allowing marketers to understand the reach of the email, the interest in the subject line, the actions taken within the email, and the number of unsubscribes the email prompted.
This example was built with Campaign Monitoring. Learn more: MailChimp Dashboard
Related Metrics & KPIs