Optimizely
Optimize your user experience with the help of Optimizely. With web personailization and experimentation, along with reconendations and analytics, Optimizely helps you create a better experience for your customers.
Track all your Optimizely KPIs in one place
Sign up for free and start making decisions for your business with confidence.


Build an Optimizely dashboard with Klipfolio
With Klipfolio, you can build a custom Optimizely dashboard to monitor all past and current A/B tests you are running. Use a real-time dashboard to make decisions based on results. Learn how to connect to Optimizely with Klipfolio.
How to build an Optimizely dashboard
There are two ways to build Optimizely dashboards in Klipfolio:
- Klip Gallery - Use pre-built Optimizely metrics
- Connector Gallery - Use the Connector Gallery to create a custom Optimizely dashboard
Use pre-built Optimizely metrics
Assemble a Optimizely dashboard by selecting pre-built metrics from the Klip Gallery.
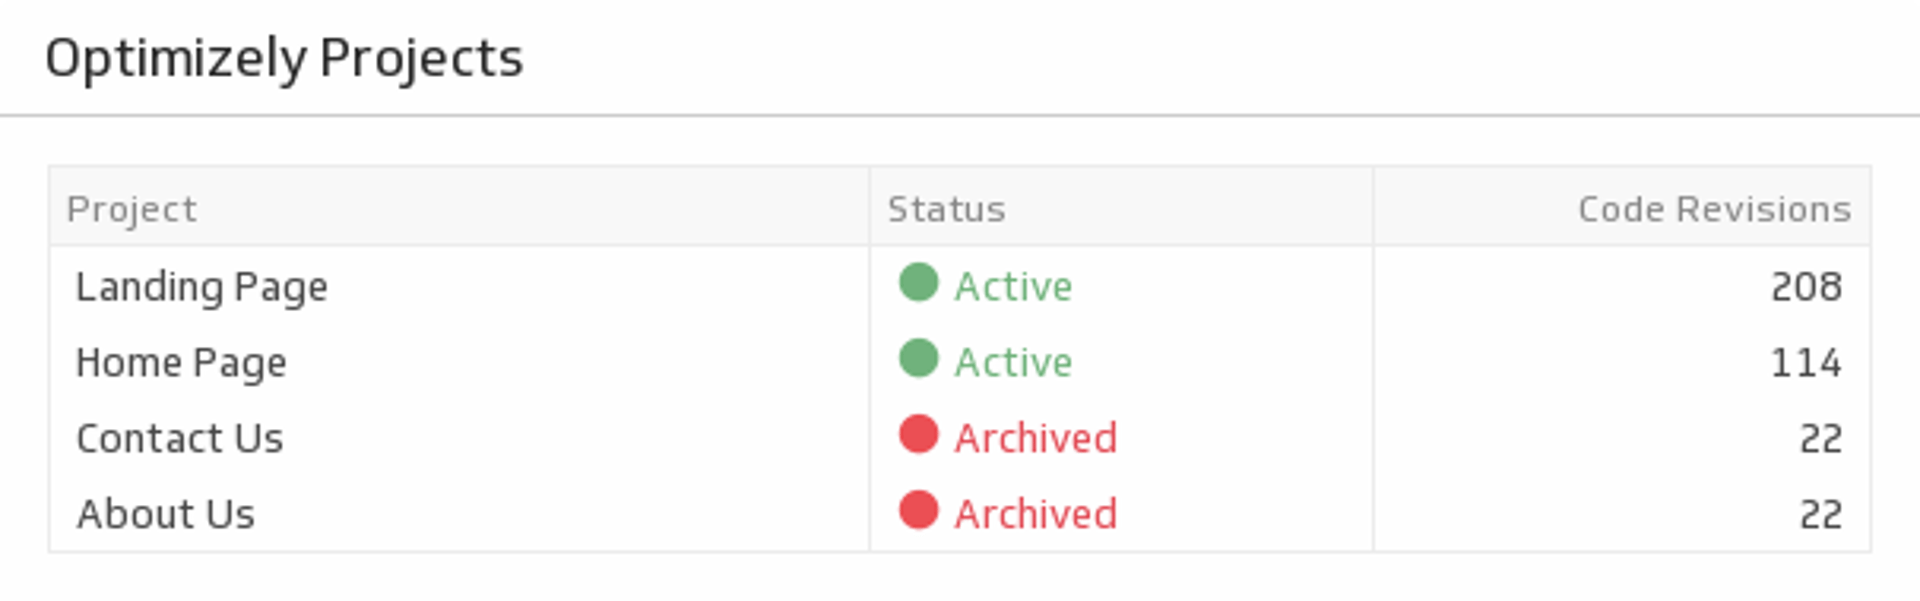
Projects
A summary of your Optimizely projects, statuses, and number of code revisions.

Use the Connector Gallery to create a custom Optimizely dashboard
With our Connector Gallery, you can create custom API queries to pull in data from your Optimizely account. Building custom queries allows you to specify the metrics and time periods that you want to track.
You can use custom queries to build out visualizations in Klipfolio. You can also combine your Optimizely data with other relevant data to create your custom dashboard.
Learn more about working with the Optimizely API and how you can start building your own Optimizely queries in Klipfolio.
