
Call center metrics & KPIs
Metrics & KPIs for modern call centers
After Call Work Time
Blockage rate
This week
1.2%
vs. 1.4% last week
Keep your call center on track with the right metrics
Your call center handles thousands of interactions while holding customer satisfaction together under pressure. To do that well, you need clear, reliable numbers: current service level, call volume, resolution rates. The right call center metrics and KPIs give you that clarity, even on the busiest days.
Best call center metrics to monitor
Knowing which metrics to watch is the difference between reacting to problems and preventing them. The KPIs below cover the full picture: customer experience, agent performance, and operational efficiency.
Tracking these consistently means you're not waiting for someone to pull a report or piecing together numbers from different systems. You know where things stand, and you know what to do next.
1. First Contact Resolution (FCR)
First Contact Resolution measures the percentage of customer interactions resolved during the first call, with no follow-up needed. A high FCR rate means customers get answers without having to call back, which saves your team time and keeps satisfaction high.
2. Average Handle Time (AHT)
Average Handle Time is the average duration of an agent's interaction with a customer, including hold time and after-call work. Lower Average Handle Time generally signals efficient call handling, but balance it against resolution quality. Rushing customers through a call to hit a number costs you more in repeat contacts than it saves.
Call Center Metrics & KPIs
Active and Waiting Calls
Measures current volume compared to the number of callers waiting to be patched through to an agent.
Agent Schedule Adherence
Measure how effectively call centre agents use their scheduled working time.
After Call Work Time
Measure the total amount of time it takes to complete post-call work.
Agent Utilization
Measure the percentage of time agents spend actively working on calls and call-related tasks.
Average Handle Time
Measures the average duration of each customer interaction, including talk time, hold time, and after-call work.
Average Sales per Agent
Measure the average total sales revenue or volume each agent generates within a reporting period.
Block Error Rate
Measure the percentage of unintentional blocks on a digital circuit or call centre system.
Blockage
Measure the percentage of incoming calls that fail to reach an agent due to staffing or technical issues.
Call Abandonment
Measure how many callers hang up or disconnect before they can be connected to one of your agents.
Call Arrival Rate
Track the average number of incoming calls to plan staffing and manage capacity effectively.
Call Center Status
Monitor real-time agent activity and call flow to respond quickly to demand spikes.
Call Completion Rate
Measure the percentage of outbound or inbound calls that connect successfully compared to total attempts.
Call Resolution
Measure the outcome of each call handled by your agents.
Call Setup Success Rate
Measure the percentage of call attempts that successfully connect to the dialled number, before any conversation begins.
Call Volume
Monitor your team's capacity and workload by tracking the total number of calls handled.
Callback Messaging
Track the number of callers leaving messages requesting a callback instead of waiting on hold.
Customer Calls Answered in the First Minute
Measure the percentage of inbound calls your team answers within 60 seconds, and learn what drives speed, where gaps hide, and how to close them.
Cost per Call
Track this KPI to measure the efficiency and cost-effectiveness of your call center operations.
Cost per Contact
Measures how much each contact costs your call center and is a key part of any cost-benefit analyses you may run.
Customer Satisfaction
Provides an assessment of your call center's performance from your customer's perspective.
Data Network Availability
Measure the percentage of supported hours during which your data network is accessible and functioning.
Dials per Hour
Track and boost your sales team's outreach productivity.
Forecasted Contact Load to Actual Contact Load
Compare the number of contacts your team predicted against the contacts actually received to measure forecasting accuracy and support smarter staffing decisions.
Interactions Routed Properly
Measure the percentage of calls forwarded to the right channel and agent on the first attempt.
Longest Call Hold
Measure the maximum amount of time a caller waited on hold before reaching an agent.
Longest Call Length
Monitor the duration of the longest call handled by your team.
Longest Delay in Queue
Measure the longest time a caller was held in the queue before being connected to a call agent.
On-Hold Time
Measure the average amount of time callers spend on hold and improve customer experience.
Peak Hour Traffic
Identify the time of day when your call centre receives the most incoming calls.
Repeat Calls
Measure the percentage of calls that addressed the same issue or subject, and identify opportunities to improve first contact resolution.
Revenue per Successful Call
Measures the average revenue generated from each completed call that results in a sale or desired outcome.
Sales per Agent
Measure the total number of sales closed by each individual agent to assess productivity and identify coaching opportunities.
Service Level
Measure your call center's ability to respond to customers within the timeframes defined in your Service Level Agreement (SLA).
Subscriber Acquisition Cost
Measure the average cost of acquiring a new subscriber.
Talk Time
Monitor the average amount of time an agent spends on a call with a customer.
Time Lost Due to Technology Issues
Measure the total duration of downtime caused by system errors, network outages, and other technology failures.
Call Center Dashboard Examples
- Call Center
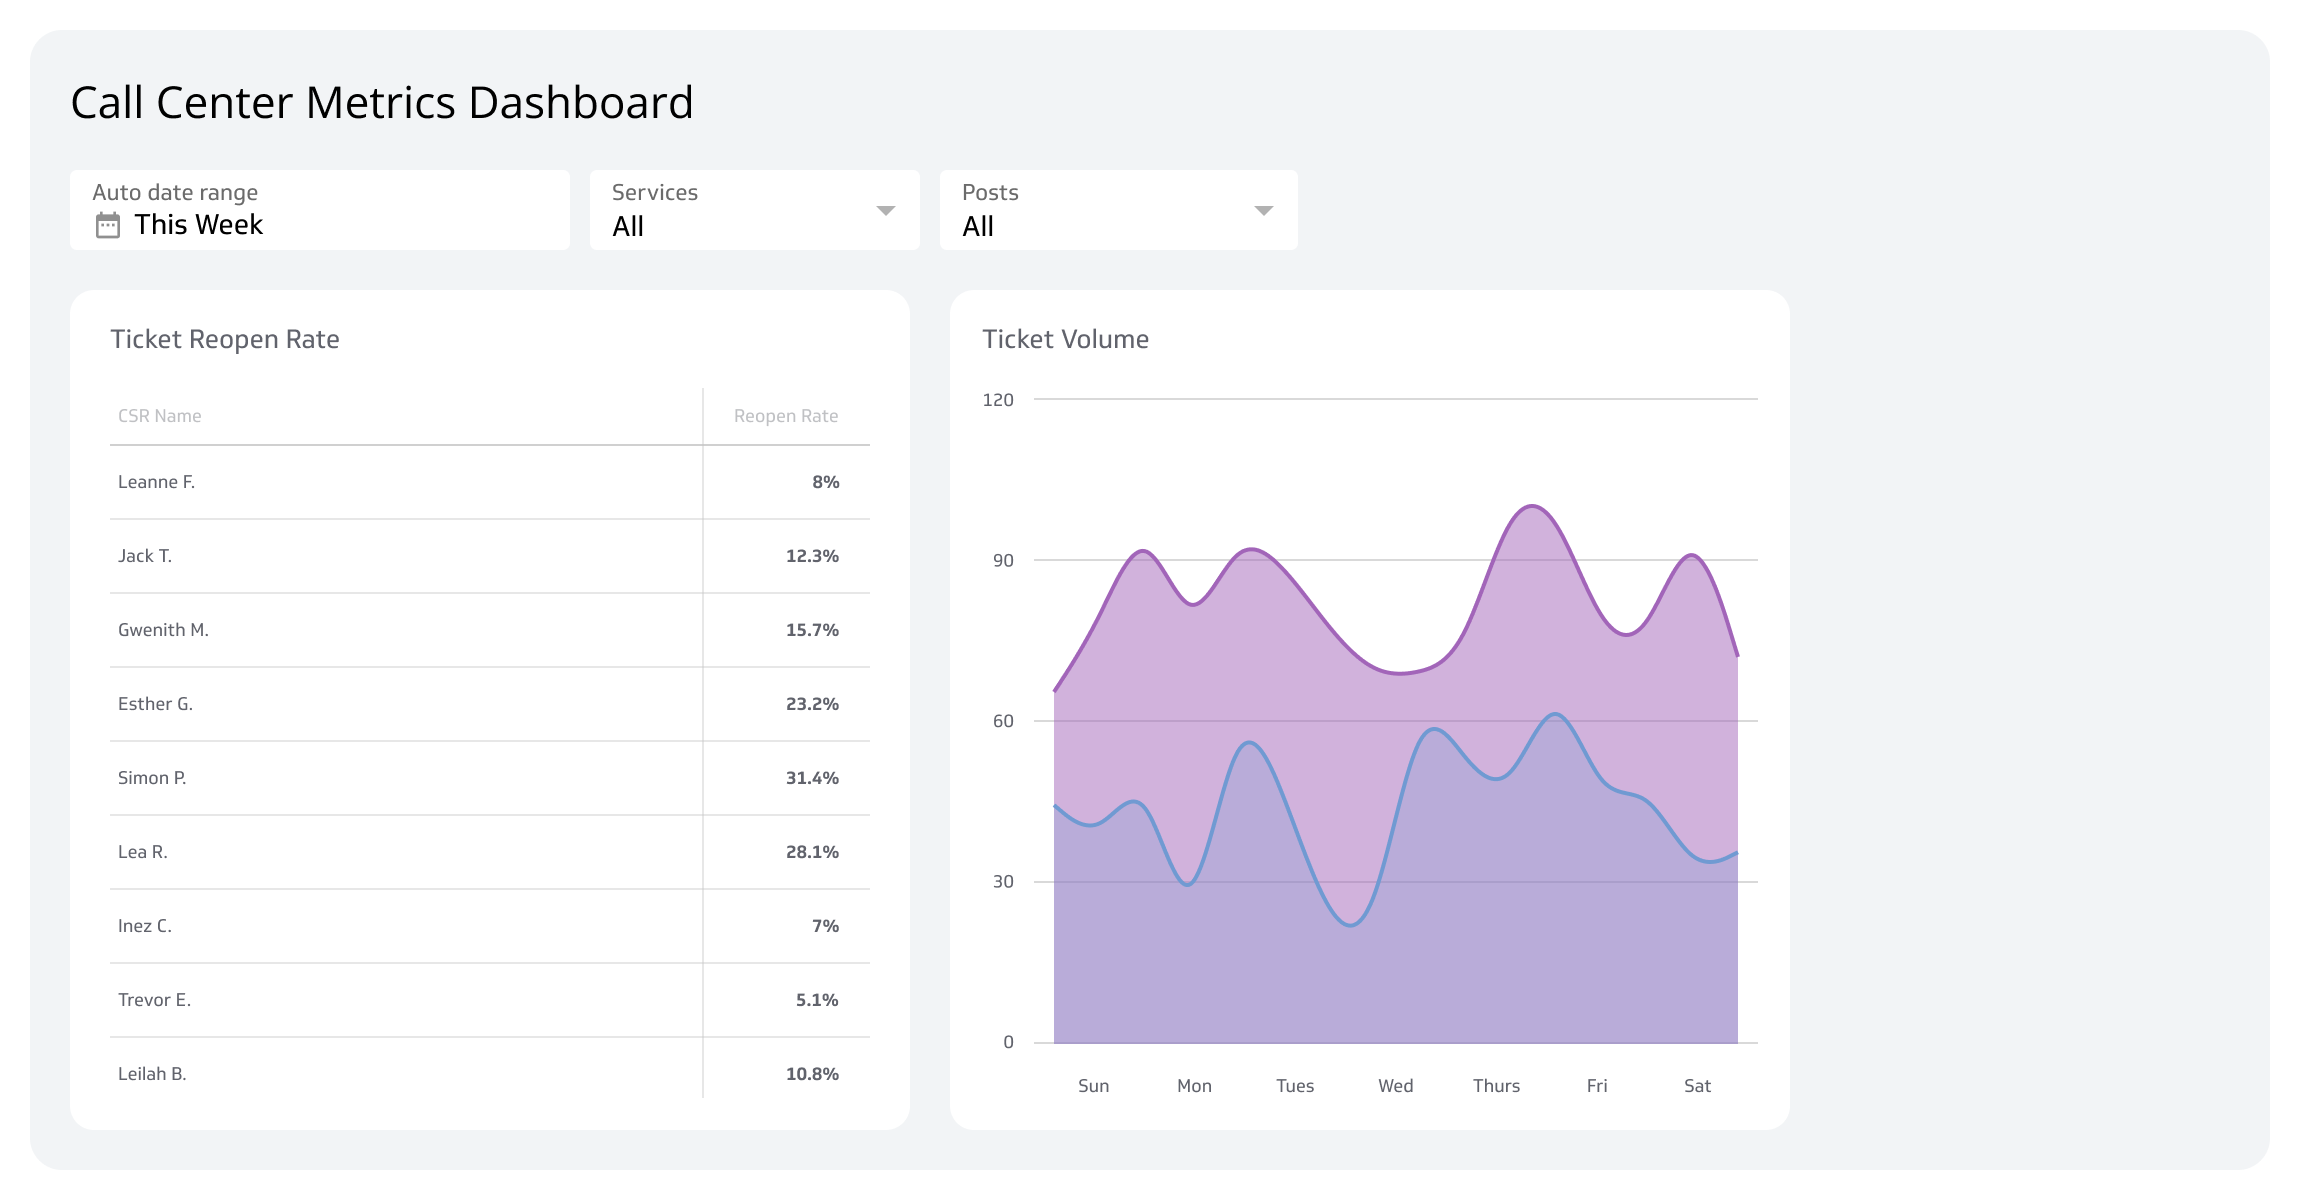
Call Center Metrics Dashboard
Track your team's performance and improve service in real time.
- Call Center
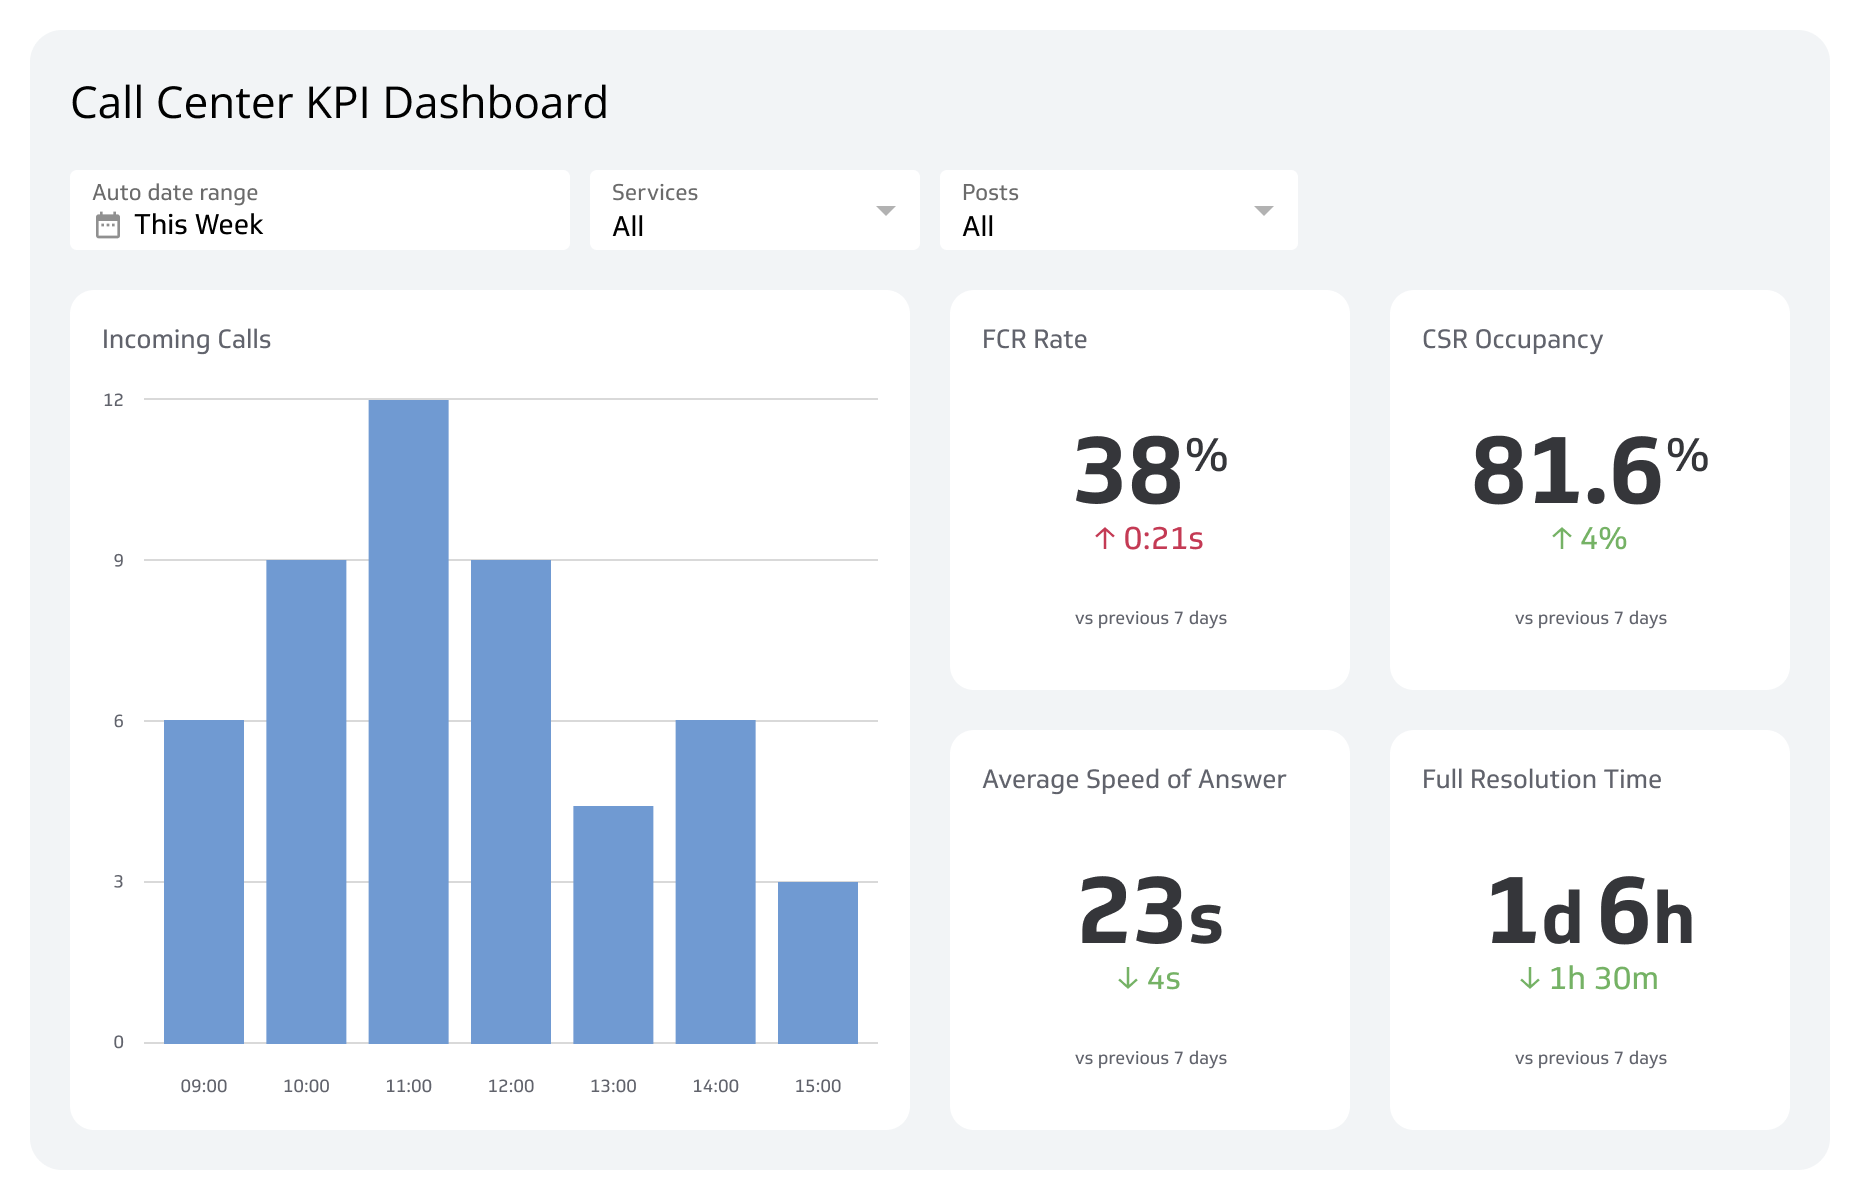
Call center KPI dashboard examples
A centralized, real-time view of the metrics that matter most, so call center managers can coach agents, manage volume, and act with confidence.
- Call Center
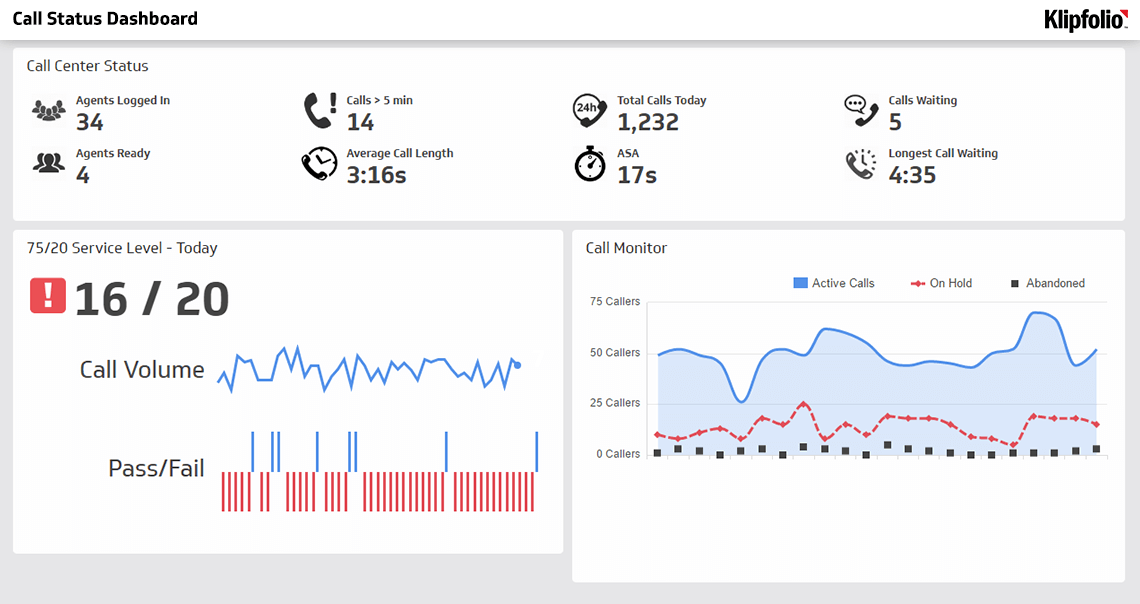
Call Status Dashboard
Your real-time command center for call center operations.
3. Service Level
Service Level is the percentage of calls answered within a set time threshold, typically measured in seconds. It tells you whether your staffing matches your call volume. A strong Service Level means customers reach someone quickly, which is often the first test of whether they trust your operation.
4. Abandoned Call Rate
Abandoned Call Rate measures the percentage of incoming calls disconnected before reaching an agent. A rising rate is a signal worth acting on: long wait times, thin staffing, or queue management issues. Catching it early prevents a small problem from becoming a pattern customers remember.
5. Customer Satisfaction (CSAT) Score
Customer Satisfaction Score measures how satisfied customers are with the service they received, typically through a post-call survey. A high CSAT score means your team is meeting expectations. A declining score tells you something specific is breaking down, before it shows up in churn or reviews.
6. Agent Occupancy Rate
Agent Occupancy Rate is the percentage of logged-in time agents spend on active calls or after-call work. High occupancy means efficient use of your team's time, but there's a ceiling. Sustained overload leads to burnout, errors, and turnover, all of which cost more to fix than the short-term efficiency gain is worth.
7. Agent Attrition Rate
Agent Attrition Rate measures the percentage of agents who leave within a given period. High turnover raises recruiting and training costs and disrupts service consistency. Tracking this metric helps you spot retention problems early and connect them to the conditions driving them, whether that's workload, management, or compensation.
8. Call quality metrics
Call quality metrics, including Average Speed of Answer (ASA) and Mean Opinion Score (MOS), assess the technical side of call center interactions. Poor audio quality, dropped connections, or slow routing all affect how customers experience the call, regardless of how skilled the agent is. These metrics surface issues that agent coaching alone can't fix.
9. Conversion Rate
Conversion Rate is the percentage of calls that result in a defined successful outcome: a sale, a booked appointment, or a resolved issue. For sales-focused call centers, this is a direct measure of whether your team's effort is translating into results. For support teams, it reinforces First Contact Resolution as the primary goal.
10. Net Promoter Score (NPS)
Net Promoter Score measures customer loyalty by asking how likely customers are to recommend your service. It is calculated by subtracting the percentage of detractors from the percentage of promoters. A strong NPS reflects something deeper than a single good call: it means customers trust your operation consistently enough to put their name behind it.
Create custom dashboards for you and your team.
Get started with KlipsPutting call center KPIs to work
Monitoring these metrics individually is useful. Seeing them together, updated automatically, is what actually changes how you run the operation.
When your numbers are centralized and current, you spend less time chasing data and more time acting on it. You catch a rising Abandoned Call Rate before it affects CSAT. You connect Agent Attrition Rate to occupancy trends before losing another experienced agent. You walk into any conversation knowing exactly where things stand.
That's the difference between a call center that reacts and one that stays ahead. Explore our full KPI examples and templates library to find the metrics that fit your operation and start tracking them in one place.