
Summary - Are you wondering which digital marketing KPIs you should use to scale your marketing? Get the 5 most important KPIs for digital marketing success.
Quick take
- Visibility and rankings remain core. Track positions and share of voice in Search Console.
- Organic performance still leads. Watch clicks, impressions, CTR, and non-brand traffic.
- Core Web Vitals matter. Improve LCP, INP, and CLS alongside overall page speed.
- Organic landing page engagement and conversion rate show real impact. Use GA4 engaged sessions and session conversion rate.
- Index coverage and crawl health are table stakes. Fix discovery and indexing issues in Search Console.
Are you often wondering which of the many digital marketing KPIs you should use to scale your marketing efforts? While your digital marketing team may have slightly different goals, the five SEO KPIs I describe here have proven to be the most common (and most important) for the many clients I’ve worked with at Blurbpoint Media and HireSEOAgency.
Before exploring the individual SEO KPIs, let’s sneak-peek into the concept of KPI and its importance.
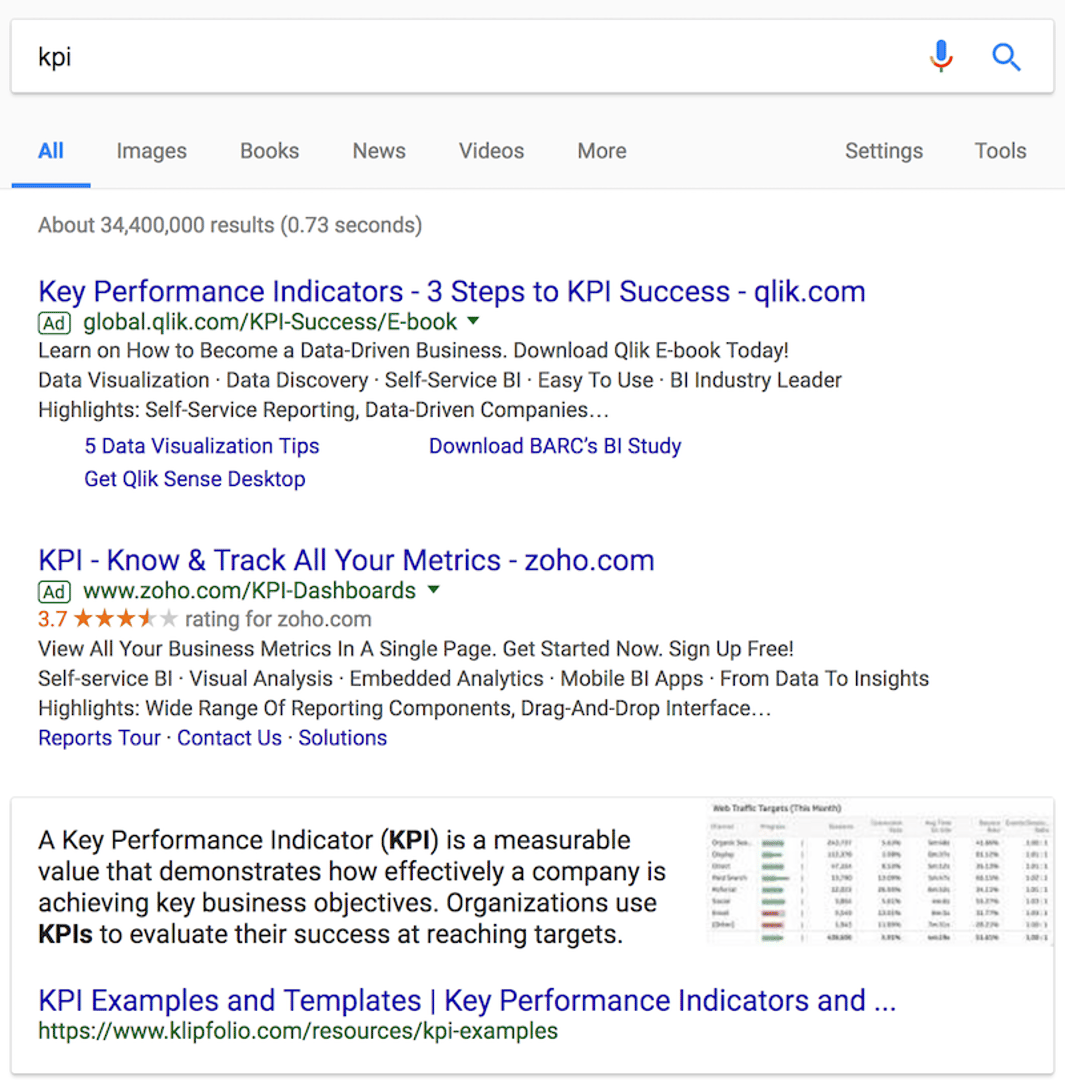
What is a KPI?
As stated in this KPI definition, a KPI is “a measurable value that demonstrates how effectively a company is achieving key business objectives.”
Organizations make use of business KPIs at multiple levels to figure out their pathways to reaching targeted goals. Understanding how to create an effective KPI dashboard allows companies (and the departments within) to determine what goals to drive toward and how best to create focused strategies to achieve those goals.
With a disciplined approach, companies can then benchmark their KPIs and compare them across time.
Let’s jump into the five most important SEO KPIs:
1. Visibility and Rankings
The rankings of the site’s pages on SERPs (Search Engine Results Pages) are a clear indicator of how well a page is optimized and how much topic authority the website has earned. In 2026, expand this view beyond single keywords to include visibility and share of voice across key topics.
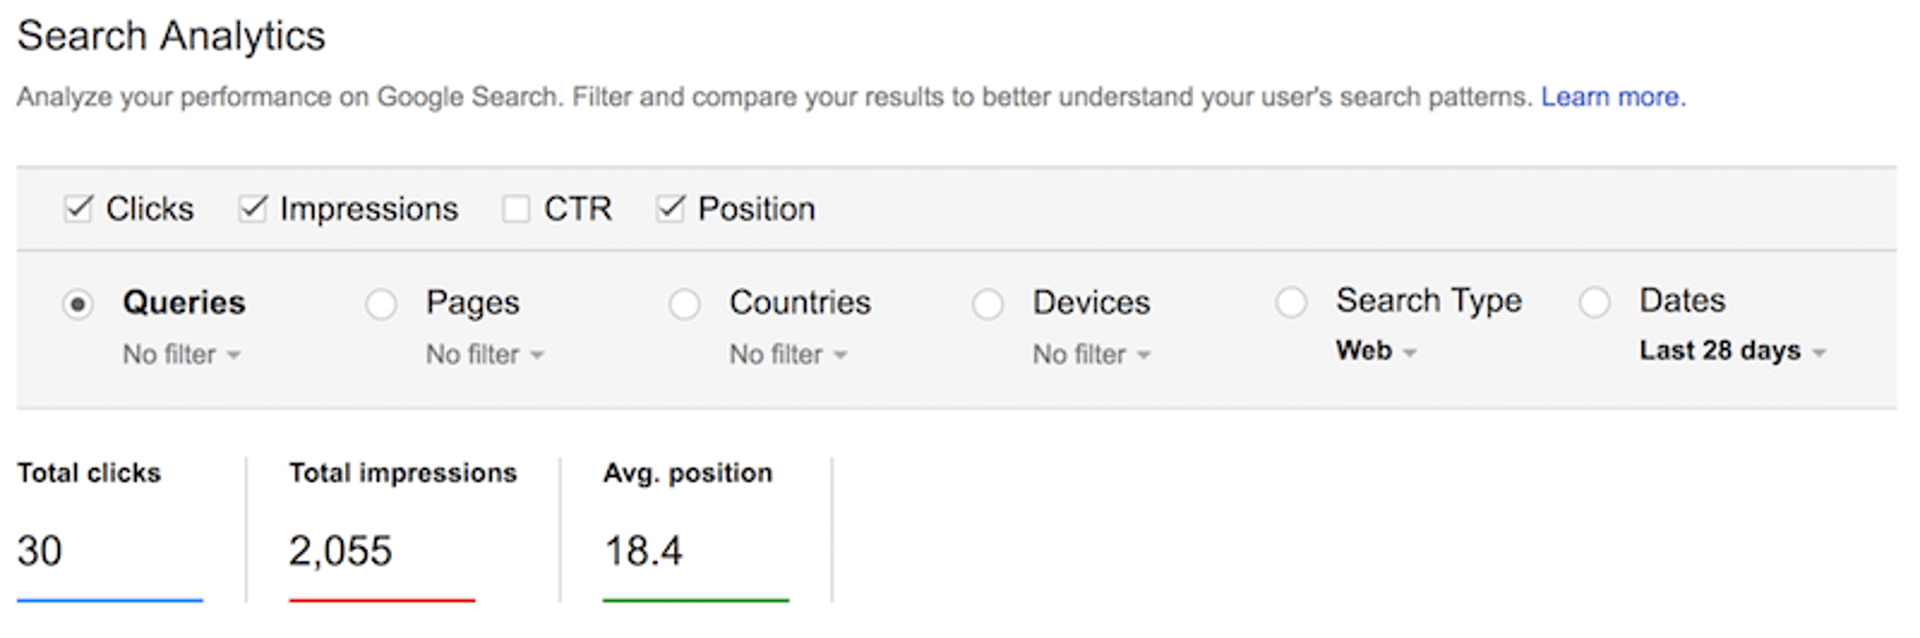
One great way to assess this KPI is through Google Search Console, where you can see how many impressions certain queries on your site generate, as well as where each of your site’s pages rank and if searchers are clicking through.
It’s important to note that the importance of keyword-only strategies has diminished and marketers place more emphasis on answering user intent. Content built to answer user queries tends to have a better chance of ranking than content built only to target keywords.
2. Organic Search Performance
Organic search results are listings on SERPs that appear when users search for specific information and arrive at a page on your website because of the relevance of your content, not because of paid advertisements. In 2026, focus on clicks, impressions, click-through rate, and non-brand traffic in Google Search Console.
Organic search performance is often the most important key performance indicator for digital marketing teams that care about inbound results.
For a deeper glimpse, see this Organic Search Traffic resource. And be sure to check out SEMrush and Moz as they offer tools to help you see and monitor your results. For paid ads, metrics such as Search Lost Impression Share can help monitor ad ranking and performance.
3. Core Web Vitals and Page Speed
Page speed remains a meaningful ranking and UX factor. In addition to overall load time, watch Core Web Vitals like Largest Contentful Paint (LCP), Interaction to Next Paint (INP), and Cumulative Layout Shift (CLS).
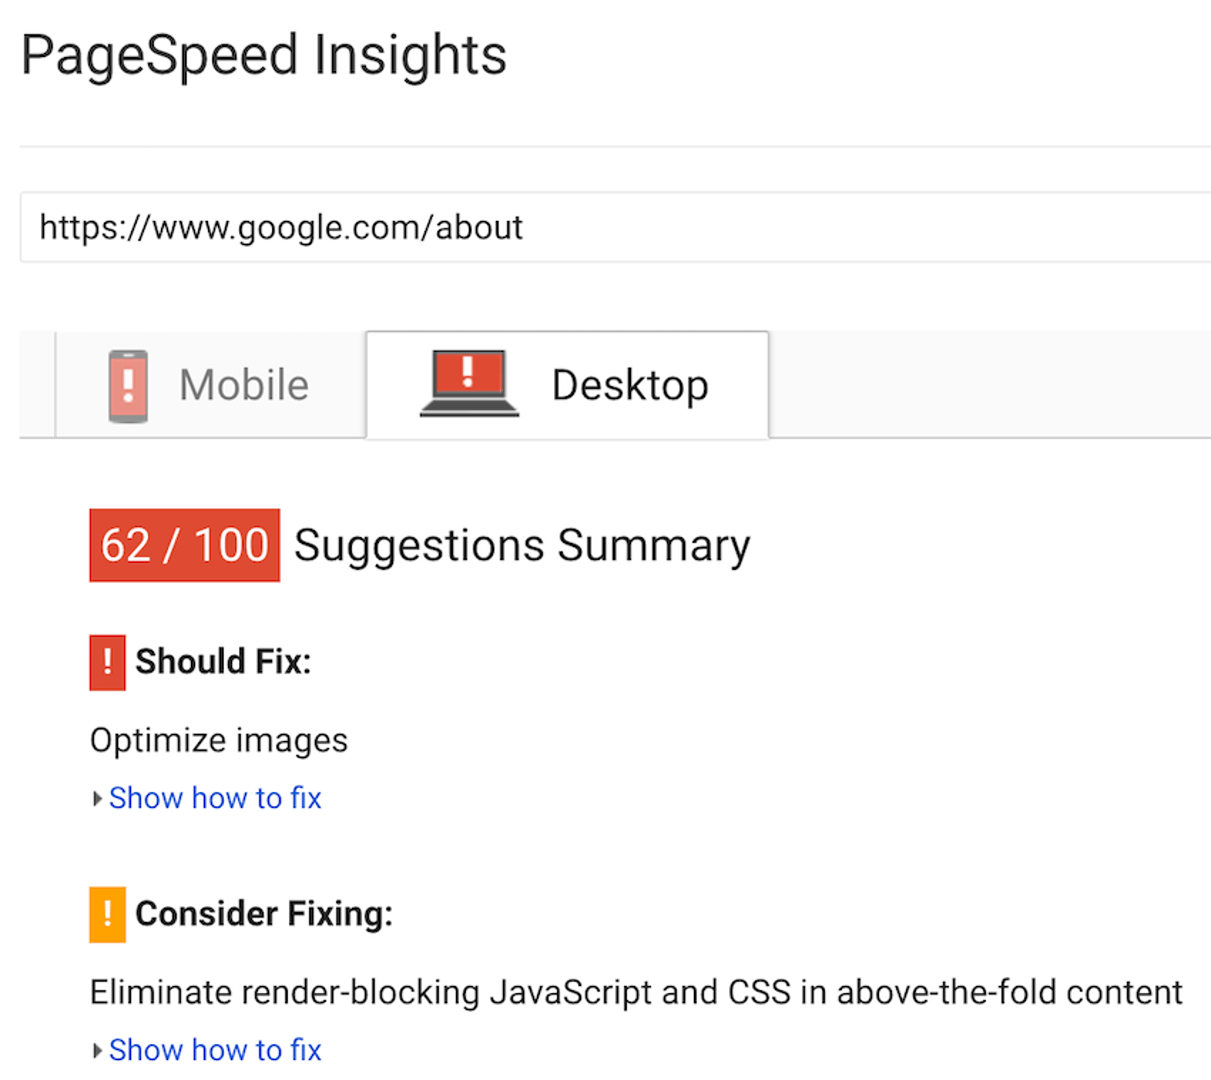
Want to check a URL’s speed factors right now? Submit the URL to Google Pagespeed Insights and the Pingdom Website Speed Test. You can also display your Pingdom results on a dashboard.
The above tools not only show your page speed, they provide advice for how to improve it.
4. Organic Landing Page Engagement and Conversion Rate
From an SEO perspective, track the organic journey and include conversion in the mix. In GA4, use engaged sessions, average engagement time, and session conversion rate to understand whether organic visitors progress through your funnel.
Most digital marketers understand the importance of landing page bounce rates, the percentage of visitors to a page who leave after visiting that page, but it’s essential to connect that behavior to conversions to show true impact.
There are many ways to track progress from search to click to bounce or conversion, but the Rand Fishkin Dashboard offers one approach to monitor this progression.
5. Index Coverage and Crawl Health
Ensure Google can discover and index your pages. Robots.txt controls crawling. A clean sitemap helps discovery. Use Search Console’s Page indexing report and URL inspection to spot and fix issues quickly.
Controlling and optimizing robots.txt and sitemap files allows Google crawlers to visit the website in a correct manner. If Google can assess who the author is, what the title is, and where the publication name is displayed (among other qualities), your content will have a better chance of ranking.
Here is Google’s guide for how to build and submit a sitemap. Depending on your content management system, there are plugins that can help you manage sitemaps and indexation. While this might not fit the traditional KPI definition, it is key to performance and a habit digital marketers should develop.
Final thoughts on SEO KPIs
While the SEO KPIs mentioned here are necessary to monitor the progress of your digital marketing efforts, planning must come before execution. Establishing a KPI is not at all a tedious task, but ensuring that it’s calculated as accurately as possible, such as with the organic search to bounce and conversion KPI, can take time to build out.
Each business is unique, and so are the KPIs it must set and monitor. At some point in your company’s trajectory, your digital marketing team will want a solid grasp of these five SEO KPIs.
About the author:
Sanket Patel is Founder & Director of Blurbpointmedia.com, a digital marketing company. His passion for helping people in all aspects of online marketing flows through in the expert industry coverage he provides. He is an expert in Web marketing, Search Engine Optimization, Social Media, Affiliate Marketing, B2B Marketing, Online Advertisement of Google, Yahoo and MSN
Related Articles
6 Facebook ads reports every agency needs to attract and retain high-ticket clients
By Tanya Brody — April 10th, 2026
Business Metrics vs. KPIs: What’s the Difference?
By Jonathan Taylor — March 13th, 2026
What is a KPI, metric, or measure?
By Jonathan Taylor — January 20th, 2026